International Journal of Mathematical Archive-8(7), 2017,
281-287
Available online throug
ISSN 2229 – 5046
International Journal of Mathematical Archive- 8(7), July – 2017 281
SALE CHECKOUT OPERATION IN BIG BAZAAR USING QUEUING MODEL
JITENDRA KUMAR*
1, VIKAS SHINDE
2AND SANTOSH BHARADWAJ
31,2
Department of Applied Mathematics,
Madhav Institute of Technology & Science, Gwalior – (M.P.), India.
3
Department of Mathematics, Anand Engineering College, Agra – (U.P.), India.
(Received On: 04-07-17; Revised & Accepted On: 27-07-17)
ABSTRACT
T
his paper deals with analysis of queueing model for Big Bazaar checkout operations. Multiple queues with multiple servers model is employed to examine the checkout operation of service unit (cash counter) for Big Bazaar. We analyze the efficiency of the model in terms of utilization and waiting length of queue. So that we can able to estimate the waiting time and waiting length of queues for validating our analysis. We have been also carried out various performance measures.Keywords: Queue Models, Multiple servers, Optimal service, Quality of service and Total Cost.
1. INTRODUCTION
Big Bazaar is a corporate group in the retail business more than 1700 stores is operated. These stores have different profites depending on location, range of products and size. Big Bazaar stores are categorized as
(i) Convenience type stores for daily retail needs,
(ii) Mid-size supermarkets, located near residential blocks and carrying a wide range of products,
(iii)Super stores which handel the big crowed. Having large and planned stores where display of the products to attract the attention of the customer to each and every product,
(iv)Max/ Big Bazaar ensuring availability of quality full range of groceries as well as fashions, home wares, entertainment and home appliances along with electrical /electronics items which does not offers by small stores.
Today customers don’t have more time to spend in shopping. Customers require all items/ products at one lace. Such demands of customer uplift/grow the business of big departmental stores like Big Bazaar to sell their products more efficiently and effectively. Generally, we have seen three or four checkout counters n one place. We analyze the performance of checking out service time (service rate) during the checking out process and identity the time gap between two or more customers. Researchers have identified such issues and developed new models to achive quality of service for customers.
Berhan [1] analyzed the performance of multiple server queue. Azmat [2] improved performance of service industries where arrival and service time are random for complex decision environment. Toshiba [3] established the optimization model of queueing system and calculate the optimal model of queueing, optimal number of service stations to improve operational efficiency and optimal service rate and service efficiency by the operating costs. Chowdhury [4] describe several common queueing situations and present mathematical models for analyzing waiting lines for the bank system to measure customer’s satisfaction level on the service using multi-channel queueing model with Poisson arrival and Exponential service times. Famul and Bhathawala [5, 7] described a single server that has unlimited queue capacity with both service and arrival rate follow a Poission distribution. Wang [6] present various queueing model to analyses the performance of service industries. Holman et al. [8] established the batch arrival general service queueing model. Zhang [9] analyzed the service sector of queuing system. Zhao [10] gave innovative bank management through queueing theory. Li [11] determined the optimal design of service in supermarket. Kumar et al. [12] proposed various performance indices for multi server model.
Corresponding Author: Jitendra Kumar*
1,
1Department of Applied Mathematics,
This paper is organized as follows. In section 2, described notations and queueing model. Performance measures corresponding customers and service unit is in section 3. Numerical illustrations for comparing the analytical results are provided in section 4. In section 5, Quality of service and optimal service rate is obtained with each service unit (cash counter). Finally in section 6 we draw the conclusion.
2. MODEL DESCRIPTION
1.1Notations
n = Number of customers in the system (in queue plus in service) k = Number of parallel servers (Checkout operation units in Bi Bazaar)
𝜆 = Arrival rate per unit of time µ = Service rate per unit of time S= Number of Servers (Cash Counter) Sµ = Serving rate when S > 1 in a system
Pn = Steady-state probability of exactly n customers in the system
ρ = The utilization factor (= 𝜆/(Sµ)) (the expected factor of time the server is busy that is, service capability being utilized
on the average arriving customers)
2.2 Queueing System: customers requiring service are generated over time by an input source. This service mechanism is described in three ways:
• Single queue with single server model
• Single queue with multiple server model
• Multiple queue with multiple server model
Figure-1: Queuing Model for Single-Queue with Single Server
Figure-2: Queuing Model for Single-Queue with Multiple Parallel Servers
Jitendra Kumar*, Vikas Shinde and Santosh Bharadwaj /
Sale Checkout Operation in Big Bazaar using Queuing Model / IJMA- 8(7), July-2017.
© 2017, IJMA. All Rights Reserved 283 The single queue, multi queue and multi queue with multi servers are illustrated in figures 1, 2 & 3. The following three situations are examined in this paper.
We discussed queueing model with multiple servers, which follow a Poisson probability distribution at an average rate λ customer per unit of time and are served on a first served basis by any of the servers. The service times are distributed exponentially with an average of µ customers per unit of time. It is further assumed that only one queue is formed. If there are n customers in the queueing system at point in time, then following two cases may arise:
i. If n < S (number of customers in the system is less than the number of servers) then there will be no. queue. However, (S- n ) number of servers are not busy,
The combined service rate will then be: 𝜇𝑛=𝑛𝜇; 𝑛<𝑆
ii. If n ≥ S, (number of customers in the system is more than or equal to the number of servers) then all servers will be busy and the maximum number of customers in the queue will be (n – S).
The combined service rate will be: 𝜇𝑛=𝑆𝜇; 𝑛 ≥ 𝑆
Thus to derive the result for this model, we have
𝜆𝑛= 𝜆 𝑓𝑜𝑟 𝑎𝑙𝑙 𝑛 ≥0 and 𝜇𝑛= �𝑛𝜇 𝜇; 𝑛<𝑆 𝑛=𝑆𝜇; 𝑛 ≥ 𝑆
The probability Pn of n customers in the queueing system is given by
𝑃𝑛=� 𝜌𝑛
𝑛!𝑃0; 𝑛 ≤ 𝑠 𝜌𝑛
𝑠! 𝑠𝑛−𝑠𝑃0; 𝑛>𝑠
and ρ= λ Sμ
𝑃0= ��𝑛!1�𝜆𝜇� 𝑛
+𝑠!1�𝜆𝜇�𝑠�𝑠𝜇 −𝑠𝜇 1�
𝑠−1
𝑛=0
�
−1
3. PERFORMANCE MEASURES
Results Mathematical Formulae
Utilization / Efficiency
ρ= λ
Sμ
Average number of customers in the queue (Lq)
Lq= �(s−11)!�λμ�
s λμ
(sμ − λ)2�× P0 Average number of customers in the system (Ls)
Ls= Lq+𝜆𝜇 Average waiting time in the queue (Wq)
Wq= Lλq Average time in the system (Ws)
𝑊𝑠 =𝑊𝑞+ 1μ
Expected Total Cost single (TCS) and multi queues (TCM) 𝐸 (𝑇𝐶𝑆) =
𝑆𝐶𝑆 + 𝐿𝑆𝐶𝑊
𝐸 (𝑇𝐶𝑀) =𝑆(𝐶𝑆 + 𝐿𝑆𝐶𝑊)
3.1 Expected total cost for multi-servers queue model
In this section, we analysis expected total cost service to customers with different service level is the function of two conflicting costs:
1. Cost of offering the service to customers
2. Cost of delay in offering the service to customers
Economic analysis of these costs helps the management to make a trade-off between the increased costs of providing better service and the decreased waiting time costs of customers derived from providing that service.
Expected service cost E(SC) = s Cs.
where s is number of service units (cash counters) and Cs is service cost of each server Expected waiting cost in the system E (WC) = Ls Cw.
The Expected total cost in the case single queue with multi servers model E(TC) = E(SC) + E(WC), E(TCS) = sCs + Ls Cw and multi queue with multi servers model E(TCM) = s(Cs + Ls Cw).
4. NUMERICAL ILLUSTRATION
We taking the 𝜆 =350, µ =205 & S = 2, 3, 4, 5 & 6 and obtained utilization, steady-state probability, average number of customers in the queue (Lq), average number of customers in the system (Ls), average waiting time in the queue (Wq) and average time in the system (Ws) according to single and multi queues with different service unit (Cash counter). In this we will use multi-server queueing model to find expected total cost and also assuming that service
cost is Rs.400 and waiting cost is Rs. 550 in each case.
Various performance measures have been obtained and analyzed by varying different parameters. The results have been analyzed from table 1 to 4.
Case-1: Single queue with five servers
Table-1
Performance Measures Single Queue system with No. of Service Units
2 3 4 5 6
Utilization (ρ) 0.8537 0.5691 0.4268 0.3415 0.2846 Values of Steady-State Prob. ( P0) 0.2399 0.2002 0.187 0.1828 0.1817
Lq 13.9375 0.5089 0.086 0.0174 .0035
Ls 15.6448 2.2162 1.7933 1.7247 1.7108
Ws 0.0398 0.0015 2.46E-04 4.97E-05 9.927E-006
Wq 0.0447 0.0063 0.0051 0.0049 0.0049
Case-I1: Two queues with five or more servers
Table-2 Performance Measures
Multi Queue (Two Lines) system with No. of Service Units
2 3 4 5 6
Utilization 0.4268 0.2846 0.2134 0.1707 0.1423
Values of Steady-State Prob. ( P0) 0.4507 0.4307 0.4266 0.426 0.4259
Lq 0.2133 0.0248 0.0033 4.00E-04 4.4268E-007
Ls 1.067 0.8785 0.8569 0.8541 0.8537
Wq 0.0012 1.42E-04 1.86E-05 2.28E-06 2.5296E-06
Ws 0.0061 0.005 0.0049 0.0049 0.0049
Case-III: Three queues with five or more servers
Table-3
Performance Measures Multi Queue system (Three Lines) with No. of Service Units
2 3 4 5 6
Utilization 0.2846 0.1897 0.1423 0.1138 0.0949
Values of Steady-State Prob. ( P0) 0.4507 0.5676 0.5662 0.566 0.566
Lq 0.0913 0.005 4.79E-04 4.08E-05 3.09E-06
Ls 0.9449 0.5741 0.5696 0.5691 0.5691
Wq 7.82E-04 4.32E-05 4.10E-06 3.50E-07 2.65E-08
Jitendra Kumar*, Vikas Shinde and Santosh Bharadwaj /
Sale Checkout Operation in Big Bazaar using Queuing Model / IJMA- 8(7), July-2017.
© 2017, IJMA. All Rights Reserved 285 Case-IV: Four queues with five or more servers
Table-4
Performance Measures Multi Queue system (Four Lines)with No. of Service Units
2 3 4 5 6
Utilization 0.2134 0.1423 0.1067 0.0854 0.0711
Values of Steady-State Prob. ( P0) 0.6587 0.6532 0.6526 0.6526 0.6526
Lq 0.0207 0.0016 1.21E-04 7.86E-06 4.52E-07
Ls 0.4475 0.4285 0.4269 0.4268 0.4268
Wq 2.37E-04 1.87E-05 1.38E-06 8.98E-08 5.16E-09
Ws 0.0051 0.0049 0.0049 0.0049 0.0049
Table-5: Expected total cost (Rs.) for multi-servers with different queues
Figure-4: Expected total cost (Rs.) for multi-servers with different queues
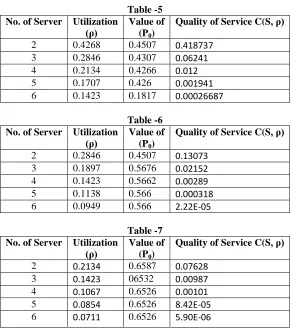
5. QUALITY OF SERVICE (QoS)
In order to provide the quality of service, we have the number of service counters with size of customers in queue for the service. Erlang’s C formula is used to analyzed quality of service to customers at the rate of λ = 350, each service counter rate of µ = 205. The QoS corresponding to multiple cash counter is mentioned in table 5, 6 &7.
𝐶(𝑆,𝜌) = 𝑆(!(𝑆𝜌1−𝜌)𝑆)×𝑃0 , S= 2, 3, 4,………
2 2.5 3 3.5 4 4.5 5 5.5 6
0 0.2 0.4 0.6 0.8 1 1.2 1.4 1.6 1.8
2x 10
4
Number of Server
V
ol
ues
of
Q
ues
w
it
h S
er
v
er
s
Expected total cost (Rs.) for multi-servers with different queues
Single Sever with Single Queue
Multi-Servers with Two Queues Multi-Server with Three Queues Multi-Server with Four Queues
Number of Severs
Number of Queues S= 2 S= 3 S= 4 S= 5 S= 6 Single Queue 18004 4846 5538 6730 8043
Multi- Queues
Two 1973 2649 3485 4348 5217
Three 900 2147 2853 4348 4278
Table -5 No. of Server Utilization
(ρ)
Value of (P0)
Quality of Service C(S, ρ)
2 0.4268 0.4507 0.418737
3 0.2846 0.4307 0.06241
4 0.2134 0.4266 0.012
5 0.1707 0.426 0.001941
6 0.1423 0.1817 0.00026687
Table -6 No. of Server Utilization
(ρ)
Value of (P0)
Quality of Service C(S, ρ)
2 0.2846 0.4507 0.13073
3 0.1897 0.5676 0.02152
4 0.1423 0.5662 0.00289
5 0.1138 0.566 0.000318
6 0.0949 0.566 2.22E-05
Table -7 No. of Server Utilization
(ρ)
Value of (P0)
Quality of Service C(S, ρ)
2 0.2134 0.6587 0.07628
3 0.1423 06532 0.00987
4 0.1067 0.6526 0.00101
5 0.0854 0.6526 8.42E-05
6 0.0711 0.6526 5.90E-06
5.1 Optimal Service Rate (OSR)
Optimal service rate is associated with QoS. We analyzed the better optimal service rate in table 8 & 9. Consequently, we get best service outcome when six servers are used with four queues.
𝐶(𝑆,𝜌) = � 𝜌𝑛×𝑃0× 100 ∞
𝑛=𝑠
Table – 8: (Corresponding cases 1, II, III & VI)
No. of Servers S=2 S=3 S=4 S=5 S=6
Case I 448.83% 82.90% 26.35% 7.81% 2.04% Case II 41.87% 6.24% 1.20% 0.19% 0.03%
Case III 13.07% 2.15% 0.29% 0.03% 0.00%
Case IV 6.69% 0.99% 0.10% 0.01% 0.00%
For customers to arrive at the rate of λ = 350, each service counter rate of µ = 205, if we need customers need to line near 1% how many service counters should be set up.
Table – 9: (The Probability of Queueing System)
Number of Service Unit (cash counter) 2 3 4 5 6
One Line 448.83% 82.90% 26.35% 7.81% 2.04%
Two Lines 41.87% 6.24% 1.20% 0.19% 0.026687%
Three Lines 13.07% 2.15% 0.28% 0.031% 0.00222013%
Four Line 6.68% 0.98% 0.10% 0.008% 0.00059003%
Jitendra Kumar*, Vikas Shinde and Santosh Bharadwaj /
Sale Checkout Operation in Big Bazaar using Queuing Model / IJMA- 8(7), July-2017.
© 2017, IJMA. All Rights Reserved 287 Figure-4: Comparative Probabilities vs Different Queue with Multiple Servers
6. CONCLUSION
In the present investigation, multiple checkout counters were used in order to improve the quality of service and optimal service rate. We also suggest the information of variety of items should be well displayed and accessible without much wastage of their time for searching and retrieval. We validate our model by obtaining the various performances measures, viz queue length and waiting time along with QoS. Our study can be helpful to reducing the queue size and system designer for achieving the best QoS.
REFERENCES
1. E. Berhan, Bank Service Performance Improvements using Multi-Server Queue System, IOSR Journal of Business and Management (IOSR-JBM), 17(6) (2015) 65-69.
2. N. Azmat, Queueing Theory and Its Application: Analysis of the Sales Checkout Operation In Ica Supermarket, Dalarna University of Dalarna, Department of Economics & Society, (2007) 1-31.
3. S. Toshiba, S. K. Singh and A. K. Kashyap, Application of Queueing theory for the Improvement of Bank Service, International Journal of Advanced Computational Engineering and Networking, 1(4) (2013) 15-18.
4. M. S. Chowdhury, Solving of Waiting Liens Models in the Bank Using Queueing Model the Practice Case: Islami Bank Bangladesh Limited, Chawkbazar, Chittagong, IOSR Journal of Business and Management, (2013) 22-29. 5. F. D. Famule, Analysis of M/G/1 Queueing Model with Applications to Waiting Time of Customers in Bank,
Global Journal of Computer Science and Technology, 10(13) (2010) 28-34.
6. Y. Wang, C. Qian and J. D. Cao, Optimized M/M/C Model and Simulation Bank Queueing System, IEEE, International conference software Engineering and Service Sciences, (2010) 474-477.
7. P. Bhavin and P. Bhathawala, Case study for Bank ATM Queueing Model, International Journal of Engineering Research and Applications (IJERA), 2(5) (2012) 1278-1284.
8. D. F. Holman, M. L. Chaudhry and B. R. K. Kashyap, On the Service system MX /G/∞, European Journal Operation Research, 13 (1982) 142-145.
9. R. Zhang, Analysis of the service sector queueing, Journal of Qiqihar University, 6 (2002) 41-43. 10. X. X. Zhao, Queueing theory with the bank management innovation, Modern Finance, 3 (2007) 9-10.
11. J. Li, Queueing theory and the witness service used in supermarkets of the optimal design, Chinese Information technology management, 11(3) (2008) 75-78.
12. J. Kumar, V. Shinde, B.B. Singh and A. Kumar, Analysis of performance measure of multi- server based on queue length and wailting time, Journal of Ganita Sandesh, Rajasthan (India), 24(2) (2010) 127-134.
Source of support: Nil, Conflict of interest: None Declared.