Published by Science and Education Publishing DOI:10.12691/aees-8-6-9
Smart Tools for Wetland Management: UAV Data and
Artificial Intelligence Technique for Change Detection
of Phragmites Australis in the Bear River
Migratory Bird Refuge
Bushra Zaman1,2,*, Mac McKee1,2
1
Utah Water Research Laboratory, 1600 Canyon Rd, Logan, Utah 84321, USA 2
Department of Civil and Environmental Engineering, Utah State University, 0160 Old Main Hill, Logan, Utah 84322-0160 USA *Corresponding author: [email protected], [email protected]
Received August 05, 2020; Revised September 06, 2020; Accepted September 15, 2020
Abstract
Unmanned Aerial Vehicle (UAV) data and artificial intelligence (AI) techniques have often been separately used for wetland management applications. Existence of native or invasive weed species which are a threat to the biodiversity of the wetland ecosystem is a common problem. High resolution multispectral image data from UAV and AI analysis together may prove to be a very robust combination for solving some of the wetland management problems. AggieAir, a UAV platform developed at Utah State University (USU), was used to acquire very high-resolution, multispectral aerial images of the study area in the summers of 2010 and 2011. The AggieAir data and an AI model have been used to classify and detect the weed P. australis in the Bear River Migratory Bird Refuge (BRMBR) wetland ecology. The images were classified based on the reflectance values in red, green and NIR bands using the multiclass relevance vector machine (MCRVM). The total P. australis cover was calculated and results indicated a decrease of 6.6% in total P. australis cover between June and September 2010 but an increase of 43.85% between June 2010 to July 2011. This study provided useful information about the extent and spread ofP. australis P. australis which is a priority as regards to invasive plant treatment and control in the BRMBR. The results are easy to interpret and can contribute to management advising. Given the high spatial and temporal resolution of the UAV and excellent performance of the MCRVM model, we propose their further use for wetland management applications.
Keywords
: wetland management, water management, relevance vector machine, unmanned aerial vehicles,classification, P. australis P. australis, modeling, artificial intelligence
Cite This Article:
Bushra Zaman, and Mac McKee, “Smart Tools for Wetland Management: UAV Data and Artificial Intelligence Technique for Change Detection of Phragmites Australis in the Bear River Migratory Bird Refuge.” Applied Ecology and Environmental Sciences, vol. 8, no. 6 (2020): 387-395. doi: 10.12691/aees-8-6-9.1. Introduction
Recent years have seen an increased use unmanned aerial vehicles (UAVs) for wetland applications. Modern artificial intelligence algorithms like decision trees (DT), artificial neural networks (ANN) [1], and support vector machines (SVM) [2] have been used in the past for wetland studies. This research for the first time combines both these state-of-the-art data and tool to understand the invasive vegetation growth dynamics and detect changes in support of wetlands restoration efforts. Satellite, aircraft and unmanned aerial platforms have been successfully used for wetland research [3]. Nonetheless, these systems have their own constraints which may include low spatial and temporal resolution, high cost and fixed timing of data acquisition. Low altitude remote sensing platforms, such as UAVs address most of these issues and can be a
better results than traditional image processing techniques
[9] to map a wetland. Genetic assessment and remote sensing were used for studying the rate and mode of expansion for 20 P. australis patches in the Bear River Migratory Bird Refuge (BRMBR) near Great Salt Lake, UT and it was found that most patch expansions occurred through clonal spread and also found few instances of seedling recruitment [10]. The BRMBR imagery was classified at a single point of time in 2010 and the spread of P. australis in the BRMBR was evaluated [11], The current study investigates the seasonal and annual growth rate and change detection of P. australis in BRMBR over a period of time between 2010 and 2011 using a state-of-the-art classification technique and data from AggieAir, an unmanned aerial vehicle platform developed at Utah State University (USU).
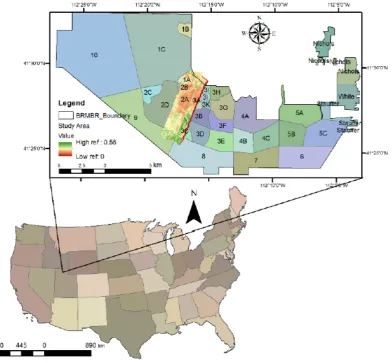
2. The Study Site
The Bear River Migratory Bird Refuge (BRMBR) is a very large wetland located on the northeast shore of the Great Salt Lake, Utah. The geo-location is 41°28'45.43"N 112°16'00.81"W and elevation 1,284 m. For UAV data acquisition, the BRMBR was divided into four sections based on the area covered by the AggieAir UAV in a single flight, which is limited by battery capacity. Out of these four sections, Section 2 was most easily accessible on the ground, and, hence, most ground sampling points
were available for this section. Figure 1 shows section 2 of the BRMBR, about 11 km2.
3. Methods
3.1. Instrument
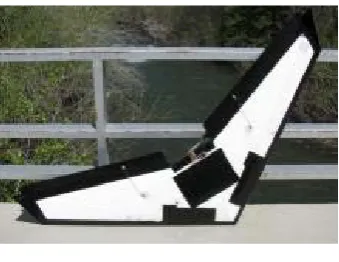
The small unmanned aerial vehicle (sUAV) used in this study was a first in the series of sUAVs which was created jointly by center for self-organizing intelligent systems and Utah Water Research Laboratory (UWRL) at Utah State University. The sUAV platforms, the payloads they fly, and the imagery and derivative products generated are collectively known as “AggieAir”. The sUAV used in this study (Figure 2) was the first in a series of small autonomous platforms designed, built, and deployed by the UWRL for purposes of on-demand remote sensing for scientific research. It had a wingspan of 6 feet, takeoff weight of 8 pounds, a flight range of about 25 miles, and flight duration of about 45 minutes. At an elevation of 1,000 meters, it could acquire imagery over approximately 3 square miles in a flight. For the work reported here, it carried two Canon S-95 consumer-grade cameras which captured images in optical bands (RGB) and near-infrared (NIR) band. Spatial resolution of the resulting imagery was approximately 25 cm. More detailed information is available at http://AggieAir.usu.edu.
Figure 2. AggieAir
3.1.1. Sensors on AggieAir
The visual and NIR sensors used for this study were Cannon S-95 cameras, which have a radiometric resolution of 8 bits. These cameras records images at a 4 second interval and the image size is 3264 × 2248 pixels. The focal length is 6mm with a field of view of 50 × 39 degrees.
The NIR sensor uses Wratten 87 and Wratten 87C filters. Wratten 87 filter blocks any wavelength below 740 nm only allows NIR wavelengths to pass through and Wratten 87C NIR filter blocks all wavelengths below 790 nm. Table 1 shows the wavelength range for various channels of the sensor.
Table 1. Wavelength Range for Various Channels of The Sensor.
Band Sensor
R 570-640 nm
G 490-580 nm
B 420-500 nm
NIR nm
3.2. Multiclass Relevance Vector Machine
The Bayesian relevance vector machine was invented in 2003 [12] and this machine could handle dual classification. A leeway to the model was later provided
[13] by extending it to produce multiple outputs and the model was used for tracking human body motion. The multiple output approach was used for the MCRVM model formulated in this study and which is used for landcover classification and model code was extended to produce geo-rectified and projected imagery.
3.2.1. General Background of RVM
The Bayesian automatic relevance determination (ARD) concept results in “Sparse Bayesian Learning” wherein a few relevant basis functions are automatically selected from a large initial set of data to make predictions. The models are accurate, sparse and linear in their parameter estimates.
RVM is a special case of this concept. The data set is in the form of input-output pairs, {xn, yn n}N=1. The model is designed to detect the input-output relationship and precisely predict output values for new input values [12].
This MCRVM model is defined as some function y(x) whose parameters are found as:
M
i 1
y( ; ) wi ( )φi Tφ( )
=
=
∑
=x w x w x (1)
where the output y(x;w) is a linearly weighted sum of M, nonlinear and fixed basis functions φ(x) = (φ1(x), φ2(x),…
φM(x))T and weights, w = (w1,w2,…,wM)T, which are
adjustable parameters. RVMs are a special case of Equation (1). The sparse Bayesian learning procedure is highly discerning and it extracts predictors that are very sparse, with few non-zero w parameters.
As per Bayes’s rule, the relation between posterior probability of w, likelihood and prior is:
2 2
2
p( ,σ )p( )
p( ,σ )
p( ,σ )
α α
α
= t w w
w t
t
, (2)
where σ2is the error variance, p(t|w,σ2
) is the likelihood of target t, p(w|α) is the prior, and p(t|α,σ2) is the evidence. For classification, we use the logistic sigmoid link function σ(y) = 1/(1+e-y) to y(x), and adopt the Bernoulli distribution for p(t|w,σ2). Hence the likelihood can be written as
N
tn 1-tn
n n 1
p( ) σ{ ( ; )} [1-σ{ ( ; )}]y n y
= =
∏
t w x w x w (3)
Where tn is the target or output class ∈ {1, 2, 3, 4, 5}
for present study. A multinomial form of (3) was given to this [14] to express a true multiclass likelihood as:
N K
tnk
k 1 2 k
n 1 k 1
p σ{y ;y ,y ,...y }
= = =
∏∏
(t w) (4)
where the predictor yk of each class is associated with a
multinomial logit function given by
yk k 1 2 k y y
1 k e (y ;y ,y ,...y )
e +...+e
σ = (5)
The prior over w is a zero mean Gaussian given by,
2 N
n n n n=1
p( ) exp( )
2 2
w
α α α
π
=
∏
w (6)
Where, α = (α0,α1,…,αN)T are N independent hyperparameters
each of which individually control the strength of the prior over its associated weight, ultimately resulting in a sparse model [12]. The closed-form expression for the weight posterior p(w|t,α,σ2) and evidence of hyperparameters
p(t|α,σ2) are computationally complex. Hence, a Laplacian approximation is used.
Maximizing log(p(w|t,α,σ2)) or minimizing the following cost function [15] will give us the maximum a posteriori estimate (MAP) of w, sincep(w t,α)∝p(t w)p(wα) , with a fixed given α,
2
2 N
n n
n n n n
n 1
log(p( ,σ ))
( - log (1- ) log(1- ))
2
α
w
t y t y
α =
=
∑
+w t ,
(7)
The Hessian of log(p(w|t,α,σ2)) is given by 2
(log(p(= ∇ α)))= TB +A
H w t, Φ Φ (8)
where matrix Ф is the N×(N+1) ‘design’ matrix with φ
form: k(xn,xm-1) = exp(-r-2||xn-xm-1||2), where r is the kernel
width. A = diag{α1,…,αn}, and B = diag(β1,β2, . . ., βN)
is the diagonal matrix with βn = σ{y(xn)}[1- σ{y(xn)}].
The hyperparameters α are iteratively updated by the covariance Σ and mean μMP of the Gaussian
approximation using the following equation:
new i ii i 2
i 1-α
α
µ
∑
= (9)
Where, μi is the ith posterior mean weight from (11), Σii is
the ith diagonal element of the posterior weight covariance (10), and 1-αiΣii is a measure of the degree to which the
related parameter wi is determined by the data [16].
During the re-estimation process the αi tend to infinity,
making p(wi|t,α,σ2) highly peaked at zero which makes the
associated weights zero. The associated basis functions with these zero weights become zero and this results in a sparse model.
The covariance Σ is given by the inverse of the Hessian (8):
( )
1(
)
1S= H − = ФTBФ A+ − (10)
and the mean is given by
T
MP ˆt.
μ =ΣΦ B (11)
The new predicted classes are given by:
-ˆ= μ + 1
-MP
t Φ B (t y) (12)
3.3. P. australis
P. australis (Figure 3a)is a common weed grass mostly found in the temperate and tropical regions of the world. The grass is perennial and it grows to a height of 5 to 20 feet. The leaves broad and sheath-like and around 0.4-1.6 inches wide at the base. The growing season is from May to October. Senescence begins to occur in approximately mid-August (Figure 3b).
P. australis grows very quickly and can cause lower water levels as it transpires much faster than most native vegetation. Its growth is affected by hydrologic
flows, salinity, nutrients, and water storage (flooding depth).
Figure 3(a).P. australis during peak growing season in BRMBR
Figure 3 (b). P. australis during senescence in BRMBR
3.4. Data collection
An AggieAir aerial survey of a section of BRMBR was conducted on three cloud free dates (June 17, 2010, September 21, 2010 and July 21, 2011). The UAV acquired geo-referenced images in the visible and NIR bands. The spatial and radiometric resolution of the images were 25 cm and 8 bits respectively [10,17].
The ground sampling was done as described in [10] is shown in Figure 4.
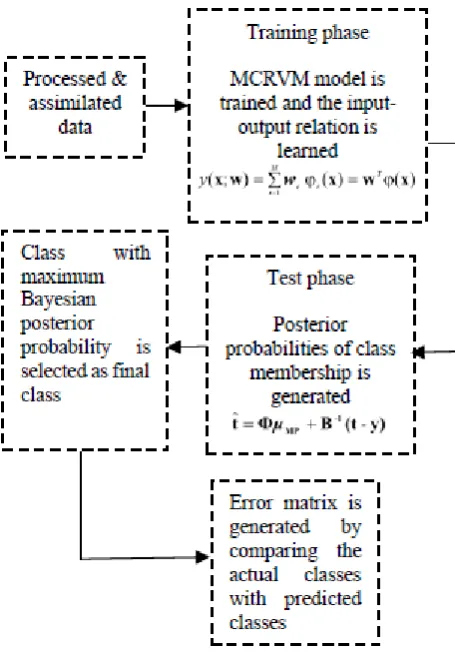
3.5. MCRVM Classification
MCRVM supervised classification model [11]; building on preceding algorithms developed by [18] was created for landcover classification and classification of
P. australis specifically for this study. The MCRVM model was trained with a total of 479 samples of 5 classes which were P. australis (372), mixed vegetation which is all vegetation except P.australis (17), salt (30), muddy water (30) and water (30). The test set consisted of 100 points: P. australis (40), mixed vegetation (20), salt (15), muddy water (15) and water (10)). P. australis and mixed vegetation samples were obtained from manual ground sampling and salt, water and muddy water points were visually picked from the high-resolution imagery. More details regarding MCRVM classification, accuracy assessment & statistical analyses can be found in [10]. Figure 5 shows the MCRVM model workflow:
Figure 5. MCRVM Model for Ground Cover Classification Using AggieAir Imagery
4. Seasonal and Annual Change Detection
A seasonal change analysis of P. australis cover between 17 June 2010 and 21 September 2010 was carried out to check the increase or decrease of spread. The annual change detection was done between 17 June 2010 and 21 July 2011 to check the location and spread rate of P. australis over a year. The following methodology outlined in Figure 6 was adopted.
Figure 6. Change detection workflow
5. Results
The MCRVM model was capable of detecting the location of the invasive species P. australis in addition to other classes specified in the model. Figure 7(a), 7(b) and 7(c) show classified images of 17 June 2010, 21 September 2010 and 21 July 2011 respectively.
Following results were obtained from the MCRVM classification model:
17 June 2010 - The overall classification accuracy obtained for 17 June 2010 image classification result was 92% and Cohen’s kappa coefficient was 0.89. This kappa value lies in the 0.81-0.99 range of “almost perfect agreement”.
21 September 2010 - The overall classification accuracy was 95% and Cohen’s kappa coefficient was 0.93. This kappa value reflected the strength of the inter-rater agreement and showed that the observed agreement was not accidental.
Figure 7. Classified image using MCRVM model : (a). 17 June 2010; (b). 21 September 2010; (c). 21 July 2011
In all three cases, it was observed that P. australis has been misclassified as either muddy water or mixed vegetation, one instance of each muddy water and mixed vegetation were classified as P. australis. Water was mostly confused as salt/concrete except for 21 September 2010 image where one instance of water was misclassified as muddy water. The MCRVM model was able to produce very good classification results. On the basis of these
classified images, seasonal and annual change detection was carried out (For further reading and tables, refer to [9]).
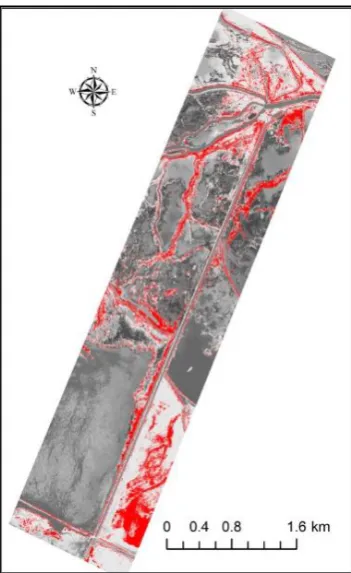
5.1 Seasonal Change Detection
The areas of the refuge shown in red in Figure 8(a) and 8(b) show the extent of P. australis on 17 June 2010 and 21 September 2010 respectively.
Figure 8(a). MCRVM classified image of 17 June 2010 showing
P. australis in red color
Figure 8(b). MCRVM classified image of 21 September 2010 showing
Table 2. Seasonal Change Detection Result
Month/Year Area Covered in Sq. km
% increase/decrease in growth
June 2010 1.57 ___
September 2010 1.46 -6.62%
Change detection results shown in Table 2 indicated an overall decrease of 6.62% in P. australis cover. The area occupied by P. australis in June 2010 was 1.57 sq. km., and that in September 2010 was 1.46 sq. km which indicated a decrease of 0.098 sq. km of P. australis spread. Inspite of the decrease in overall area occupied by P. australis, analysis indicated new growth around the swampy region in the northeastern side of the study area shown in red in Figure 9. The slight decrease in area may be attributed to senescence of P. australis which generally starts in mid-August and/or due to ongoing weed control efforts by the management during that season.
Figure 9. Increase in growth of P. australis from June to September
5.2. Annual Change Detection
On 21 July 2011, the total area occupied by P. australis
was 2.26 sq. km which is around 0.7 sq. km or 43.85% increase in P. australis cover in almost a year (Table 3). The areas shown in red in Figure 10(a) and 10(b) show
P. australis spread in the study area in June 2010 and July 2011 respectively.
Table 3. Annual Change Detection Results
Month/Year Area Covered in Square kilometers
% increase in growth
June 2010 1.57 ___
July 2011 2.26 43.85%
Figure 10(a). BRMBR section 2 image of 17 June 2010 showing P. australis in red
Figure 10(b). BRMBR section 2 image of 21 July 2011 showing
Figure 11(a) and (b) show the areas where new growth occurred during a one-year period from 17 June 2010 to 21 July 2011 in yellow. Figure 11(b) shows the ground sampling location as black dots which are the test locations for P. australis which were not used for training the MCRVM model. It is observed that these test locations have been correctly classified as P. australis .
Figure 11(a). Annual Change (increase) in P. australis growth shown in yellow with ground sampling points shown in black
Figure 11 (b). Increase in P. australis Growth shown in yellow
6. Discussion
Mapping an area at a desired spatial and temporal scale can boost quality research and can yield data that may not be possible to obtain through other contemporary methods. The use of AggieAir for data acquisition for the present study yielded high quality images. The spatial resolution of the AggieAir images in the Visible and NIR bands varies from 5 cm to 25 cm, depending on flight elevation with fast turnaround of images (minutes to hours). Data generation with AggieAir is fast, at a desired spatial and temporal resolution, and is cheaper as compared to the conventional remote sensing platforms (satellite and manned aircraft) [19]. The cost of an inertial measurement unit (IMU) which accounts for a major portion of the total cost of an sUAV lies somewhere between $500 USD to $3000 USD for industrial grade and costs less than $500 USD for hobbyist grade [20]. Hence sUAV can be a viable option for wetland monitoring. The AggieAir UAV system was an easy to use and reliable platform and provided good quality data for research.
Data dependent modeling in various guises already has revolutionized the way we understand and interpret data. These models have the capability of extracting useful information from the data by working out an underlying relationship of the data with the targets and thereby learning to predict the outcome. The MCRVM model was able to establish a link between readily available spectral reflectance information and land cover type using the relevance vectors. The data was converted into useful information with ease and enhanced accuracy. The approach presented uses a concrete paradigm that is mathematically sound with manageable computational complexity. These sparse learning machines are theoretically elegant and well regularized, in general require few parameters and are relatively easy to calibrate. The classification model formulated in this study takes AggieAir UAV data as an input and produces highly accurate quantitative descriptions of the predefined land cover types in the imagery.
The MCRVM model test results and statistical analysis lend an extensive assessment of the model that allows us to conclude that a remotely sensed UAV data along with the learning machine model is a useful tool for small to large scale wetland monitoring and management programs. This case study establishes the point that the combined use of a learning machine model and high-resolution images can yield highly accurate quantitative evaluations of the chosen landcover types.
7. Conclusion
The aerial imagery obtained from a sUAV AggieAir was used for determining a specific invasive reed,
perspective, this reed is damaging because of its extensive use of water which would ultimately be harmful for the migratory birds. The annual rate of growth of P. australis
indicate that the wetland management needs to take swift and serious measures to control its growth and to eliminate the existing cover.
References
[1] Szantoi, Z., Escobedo, F. J., Abd-Elrahman, A., Pearlstine, L., Dewitt, B., and Smith, S., "Classifying spatially heterogeneous wetland communities using machine learning algorithms and spectral and textural features," Environmental Monitoring and Assessment, 187 (5). 262. 2015.
[2] Pierce, J., Diaz-Barrios, M., Pinzon, J., Ustin, S. L., Shih, P., Tournois, S., Zarco-Tejada, P. J., Vanderbilt, V. C., and Perry, G. L., “Using support vector machines to automatically extract open water signatures from POLDER multi-angle data over boreal regions”, in IEEE International Geoscience and Remote Sensing Symposium. 2349-2350. 2002.
[3] Goetz, S. J., "Remote sensing of riparian buffers: past progress and future prospects," JAWRA Journal of the American Water Resources Association, 42 (1).133-43. 2006.
[4] Zhang, C., and Kovacs, J. M., "The application of small unmanned aerial systems for precision agriculture: a review," Precision agriculture, 13 (6). 693-712. 2012.
[5] Laliberte, A. S., and Rango, A., "Texture and scale in object-based analysis of subdecimeter resolution unmanned aerial vehicle (UAV) imagery," in IEEE Transactions on Geoscience and Remote Sensing, 47 (3). 761-70. 2009.
[6] Chabot, D., and Bird, D. M., "Small unmanned aircraft: precise and convenient new tools for surveying wetlands," Journal of Unmanned Vehicle Systems, 1 (01).15-24. 2013.
[7] Ozesmi, S. L., and Bauer, M. E., "Satellite remote sensing of wetlands," Wetlands ecology and management, 10 (5). 381-402. 2002.
[8] MacAlister, C., and Mahaxay, M., "Mapping wetlands in the Lower Mekong Basin for wetland resource and conservation management using Landsat ETM images and field survey data,"
Journal of Environmental Management, 90 (7). 2130-7. 2009.
[9] Ozesmi, S. L., "Satellite remote sensing of wetlands and a comparison of classification techniques." 2001.
[10] Kettenring, K. M., Mock, K. E., Zaman, B., and McKee, M., "Life on the edge: reproductive mode and rate of invasive Phragmites australis patch expansion," Biological Invasions, 18 (9). 2475-95. 2016.
[11] Zaman, B., Jensen, A. M., and McKee, M. 2011, “Use of high-resolution multispectral imagery acquired with an autonomous unmanned aerial vehicle to quantify the spread of an invasive wetlands species”, in IEEE International Geoscience and Remote Sensing Symposium. 803-806. 2011.
[12] Tipping, M. E., "Sparse Bayesian learning and the relevance vector machine," Journal of machine learning research, 1. 211-44. 2001.
[13] Thayananthan, A., Navaratnam, R., Stenger, B., Torr, P. H., and Cipolla, R., “Multivariate relevance vector machines for tracking”, in European conference on computer vision, 124-128, 7-13 May 2006.
[14] Zhang, H., and Malik, J., "Selecting shape features using multi-class relevance vector machine," Technical Rep. No. UCB/EECS-2005, 6. 2005.
[15] Camps-Valls, G., Marsheva, T. V. B., and Zhou, D., "Semi-supervised graph-based hyperspectral image classification,"
IEEE Transactions on Geoscience and Remote Sensing, 45 (10). 3044-54. 2007.
[16] Khalil, A., Almasri, M. N., McKee, M., and Kaluarachchi, J. J., "Applicability of statistical learning algorithms in groundwater quality modeling," Water Resources Research, 41 (5). 2005.
[17] Zaman, B., Jensen, A., Clemens, S. R., and McKee, M., "Retrieval of spectral reflectance of high resolution multispectral imagery acquired with an autonomous unmanned aerial vehicle,"
Photogrammetric Engineering & Remote Sensing, 80 (12). 1139-50. 2014.
[18] Thayananthan, A.; Navaratnam, R.; Stenger, B.; Torr, P. H.; Cipolla, R., "Pose estimation and tracking using multivariate regression," Pattern Recognition Letters, 29 (9). 1302-10. 2008.
[19] Jensen, A. M., Chen, Y., McKee, M., Hardy, T., and Barfuss, S. L., “AggieAir—a low-cost autonomous multispectral remote sensing platform: new developments and applications”, in IEEE International Geoscience and Remote Sensing Symposium. IV-995-IV-998. 2009.
[20] Chao, H., Cao, Y., and Chen, Y., "Autopilots for small unmanned aerial vehicles: a survey," International Journal of Control, Automation and Systems, 8 (1). 36-44. 2010.