Research Article
a
October
2018
Computer Science and Software Engineering
ISSN: 2277-128X (Volume-8, Issue-10)
Comparative Analysis of Different Supervised Machine
Learning Algorithms for Sentiment Analysis
Gundeep Singh1, Sukhmanjit Kaur2, Prabhsimran Singh3
1, 3
Department of Computer Engineering & Technology, Guru Nanak Dev University, Amritsar, Punjab, India
2
Department of Computer Applications, Khalsa College of Management & Technology, Amritsar, Punjab, India
1
[email protected], [email protected], [email protected]
Abstract: With advancement in technology, sentiment analysis has seen an exponential growth in last few years. Sentiment analysis is natural language processing technique which deals with emotion detection from given text. A major reason for popularity of this field is the fact it is applied to large number of application domains. Due to this, various techniques have been proposed to perform sentiment analysis using supervised machine learning algorithms. But a major question arises, that which algorithm is the best. This paper tries to provide solution of this question, by performing a comparative analysis of various algorithms taking different datasets under consideration. Our results show that Naïve Bayes out performs all other algorithms.
Keywords: Sentiment Analysis, Text Mining, Supervised machine learning, classification, WEKA.
I. INTRODUCTION
Sentiment analysis is a study which uses natural language processing (NLP), statistics and machine learning techniques to extract or identify the opinion (sentiment) content of a given text [1]. Past decade has witness an exponential growth in the volume of digital data, most of which is generally generated from social networking websites (SNW). Researchers working in field of sentiment analysis are taking keen interest in this for mining the opinions expressed by people on twitter through tweets, status on Facebook etc.This digital data can be used for a wide range of analysis and interpretation. This mammoth amount of data available on these SNW cannot be directly processed further in order to derive useful results and hence and hence sophisticated techniques like machine learning algorithms are used to accomplish this complicated task. This further give rise to another problem that which technique or algorithm is to be used for performing this analysis task. As there are multiple machine learning algorithms classified into supervised and unsupervised learning techniques. Supervised learning is the one in which the instances are labeled, while in unsupervised learning technique the instances are not labeled.
This paper tries to find the solution of the above stated problem by finding which algorithm is best suited for performing sentiment analysis on given dataset. For this, we are taking into consideration some well-known supervised machine learning algorithms like Decision Tree (DT), K-Nearest Neighbors (KNN), Naïve Bayes (NB), Random Forest (RF) and Support vector machine (SVM), in order to perform comparative analysis to put into perspective a relative study of various approaches.
II. SUPERVISED MACHINE LEARNING ALGORITHMS
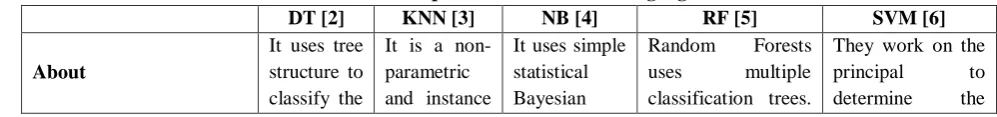
Supervised learning is the machine learning task of inferring a function from supervised training data. In this training data consist of training examples, with each example consisting of an input value and corresponding desired output value. It is named so because of the fact scientist/ researcher act as a supervisor to the algorithm in order to guide it, what results should it produces at the end of computation. This is similar to the scenario where a student learns from its teacher. In this section we discuss some well-known supervised machine learning algorithms like Decision Tree (DT) [2], K-Nearest Neighbors (KNN) [3], Naïve Bayes (NB) [4], Random Forest (RF) [5] and Support vector machine (SVM) [6]. Table 1 shows descriptive analysis of various supervised machine learning algorithms.
Table 1. Various Supervised machine learning algorithms
DT [2] KNN [3] NB [4] RF [5] SVM [6]
About
It uses tree structure to classify the
It is a non-parametric and instance
It uses simple statistical Bayesian
Random Forests
uses multiple
classification trees.
They work on the
principal to
ISSN(E): 2277-128X, ISSN(P): 2277-6451, pp. 61-65
data based
algorithm
used for
classification
Classifier for performing classification
Each tree gives a classification (Class-vote). The forest chooses the classification having the most votes
location of
decision boundaries (hyperplane) that
produce the
optimal separation of classes
Explanation Ability High Average Average Low Low
Accuracy Average Average High High High
Training Speed Low Average High Low Low
Classification Speed Average Average High Low Average
Missing Values Handling Average Average High High Average
Noise Handling Low Low High High Low
Dealing With Discrete/ Binary/ Continuous Attributes
All All Not
Continuous All Not Discrete
Need of Scaling No Yes No No No
III. EXPERIMENTATION AND RESULTS
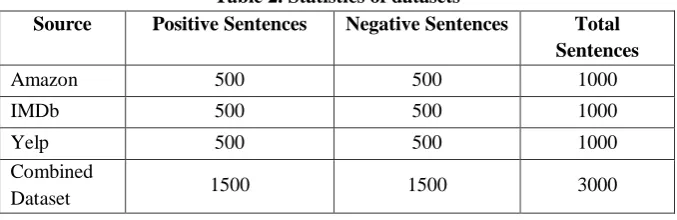
The entire experimentation has been performed using WEKA 3.8 [7], which contains a collection of machine learning algorithms for performing various data mining tasks. For efficient analysis, we had used a total three datasets i.e. Amazon [8] datasetcontaining product reviews, IMDb [9] dataset containing movies reviewand Yelp[10] dataset containing restaurant reviews. Each dataset consist of 1000 sentences and corresponding sentiment to each sentence. All the datasets are evenly distributed containing 500 positive and 500 negative sentences. In addition to above datasets we have further used a forth dataset which is contains all the three datasets in combined form. The statistics of datasets are shown in Table 2, while Table 3 shows example of each dataset.
Table 2. Statistics of datasets
Source Positive Sentences Negative Sentences Total Sentences
Amazon 500 500 1000
IMDb 500 500 1000
Yelp 500 500 1000
Combined
Dataset 1500 1500 3000
For all the datasets under consideration we will pass them through different classification models developed using different machine learning algorithms i.e. decision tree (DT), k-nearest neighbors (KNN), naive bayes (NB), random forest (RF) and support vector machine (SVM) as discussed earlier (See Section 2).
Table 3. Statistics of datasets
Source Positive Sentences Negative Sentences
Amazon
I bought this to use with my Kindle Fire and absolutely loved it!
Needless to say I wasted my money
IMDb
Saw the movie today and thought it was a good effort good messages for kids
The acting was bad the dialogs were extremely shallow and insincere
Yelp
Thats right the red velvet cake ohhh this stuff is so good
ISSN(E): 2277-128X, ISSN(P): 2277-6451, pp. 61-65
The results of amazon dataset are shown in Table 3. SVM gave the best results for amazon dataset, closely followed by NB and RF.
Table 3. Experimentation Results of Amazon dataset
DT KNN NB RF SVM Accuracy (%) 68.4 67.6 77.8 77.7 79.3
Kappa Statistics 0.368 0.352 0.556 0.554 0.586
Relative absolute error
(%) 71.23 69.60 51.53 71.75 41.4
Root relative square
error (%) 96.93 103.201 76.44 79.83 90.99 Matthews correlation
coefficient 0.372 0.359 0.559 0.555 0.586 F-Measure 0.682 0.673 0.777 0.777 0.793
Precision-Recall Curve
(PRC Area) 0.697 0.714 0.874 0.871 0.732 Area under the Curve 0.723 0.740 0.879 0.871 0.793
The results of IMDb dataset are shown in Table 4. NB gave the best results for IMDb dataset, while RF and SVM were second and third receptively in term of performance.
Table 4. Experimentation Results of IMDb dataset
DT KNN NB RF SVM Accuracy (%) 57.1 59 80 75.1 74.1
Kappa Statistics 0.142 0.18 0.6 0.502 0.482
Relative absolute error
(%) 88.6 82.95 51.75 82.61 51.8
Root relative square
error (%) 112.5 112.84 75.12 87.105 101.78 Matthews correlation
coefficient 0.142 0.188 0.600 0.504 0482 F-Measure 0.571 0.581 0.800 0.750 0.741
Precision-Recall Curve
(PRC Area) 0.566 0.596 0.873 0.807 0.679 Area under the Curve 0.593 0.622 0.878 0.817 0.741
The results of Yelp dataset are shown in Table 5. RF gave the best results for Yelp dataset, while SVM and NB were second and third receptively in term of performance.
Table 5. Experimentation Results of Yelp dataset
DT KNN NB RF SVM Accuracy (%) 60.6 64.8 76.9 79.1 77.2
Kappa Statistics 0.212 0.296 0.538 0.582 0.544
Relative absolute error
(%) 81.86 72.22 54.86 76.30 45.6
Root relative square
error (%) 105.11 101.56 79.67 82.24 95.49 Matthews correlation
coefficient 0.212 0.304 0.538 0.582 0.544 F-Measure 0.606 0.643 0.769 0.791 0.772
Precision-Recall Curve
ISSN(E): 2277-128X, ISSN(P): 2277-6451, pp. 61-65
The results of combined dataset are shown in Table 6. NB slightly edged RF and gave the best results for combined dataset, while SVM was third in term of performance. Figure 1 shows the graphical representation of the comparison results.
Table 6. Experimentation Results of Combined dataset
DT KNN NB RF SVM Accuracy (%) 67.13 61.16 80.06 79.76 78.6
Kappa Statistics 0.342 0.223 0.601 0.595 0.572
Relative absolute error
(%) 72.73 78.55 51.54 70.91 42.73
Root relative square
error (%) 97.35 108.37 74.79 79.29 92.44 Matthews correlation
coefficient 0.344 0.224 0.602 0.595 0.573 F-Measure 0.671 0.611 0.801 0.798 0.786
Precision-Recall Curve
(PRC Area) 0.691 0.631 0.874 0.871 0.786 Area under the Curve
Fig.1.Comparison results of different machine learning algorithms
0 20 40 60 80 100
Amazon IMDb Yelp Combined
Accuracy
DT KNN NB RF SVM
0 20 40 60 80 100
Amazon IMDb Yelp Combined
F-Measure
DT KNN NB RF SVM
0 20 40 60 80 100
Amazon IMDb Yelp Combined
Area Under the Curve
ISSN(E): 2277-128X, ISSN(P): 2277-6451, pp. 61-65
IV. CONCLUSIONS
Text classification especially sentiment analysis is currently one of the hottest domain and is catching attention of many researchers worldwide. But the main issue with this is to find the best algorithm that can be used to perform sentiment analysis. This paper tries to answer this question, by performing comparative analysis of different supervised machine learning for performingsentiment analysis on different dataset under consideration. Our results showed that no algorithm is a clear cut best when tested for different datasets. Out of the total four datasets,Naïve Bayesgave the best performance for two, while Random Forest and Support Vector Machine sharing the honors for the remaining two datasets. Hence we can conclude that for performing sentiment analysis Naïve Bayes is the best choice closely followed by Random Forest and Support Vector Machine. However these are some handful of algorithms that we considered for comparison, with introduction of new hybrid and stacking techniques which are problem specific, there is definite chance that these new hybrid and stacking techniques can outperform Naïve Bayes.
REFERENCES
[1] Liu, Bing. "Sentiment analysis and opinion mining."Synthesis lectures on human language technologies 5, no. 1 (2012): 1-167. doi: 10.2200/S00416ED1V01Y201204HLT016.
[2] Quinlan, J. Ross. "C4. 5: programs for machine learning". Elsevier, 2014.
[3] Aha, David W., Dennis Kibler, and Marc K. Albert. "Instance-based learning algorithms." Machine learning 6, no. 1 (1991): 37-66.doi: 10.1007/BF00153759
[4] McCallum, Andrew, and Kamal Nigam. "A comparison of event models for naive bayes text classification." In AAAI-98 workshop on learning for text categorization, vol. 752, pp. 41-48. 1998.
[5] Schölkopf, Bernhard, Christopher JC Burges, and Alexander J. Smola, eds. Advances in kernel methods: support vector learning. MIT press, 1999.
[6] Breiman, Leo. "Random forests." Machine learning 45, no. 1 (2001): 5-32. doi: 10.1023/A:1010933404324 [7] Witten, Ian H., Eibe Frank, Mark A. Hall, and Christopher J. Pal. "Data Mining: Practical machine learning
tools and techniques". Morgan Kaufmann, 2016.
[8] McAuley, Julian, and Jure Leskovec. "Hidden factors and hidden topics: understanding rating dimensions with review text." In Proceedings of the 7th ACM conference on Recommender systems, pp. 165-172. ACM, 2013. doi: 10.1145/2507157.2507163
[9] Maas, Andrew L., Raymond E. Daly, Peter T. Pham, Dan Huang, Andrew Y. Ng, and Christopher Potts. "Learning word vectors for sentiment analysis." In Proceedings of the 49th Annual Meeting of the Association for Computational Linguistics: Human Language Technologies-Volume 1, pp. 142-150. Association for Computational Linguistics, 2011.