627
© 2017 by the Serbian Biological Society How to cite this article: Blinkova O, Lavrov V. Study of soil water-erosion intensity and vegetation cover of an oak-spruce forest in the Pokutsko-Bukovina Carpathians, Ukraine. Arch Biol Sci. 2017;69(4):627-36.
Study of soil water-erosion intensity and vegetation cover of an oak-spruce forest in the
Pokutsko-Bukovina Carpathians, Ukraine
Olena Blinkova1,* and Vitaliy Lavrov2
1National University of Life and Environmental Sciences of Ukraine, Kyiv, Ukraine 2Bila Tserkva National Agrarian University, Bila Tserkva, Kyiv Region, Ukraine
*Corresponding author: [email protected]
Received: December 6, 2016; Revised: January 30, 2017; Accepted: February 17, 2017; Published online: March 10, 2017
Abstract: The effect of soil erosion on dynamic changes in vegetation cover is an important subject of regional ecological research of the Ukrainian Carpathians. Studies on soil erosion on the Pokutsko-Bukovina Carpathians have focused on the impact of soil water erosion on tree, shrub and herbaceous layers in intensive, moderate, slight and light erosion zones. Results have shown that the intensity of water erosion and runoff, which depend on slope steepness, have a great impact on changes in the vegetation cover. This paper compares the main morphometric parameters of formed ravines, the health
and composition of trees, and the composition of the herbaceous layer.The floristic list of the all experimental plots
com-prised 61 grass species. The stands formed Quercus robur L. and Abies alba L. Assessment of the functional types of plant
species showed that the balance between competition, stress and disturbance is disrupted along a gradient of water-erosion soil transformation. Soil erosion is likely to have caused a change in the edaphic matrix. The distribution of life forms is also disturbed. Analysis of species richness of the vegetation cover under water erosion and the prevailing soil conditions showed that the values of indices depend on erosion intensity.
Keywords: water soil erosion; tree cover; herbaceous layer; erosion zone; Pokutsko-Bukovina Carpathians
INTRODUCTION
Soil is the most basic component, providing a me-dium for plant growth and water retention in forest ecosystems. Soil erosion, especially by water, is a criti-cal environmental problem throughout the world’s forest ecosystems. Erosion reduces the water-holding capacity because of rapid water runoff, and reduces soil organic matter [1-6], thereby significantly reduc-ing plant, animal and microbe species diversity. One of the most effective measures for erosion control and the regeneration of degraded soil is the establishment of a vegetation cover [2-4]. Plant cover protects soil against erosion by reducing water runoff [3,4,7,8]. Also, vegetation can act as a physical barrier, altering sediment flow at the soil surface [3,9,10]. Researchers have pointed out the importance of the relationship between plant morphology and the effects on soil erosion, indicating that plant length and a complete canopy are key features for sediment trapping [10].
rivers and water flows are regulated [5,11,12]. In a forest ecosystem, the reaction of the vegetation cover to erosive phenomena depends on the type, intensity and duration of exposure, and can be detected both at the coenotic level and at populational levels [13,14]. Soil erosion can be controlled through a process of regional assessment, for the development and resto-ration of the plant cover, and can be assessed for the effect of the introduction of conservation measures in areas that are at greatest risk. Forest communities, as structurally and floristically complete complexes, reduce surface erosion and contribute greatly to main-taining slope stability [15].
The Pokutsko-Bukovina Carpathians is a moun-tain range in the outer zone of the Ukrainian Car-pathians. This mountain range is one of the richest in biodiversity in comparison to other regions in Ukraine owing to its unique environmental conditions and the interchange of two natural zones. At the same time, the mountainous terrain of the region is under powerful anthropogenic influence that limits normal development of the vegetation cover. Forest resource degradation in the Pokutsko-Bukovina Carpathians is mainly caused by landslides, mudslides, soil loss from steep slopes and a decline in forested areas [16-18]. As studies have testified, the under-regulated anthropo-genic influence has caused a significant disturbance in the environmental balance of the catchments’ ecosys-tems [16-18]. Deforestation and the removal of natu-ral vegetation are the main reasons for soil erosion due to loss of topsoil and terrain deformation in the mountainous regions of the Pokutsko-Bukovina Car-pathians. Slope length, width and steepness, vegeta-tion cover, the state of the surface soil and the amount of rainfall all exert a considerable influence on soil erodibility and the development of erosion features in this region. The spread of water erosion is one of the main reasons for the observed transformation of the vegetation structure, the decrease in its resistibility and capacity.
In our recent paper, we assessed the relationship between water erosion and tree vegetation [11]. Fol-lowing on from this work, the aim of the present study was to evaluate the relationship between the intensity of soil water erosion and the composition of the veg-etation cover of an oak-spruce forest in the Pokutsko-Bukovina Carpathians.
MATERIALS AND METHODS
Study area
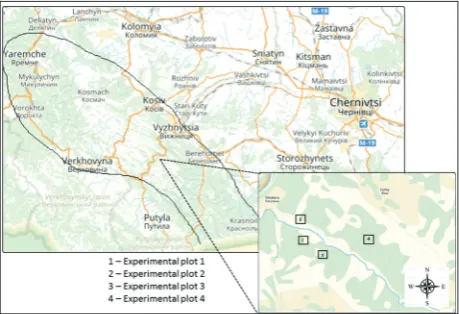
The investigated area is in the Pokutsko-Bukovina Carpathians of Ukraine, on the watershed of the mountain river Tovarnytsya. This river is the right tributary of the river Cheremosh. The Tovarnytsya watershed occupies about 47.5 km2 (Fig. 1). The area was chosen because deforestation influences soil water erosion that is considered typical for the Pokutsko-Bukovina Carpathians. The climate is continental, warm with cyclonic and anticyclonic impacts of Atlantic air. The air temperature in July, the hottest month, ranges from 22°C to 24°C, and in January, the coldest month, from -3°C to -6°C. Low (up to 600 m) and middle mountains (over 600 m) are found in the investigated area. The mountains are composed of systems of mountain ranges separated by tributaries of the Cheremosh. The slopes to an altitude of 200-400 m are covered mainly by oak (Quercus robur L.) and fir-spruce (Рісеа abies L., Abies alba L.) forests [19]. Data collection and processing
An ecological profile consisting of four experimental plots (EP), depending on the erosion transformation gradient at different elevations and different slope steepness in the middle part of the Tovarnytsya river watershed, was established in accordance with the principles of comparative ecology [20]. According to reconnaissance observations of soil water erosion data, the study areas (EPs) were divided into four
soil erosion intensity types, designated as slight ero-sion, light eroero-sion, moderate erosion and intensive erosion. EP1 (48.155283, 25.101772) is located on an intensive eroded slope; steepness of the slope is 31°. EP2 (48.151090, 25.103317) is on a moderate eroded slope; steepness of the slope is 22°. EP3 (48.148333, 25.108209) is on a light eroded slope; steepness of the slope is 14°. EP4 (48.150286, 25.121856) is on a slight eroded slope; steepness of the slope is 4°. Indicators of soil water erosion, such as the degree of transforma-tion of soil erosion, the basic characteristics of ero-sion intensity change, and the dynamic changes in soil erosion, were analyzed. The main morphometric parameters of ravines were analyzed in each studied EP as follows: weighted average of depth (m), width (m), length of the experimental plot (m), distance between the ravines (m), volume of erosional forms (m³/acres), and dissection degree of area gullies (m/ acres). The soil erosion degree of transformationwas determined according to Klukin and Tolstich [21]. To evaluate soil loss, we used the Universal Soil Loss Equation (USLE) [22,23]. Mathematically the equa-tion is as follows:
A = R · K · L · S · C,
where A is the mean annual soil loss; R the rainfall erosivity factor, K the soil erodibility factor, L the slope length factor, S the slope factor, and C the cover man-agement factor. R is a constant at the local level of detail. This factor was derived from rainfall data col-lected by Zaslavskiy [24]. Information required for the determination of K factor values was obtained from the Erosion and Soil Degradation of Ukraine database [25]. The values of L, S, C factors were assessed in accordance with the State Standard Determination of the potential danger of soil erosion in Ukraine [26].
Assessment of tree health and vitality structure
Tree health (category of tree state) was assessed accord-ing to the Sanitary Forest Regulation of Ukraine [27]. The stand state index was calculated as a sum of the values of the tree state index of trees in a certain cat-egory, divided by the total number of examined trees:
Ic = Σki-ni N
where ki is the category of tree state (I – VI); ni is the number of trees in a certain categoryof tree state and N is the total number of trees.
The stands with index values ranging from 1-1.5 are considered as healthy (I), weaker ones (II) have values 1.51- 2.50, seriously weakened ones (III): 2.51- 3.50, wilting ones (IV): 3.51-4.50, recently dead (V): 4.51-5.50, old dead stands (VI): 5.51-6.50. In order to avoid the influence of irregular intensity of silvicul-tural practice on the index of stand state, the weighted average of Kraft classes (WAKC; vitality of tree vegeta-tion) was calculated for each category as a sum of the number of trees in each Kraft class multiplied by the index of the state of the stand (I-V), and divided by the total number trees in a certain state:
i kc
n Ic k
WAKC=
∑
•where kkc is the number of trees in each Kraft class; Ic is the index of the stand state and ni is the number of trees in a certain state category.
The trees in each category were divided into five Kraft classes. Classes Va and Vb were combined into class V, since trees of these categories were rarely found in the experimental plots. The WAKC describes the damage zone in the tree stratum: the closer the WAKC is to Kraft class I, the higher is the degree of damage. For each stand, the forest mensuration pa-rameters were derived as follows: age (A); the total number of trees (N), the weighted average of diam-eters (Dave), height (Have), diameter and height range (Dmin-Dmax; Hmin-Hmax) and standard deviation (SD), stand density (P), and stand basal area as a sum of tree basal areas (Gn). The morphometric parameters were measured by an optical altimeter (Suunto PM-5; Waldmeister 100alu Calipers).
Herbaceous layer assessment
from Raunkiaer [31]. The types of ecological strategies were identified by Grime [32,33].
Statistical analyses
For the assessment of plant biodiversity, various meth-ods and indices are available. In this study, the Shan-non index and the Berger-Parker index were used to estimate plant diversity for each EP [34]. Shannon’s index of diversity was used for the generalized assess-ment of plant diversity:
∑
= pi i
H log2ρ, pi – the ratio of each species
Berger-Parker’s Index was used to describe the species abundance distribution of disturbed communities:
N
N
d
=
max ,where Nmax is the maximum number of identified spe-cies, and N is the total number of individuals.
RESULTS
Dynamic changes in soil erosion area
We observed that the main type of soil erosion on slopes above 10о at the eco-profile is water erosion. All detected ravines within each EP are active (Table 1). Erosive processes begin in the zone of partially degrad-ed forest (EP1) where the forest canopy is less than 0.3. At the same time, under an optimal forest canopy the typical forest vegetation is well preserved, and there are almost no signs of water erosion (EP4). Erosive forma-tions (ravines) gradually develop on an anthropogenic
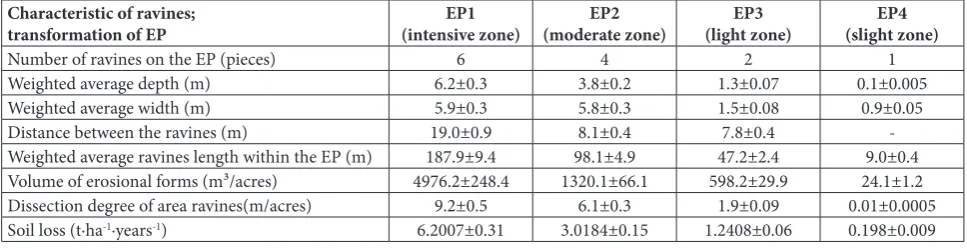
transformation gradient from EP1 to EP4. The formed ravines are partially covered with turf, but within EP1-EP2 elements of mesorelief, the rock appears at the soil surface. The number of ravines increases from 1 to 6. In direct proportion to the number of ravines is the in-crease in morphometric parameters of the ravines. The greatest depth of a ravine was recorded at EP1 (6.2±0.3 m). This parameter decreased to 0.1±0.005 m (EP4) with the decrease in erosion intensity. A similar trend was observed in the change of the weighted average width of the ravines at the EP. The volume of erosional forms reached maximum values at EP1. This was about 200-fold greater than at the slightly eroded zone (EP4). The increase in the number of ravines, their depth and width, and the volumes of erosional forms inevitably entailed an increase in the distance between the ra-vines. Analysis showed that the main characteristic of erosion-degraded ravines was linked to the degree of transformation due to soil erosion of each EP.
Tree health and vitality structure
The stand was classified as a fresh spruce oaken for-est type. The stands were one-storied, exhibiting slight erosion, moderate erosion and intensive erosion in the studied zones (Table 2). The first story was composed of
Quercus robur L. and Abies alba L. The exceptions were the two-storied A. alba and Fagus sylvatica L. stands of EP4 that displayed slight erosion transformation. Analysis of material along the gradient of erosion transformation showed that the highest forest stand parameters (diameter, height, total number of trees and others) were in EP4. The magnitude of stand density also largely differed between the studied areas (0.3-0.9).
Analysis of health conditions of Q. robur at all EPs
revealed evidence of pathological processes in slight,
Table 1. The results of analyses of transformation of different eroded experimental plots (zones) are shown via basic characteristics of the change in erosion intensity, the main morphometric parameters of ravines, the degree of soil erosion transformation and soil loss.
Characteristic of ravines;
transformation of EP (intensive zone)EP1 (moderate zone)EP2 (light zone)EP3 (slight zone)EP4
Number of ravines on the EP (pieces) 6 4 2 1
Weighted average depth (m) 6.2±0.3 3.8±0.2 1.3±0.07 0.1±0.005
Weighted average width (m) 5.9±0.3 5.8±0.3 1.5±0.08 0.9±0.05
Distance between the ravines (m) 19.0±0.9 8.1±0.4 7.8±0.4
-Weighted average ravines length within the EP (m) 187.9±9.4 98.1±4.9 47.2±2.4 9.0±0.4
Volume of erosional forms (m³/acres) 4976.2±248.4 1320.1±66.1 598.2±29.9 24.1±1.2
Dissection degree of area ravines(m/acres) 9.2±0.5 6.1±0.3 1.9±0.09 0.01±0.0005
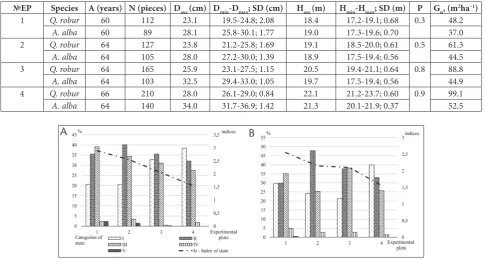
moderate and intensive erosion (Fig. 2a). Notably, the proportion of healthy trees was reduced from 38.5% (EP4) to 20.7% (EP1). The proportion of weakened and markedly-weakened Q. robur individuals decreased at the eco-profile. At the same time, it was noted that re-cently dead Q. robur trees at EP4 were absent. The indi-ces of the stand states ranged from 1.55 to 2.89. Analysis of the vitality of Q. robur confirmed the presence of pathological processes at the eco-profile. Regarding tree development, the trees were divided into individual cat-egories in the intensive erosion (EP1) area as follows: 15.3% – Kraft class I trees; 22.2% – Kraft class II trees; 39.3% – Kraft class III trees; 17.8% – Kraft class IV trees; 5.4% – Kraft class V trees. The WAKC of healthy (I state category; WAKC=2.0-2.2) and weakened (II state category; WAKC=3.0-3.2) trees indicated that the number of trees in Kraft classes I-II was reduced when the trees were closer to the erosion ravines and open landscape elements. In areas of moderate (EP2) and light (EP3) erosion, the vitality of Q. robur was similar, with 29.3%-35.4% of trees belonging to Kraft class I, 27.9%-30.1% to Kraft class II, 25.7-24.3% to Kraft class III and 17.1-10.2% of trees belonging to Kraft class IV.
Kraft class V trees were absent. In EP4, the proportion of the highest developed classes of trees (I-II) was maxi-mum. Trees of classes IV and V were absent.
The analyses of health conditions and vitality of A. alba revealed a small degree of damage in all experi-mental plots (Fig. 2b). The proportion of healthy trees was 29.5%-40.0%, the proportion of weakened trees was 29.9%-32.9%, of markedly weakened trees 36.1%-25.7%, and of wilting trees 5.0%-1.4%. Recently dead stands of
A. alba were present only in EP1 (0.5%).The index of stand state ranged from 1.56 to 2.56. Analysis of A. alba
vitality revealed a similar trend regarding the distribu-tion of trees in Kraft classes as for Q. robur. The number of trees in high Kraft classes was gradually reduced at the eco-profile. The WAKC of healthy (WAKC=1.8-2.0) and weakened (WAKC=2.2-2.4) trees were slightly high-er compared to the data for Q. robur. Such a distribution of trees in Kraft classes of both species is caused by the transformation of soil by water erosion.
The second story of EP4 was composed of A. alba and F. sylvatica. The stand parameters of A. alba
Table 2. Characteristic of the dominant tree vegetation in different experimental plots. Variation of forest mensuration parameters for
Q. robur and A. alba are represented.
№EP Species A (years) N (pieces) Dave (cm) Dmin-Dmax; SD (cm) Have (m) Hmin-Hmax; SD (m) P Gn, (m2ha–1)
1 Q. robur 60 112 23.1 19.5-24.8; 2.08 18.4 17.2-19.1; 0.68 0.3 48.2
A. alba 60 89 28.1 25.8-30.1; 1.77 19.0 17.3-19.6; 0.70 37.0
2 Q. robur 64 127 23.8 21.2-25.8; 1.69 19.1 18.5-20.0; 0.61 0.5 61.3
A. alba 64 105 28.0 27.2-30.0; 1.39 18.9 17.5-19.4; 0.56 44.5
3 Q. robur 64 165 25.9 23.1-27.5; 1.15 20.5 19.4-21.1; 0.64 0.8 88.8
A. alba 64 103 32.5 29.4-33.0; 1.05 19.7 17.5-19.4; 0.56 44.9
4 Q. robur 66 210 28.0 26.1-29.0; 0.84 22.1 21.2-23.7; 0.60 0.9 99.1
A. alba 64 140 34.0 31.7-36.9; 1.42 21.3 20.1-21.9; 0.37 52.5
(Is=1.65) were: A=40–50; Gn=48.7 m2ha–1; N=144 psc. ha–1; H
ave=17.0 m, Hmin=14.4 m, Hmax=19.1 m, S.D.=2.56 m; Dave=27.1 cm; Dmin=20.4 cm, Dmax =31.1 cm, S.D.=4.22 cm. The stand parameters of F. sylvatica (Is=1.55) were: A=40–50; Gn=65.3 m2ha–1; N=157 psc.ha–1; H
ave=18.1 m, Hmin=15.9 m, Hmax=22.2 m, S.D.=2.92 m; Dave=30.5 cm; Dmin=27.1 cm, Dmax =40.9 cm, S.D.=6.14 cm.
An understory shrub layer was observed in EP3 and EP4. The understory was composed of Frangula alnus Mill. (Is=2.60) and Corylus avellana L. (Is=2.45) in EP3, and by F. alnus (Is=1.60), C. avellana (Is=1.55) and Viburnum opulus L. (Is=1.55) in EP4. Q. robur
occurred in the undergrowth only in EP4.
Herbaceous cover
The responses of the herbaceous cover to changes in the soil are distinctive. The floristic list of all experimental plots comprised 61 grass species belonging to 58 genera and 17 families. It included species of Liliopsida and
Magnoliopsida. Asteraceae (17 spp., 27.8%), Poaceae
(13 spp., 21.3%), Fabaceae (11 spp., 18.0%) were the most represented families. The predominance of these families is associated with erosive formations (ravines), where soil deformation and creep are the most active processes. These were followed by Lamiaceae (7 spp., 11.5%), Caryophyllaceae (5 spp., 8.2%), Ranunculaceae
(5 spp., 8.2%)and Rosaceae (3 spp., 5.0%). The remain-ing families had less than three species. The herbaceous cover of the intensive erosion EP1 was rather poor, the projected cover was 10.5%. Altogether 24 species were found in EP1. Representatives of dominant families
Poaceae (37.5% − Agropyron pectinatum (Bieb.) Beauv, Bromopsis inermis (Leys.) Holub, Calamagrostis epigeios
(L.) Roth, Dactylis glomerata L., Festuca heterophylla
Lam. and other species), Asteraceae (29.1 % − Achil-lea submillefolium Klok. et Krytzka, Ambrosia artemi-siifolia L., Cirsium setosum Bess., Conyza canadensis
L., Hedera helix L., Stenactis annua Ness.and others), and Fabaceae (20.8 % − Ajuga reptans L., Medicago lu-pulina L., Melilotus officinalis (L.) Pal., Lathyrus vernus
Bernh., Trifolium pretense L.) were present on all ravine elements. The total projected cover of the herbaceous story in EP2 was 25.5% (27 species). The total projected cover of the herbaceous story in EP3 was higher than in EP2 (30.0%; 35 species). At zones of light and mod-erate erosion, the most widespread were the families
Poaceae, Asteraceae and Fabaceae. Only in places where
A. alba and Q. robur are developed do species of other families, namely Lamiaceae (Galeobdolon luteum Huds., Glechoma hederacea L.), Caryophyllaceae (Stellaria ho-lostea L.), Ranunculaceae (Ranunculus cassubicus L.) and Apocynaceae (Vinca minor L.), begin to appear. The most pronounced floristic saturation (44 species) and range of families were detected in EP4, which is typi-cal for this forest type. The appearance of species such as Asarum europaeum L., Astrantia major L., Dentaria bulbifera L., Maianthemum bifolium (L.) F.W. Schmidt.,
Mercurialis perennis L. and Vaccinium vitis-idaea L. were detected only in this zone.
The biological spectrum of vegetation is an index of erosion in the studied area. It is comprised of differ-ent life forms that are found in the vegetation cover of the plots. The variety of life forms is the ultimate mani-festation of the sum of all the adaptations of plants to water erosion. There are marked differences in the spectra of life forms in the experimental plots (Fig. 3). Hemicryptophytes are the dominant life forms in all EPs. Therophytes are the next dominant in intensive, moderate and light zones of erosion, with an overall representation of 26.9%, 27.9%, and 23.2%, respec-tively. Therophytes are more abundant in the zone of erosion (15.2%). They are followed by cryptophytes, which are more common in EP1 (19.2%). Chamae-phytes are significantly less numerous in EP1 (4.0%) than in EP2-EP4 (13.7%-15.4%), while chamaephytes have almost the same share. An interesting peculiar-ity is the gradually decreasing proportion of phanero-phytes, which is explained by the weak mechanism of adaptation of the generative organs of phanerophytes
to strong anthropogenic loads. Thus, the range of vegetation life forms at the eco-profile is evidence to the presence of original morphological adaptations of plants to a permanently changing soil environment.
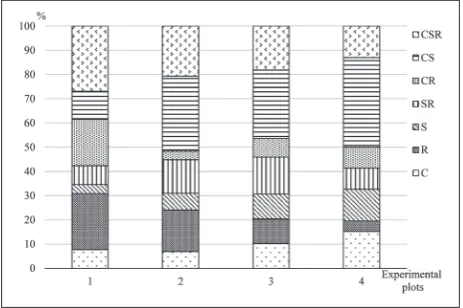
Plant characteristics, such as ecological strategies, have been used to explain the succession of changes in water erosion intensity at the eco-profile. Plant func-tional types (Grime’s CSR ecological strategies) were determined.. Plant species were divided into 7 different functional types (C, R, S, SR, CR, SC and CSR) (Fig. 4). The most abundant functional types were CSR (26.9%) and R (23.11%) at the intensive erosion zone. S was the rarest functional type. SR and C were distributed in the same proportion (7.7%). Competition was the major pressure factor, but disturbance and stress were also effective on plant species in EP1. In EP2, most of the plant species were grouped into CS (31.0%) and CSR (20.7%) types. Ruderal and competitive-ruderal species were fewer compared to EP1. The most abundant func-tional type was CS (28.2%) in the zone of slight ero-sion (EP3). Functional types C, R and S had the same distribution (10.2%). CR species were the rarest. The most abundant functional types were CS (36.9%) in the zone of light erosion (EP4). Ruderal species (4.4%) were the least in number at the eco-profile, which was in contrast to competitive species (15.2%). SR and CR had the same distribution (8.7%).
Analysis of species richness of plant vegetation under water erosion soil conditions along the gradient
of transformation showed that maximal species rich-ness indices were in EP4 (Fig. 5). The computed index shows that the zone of light erosion had the highest Shannon index of 3.41, and that the zone of intensive erosion had an index of 2.01, which was also the low-est. The computed Berger-Parker index was found to be highest (0.24) in the zone of light erosion. The computed Berger-Parker indices in zones of light and moderate erosion were the same. This suggests that the diversity of the vegetation in the light water ero-sion type is comparatively greater than in other types.
DISCUSSION
The relationships between the intensity of water ero-sion of anthropogenic origin and vegetation cover have long attracted the attention of scientists. To study the changes in soil erosion and the conditions under which it occurs, researchers have examined the forma-tion and changes in global soil erosion from ancient times to the present, and summarized efforts to restore and conserve soil, through terracing, reforesting, ag-riculture size, etc. [1,35]. Water erosion on watershed slopes is a complex process that brings together the impact of raindrops, removal of slope deposits and transport of loose material by overland flow [36]. This erosion is a result of interactions in the vegetation cover-soil-water system and human impact. The in-tensity of water erosion depends on two basic factors: the erodibility of surface deposits and the energy of water flowing over the surface. These are controlled by a number of factors, which together determine the readiness of surface deposits to be eroded and the
abil-Fig. 4. Comparative representation of the functional types of the plant species between experimental plots. Functional types: C – competitors; R – ruderals; S – stress tolerant; RS – ruderal-stress tolerant; CR – competitor-ruderals; CS – competitor-stress toler-ant; CSR –competitor-stress tolerant-ruderals. The contribution of each type is shown in percentages.
ity of water flows to originate on slopes and to scour and transport loose material [37]. Moreover, our re-sults show that a marked increase in the gradient of soil erosive degradation depends on the steepness of the slope. This is in agreement with known data on the increase in the potential energy of erosive processes down a slope, which are influenced by the increase in speed and mass of direct runoff [16,17,38].
Water erosion leads to individual differences in tree growth, crown asymmetry and forest stand struc-ture, and it governs stand structure and species diver-sity [39-43]. The regime of land surface disturbance has been noted as an important factor affecting stand structure and species diversity [44]. A relationship between vegetation characteristics and geomorphic processes has been found, particularly at sites with fre-quent catastrophic disturbances such as landslides [45-47]. The existence of such a relationship is confirmed in our study. Results from other studies indicated that crest slope, upper slope and high elevation are most suitable for biomass accumulation in forests [10,43,48]. Vegetation type and cover play an important role in the operation of geomorphological processes by controlling runoff and sediment dynamics. Plant cover maintains the crucial interrelationship between soil properties and decreased biodiversity in steeply sloped areas with highly erodible soils [2-4]. This is confirmed by other studies that have shown the effects of plant species diversity on the control of surface run-off, soil erosion and plant species diversity [49]. Tree species richness showed a more balanced and homog-enous vegetation development than monocultures in initial forest ecosystems of China. High crown cover reduced soil erosion, whereas it was slightly increased with increased tree height. Thus, low tree stands with a high canopy cover effectively counteract soil loss [50]. Our results illustrate the changes in stand struc-ture and species diversity and provide correlations between stand parameters (mensuration parameters, canopy cover, tree health and vitality structure) in four zones, based on different intensities of water erosion.
The results of a study in northeastern Iran showed that the effect of canopy cover on water erosion is strongly related to runoff generation and the soil loss potential of the surface. The vegetation cover thus has a significant effect on soil loss, and this effect is
pronounced when the erosion potential is high [51]. Our results confirmed the correlation between the composition of the vegetation cover and the intensity of water erosion of soil in four soil erosion types.
Research of the impact of water erosion on soil degradation processes in the Mediterranean region has shown that a critical steepness of slope is less than 10 degrees, which violates the spatial patterns of vegetation cover and species richness [52]. Other authors have found that the diversity of plant species correlates weakly with plant cover but strongly with the properties of soil that are related to water-holding capacity and resistance to erosion [53].
In the headwaters of the Jizera Mts. (Czech Re-public and Poland), the potential annual loss of soil varies from 0.2 mm to 1.2 mm [54]. Important soil loss occurred in erosion rills formed by the skidding of timber (from 0.3 to 1.2 mm/year). The critical pa-rameter affecting the recovery of rills is their depth. The increasing depth of ravines is related to a decrease in both vegetation cover and number of species, and to a higher proportion of hemicryptophytes (25.4%) and plants forming clusters or bunches. Contrary to expectation, the results of the present study confirmed that the increasing depth of ravines from 0.1 to 6.2 m was associated with a higher proportion of cryp-tophytes (19.2%) and therophytes (26.9%). However, the data on significantly increasing species richness were similar to previous analyses [52,53].
The autogenic response of plants may influence the susceptibility of soil to erosion through a change of soil resources. In the drylands of South Africa, shrub communities possess higher parameters of heteroge-neity than grasslands [55]. This confirmed the view that the heterogeneity of different life forms can influ-ence the susceptibility of soil to erosion.
between functional types is a major determinant of vegetation structure and species composition at any site [60,61]. The effects of erosion may be responsible for the loss of a species, which can have a cascading effect on a wide array of species within the forest eco-system [62]. This study supports the existing view that higher plant diversity is one of the most relevant fac-tors for enhancing soil stability in disturbed areas [63].
Acknowledgments: This work was supported by the National Academy of Sciences of Ukraine, Grant № 112U002738. The au-thors would like to thank Dr. Sci., Prof. Vladimir Radchenko for the technical support. The authors also thank the two anonymous reviewers for their constructive comments and thoughtful criti-cism.
Author’s contributions: Olena Blinkova: collection and data anal-ysis, coordinating and setting the aim of the research, statistical analysis of data and study design. Vitaliy Lavrov: collection and data analysis, coordinating and setting the aim of the research.
Conflict of interest disclosure: The authors confirm no actual or potential conflicts of interest, including any financial, personal, or other relationships with people or organizations.
REFERENCES
1. Dotterweich M. The history of human-induced soil erosion: geomorphic legacies, early descriptions and research, and the development of soil conservation - a global synopsis. Geomorph. 2013;201(1):1-34.
2. Duran-Zuazo V, Aguilar R, Martínez R, Franco D. Impact of erosion in the taluses of subtropical orchard terraces. Agri-cult Ecosys Environ. 2005;107:199-210.
3. Duran-Zuazo V, Francia M, Rodríguez P, Martínez R, Cárceles R. Soil erosion and runoff prevention by plant cov-ers in a mountainous area (SE Spain): implications for sus-tainable agriculture. Environmentalist. 2006;26(4):309-19. 4. Duran-Zuazo V, Pleguezuelo C. Soil-erosion and runoff
prevention by plant covers, a review. Agron Sustain Dev. 2008;28(1):65-86.
5. Gorshenin N. Erosion of forest soils. 2 st ed. Moscow: For-estry industry; 1994. 128 p.
6. Shrestha D. Assessment of soil erosion in the Nepalese Himalaya: a case study in Likhu Khola Valley, Middle Moun-tain Region. Land Husbandry. 1997;2(1):59-80.
7. Puigdefábregas J. The role of vegetation patterns in struc-turing runoff and sediment fluxes in drylands. Earth Surf Process Landforms. 2005;30(2):133-47.
8. Rey F. Influence of vegetation distribution on sediment yield in forested marly gullies. Catena. 2003;50(2):549-62. 9. Lee K, Isenhart T, Schultz C, Mickelson S. Multispecies
riparian buffers trap sediment and nutrients during rainfall simulations. J Environ Qual. 2000;29(4):1200-05.
10. van Dijk P, Kwaad F, Klapwijk M. Retention of water and sediment by grass strips. Hydrol Process. 1996;10:1069-80. 11. Blinkova O. Analysis of synergies between the vegetation
cover and the intensity of outwash in mountain conditions. Ecol Noospher. 2015;26(1-2):66-73.
12. Wells M. A method of assessing water erosion risk in land capability studies: Swan Coastal Plain and Darling Range. Western Australia: Department of agriculture and food; 2001 Jan. 12 p. Report No.: 73.
13. Dewitt TJ, Sih A, Wilson DS. Costs and limits of phenotypic plasticity. Trends Ecol Evolut. 1998;13 (2):77-81.
14. Egas M, Dieckmann U, Sabelis M. Evolution restricts the coexistence of specialists and generalists: the role of trade-off structure. Amer Nat. 2004;163(4):518-31.
15. Menashe E. Vegetation and erosion: a literature survey. In: Rose R, Haase DL, editors. 5th Native plants Propagating and
Planting Symposium; 1998 December 9-10; Corvallis, USA, Oregon State University. p 1-10.
16. Oleynik V. Erodibility of land in agricultural land-scapes Pokutsko-Bukovina Carpathians. Geopolit Reg. 2014;10(2):361-4.
17. Oleynik V. Hydrological role of forests of Ukrainian Car-pathians. 3rd rev ed. Ivano-Frankivsk: Nairi Publishing; 2013.
232 p.
18. Solodkiy V, Bespalko R, Kasimir I. Exogenous geodynamic processes of Pokutsko-Bukovina Carpathians. J Environ Nat Manag. 2013;13(9):54-63.
19. Stoyko S. Oak forests of the Ukrainian Carpathians: ecologi-cal peculiarities, restoration, conservation. Lviv: Institute of ecology of the Carpathians of NAS of Ukraine; 2009. 219 p. 20. Anuchin N. Forest taxation. Moscow: Nauka; 1977. 552 p. 21. Klukin A, Tolstich E. Study of speed contemporary
denu-dation of mountainous slopes. Geomorph. 1977;2(5):62-9. 22. van der Knijft JM., Jones JA, Montanarella L. Soil erosion
risk assessment in Europe. Luxemburg: Office for Official Publications of the European Communities; 2000. 34 р. Report No.: EUR 19044 EN.
23. van der Rompaey AJ, Bazzoffi P, Vieillefont, Jones JA. Vali-dation of soil erosion estimates at European scale. Luxem-burg: European Soil Bureau Research; 2003 Feb. 26 p. Report No.:13-EUR 20827.
24. Zaslavskiy M. Edaphology. 1st ed. Moscow: High school; 1983. 320 p.
25. Baranovskiy VA, cartographer. Ecologo-geografical atlas of Ukraine [map]. Kyiv: Council of Productive Forces of Ukraine; 2006. 1 sheets: 1:8000000; 65x95cm; color. 26. State Standard Determination of potential danger of soil
erosion due to rains of 2008. Rep. No 17.4.4.03-86 (August 1, 2008).
27. Sanitary Forest Regulation in Ukraine. Resolution of Gov-ernment of Ukraine. No. 555 (July 27, 1995).
28. Cherepanov S. Vascular plants of Russia and neighboring countries. Saint Petersburg: World and family; 1995. 992 p. 29. International Code of Nomenclature for algae, fungi and
- [cited 2016 Dec 5]. Available from: http://www.iapt-taxon. org/nomen/main.php
30. Braun-Blanquet J. Pflanzensoziologie, Grundzüge der Veg-etationskunde. 3rd ed. New York: Springer, Wien; 1964. 865
p. German.
31. Raunkiaer C. The life forms of plants and statistical plants geography; being the collected papers of C. Raunkiaer. Oxford: Clarendon Press; 1934. 632 p.
32. Grime J. Plant strategies, vegetation process, and ecosystem properties. 2nd ed. New York: Chichester, John Wiley Second
Edition; 2002. 456 p.
33. Grime J. Plant strategy theories: a comment on. J Ecol. 2007;95(2):227-30.
34. Magurran A. Ecological diversity and its measurement. New Jersey (Princeton): Princeton University Press; 1998. 192 p. 35. Bhandari K, Aryal J, Darnsawasd R. A geospatial approach
to assessing soil erosion in a watershed by integrating socio-economic determinants and the RUSLE model. Natural Haz-ards. 2015;75(1):321-42.
36. Mandych A. Water erosion and sediment yield in mountain areas: natural preconditions. In: Krecek J, Rajwar G, Haigh M, editors. Updating the proceedings of the first and second international conferences on headwater hydrological prob-lems and environmental management in highlands and head-waters; 1996 Jan 1-2; Rotterdam, Netherlands. 1996. p. 27-34. 37. Donoso M. Water interactions with energy, environment, food
and agriculture.Volume II. Uruguay: Montevideo; 2009. 416 p. 38. Schumm S. The Fluvial Systems. Hoboken: Wiley
Inter-science; 1977. 338 p.
39. Clementine G, Raphaël P, Jean-Pierre P, François H. Sam-pling strategies for the assessment of tree species diversity. J Veget Sci. 1998;9(2):161-72.
40. Clark D, Read J. Edaphic variation and the mesoscale dis-tribution of tree species in a neotropical rain forest. J Ecol. 1998;86(1):101-12.
41. Gale N. The relationship between canopy gaps and topog-raphy in a Western Ecuadorian rain forest. Biotropica. 2000;32(4):653-61.
42. Robert A. Simulation of the effect of topography and tree falls on stand dynamics and stand structure of tropical for-ests. Ecolog Model. 2003;167(1):287-303.
43. Do T, Sato T, Saito S, Kozan O, Yamagawa H, Nagamatsu D, Manabe T. Effects of micro-topographies on stand struc-ture and tree species diversity in an old-growth evergreen broad-leaved forest, southwestern Japan. Global Ecol Con-serv. 2015;4:185-96.
44. Nagamatsu D, Hirabuki Y, Mochida Y. Influence of micro-landforms on forest structure, tree death and recruitment in a Japanese temperate mixed forest. Ecol Res. 2003;18(5):533-47. 45. Miles D, Swanson F. Vegetation composition on recent land-slides in the Cascade Mountains of western Oregon Can. J For Res. 1986;16:739-44.
46. van der Sman AJ, Joosten NN, Blom CW. Flooding regimes and life-history characteristics of short-lived species in river forelands. J Ecol. 1993;81(1):121-30.
47. Bellingham P, Kohyama T, Aiba S. The effects of a typhoon on Japanese warm temperate rainforests. Ecol Res. 1996;11(3):229-47.
48. Shrestha RP, Schmidt-Vogt D, Gnanavelrajah N. Relating plant diversity to biomass and soil erosion in a cultivated landscape of the eastern seaboard region of Thailand. Appl Geogr. 2010;30(4):606-17.
49. Zhenhong W. Relationship between plant species diversity and soil erosion on different secondary succession phases of Semi-Humid Evergreeen broad-leaved forest. In: Raine SR,. Biggs AJW, Menzies NW, Freebairn DM, Tolmie PE, edi-tors. Proceeding of the 13th International soil conservation organisation conference; 2004 July 4-8; Brisbane, Australia. 2004. p. 990-2.
50. Seitz S, Goebes P, Song Z, Bruelheide H, Härdtle W, Kühn P, Li Y, Scholten T. Tree species and functional traits but not species richness affect interrill erosion processes in young subtropical forests. Soil. 2016;2:49-61.
51. Eshghizadeh M, Talebi A, Dastorani M, Azimzadeh H. Effect of natural land covers on runoff and soil loss at the hill-slope scale. Global J Environ Sci Managment. 2016;2(2):125-34. 52. Nadal-Romero E, Petrlic K, Verachtert E, Bochetand E,
Poesen J. Effects of slope angle and aspect on plant cover and species richness in a humid Mediterranean badland. Earth Surf Process Landforms. 2014;39(13):1705-16.
53. García-Fayos P, Bochet E. Indication of antagonistic interac-tion between climate change and erosion on plant species richness and soil properties in semiarid Mediterranean eco-systems. Global Change Biol. 2009;15(2):306-18.
54. Novakova J, Krecek J. Impact of herbaceous vegetation on recovery of a harvested headwater catchment. ERWH. 2006;63(1):77-86.
55. Dickie J, Parsons A. Eco-geomorphological processes within grasslands, shrublands and badlands in the Semi-arid Karoo, South Africa. Land Degrad Develop. 2012;23(6):534-47. 56. Kilinc M, Karavin N, Kutbay H. Classification of some plant
species according to Grime’s strategies in Quercus cerris L. var. cerris woodland in Samsun, northern Turkey. Turkish J Bot. 2010;34:521-9.
57. Craine J. Reconciling plant strategy theories of Grime and Tilman. J Ecol. 2005;93(6):1041-52.
58. Smith H, Feber R, Morecroft M, Taylor M, Macdonald D. Short-term successional change does not predict long-term conservation value of managed arable field margins. Biol Conserv. 2010;143(3):813-22.
59. Hooper D. The role of complementarity and competition in ecosystem responses to variation in plant diversity. Ecology. 1998;79 (2):704-19.
60. Weiher E, Vander-Werf A, Thompson K, Roderick M, Gar-nier E, Eriksson O. Challenging theophrastus: a common core list of plant traits for functional ecology. J Veget Sci. 1999;10(50):609-20.
61. Lavergne S, Garnier E, Debussche M. Do rock endemic and widespread plant species differ under the leaf-height-seed plant ecology strategy scheme? Ecol Lett. 2003;6(5):398-404. 62. Pimental D. Soil erosion: a food and environmental threat.
Environ Dev Sustain. 2006;8(1):119-37.