International Journal Advances in Social Science and Humanities
Available Online at: www.ijassh.com
RESEARCH ARTICLE
Satisfaction of Digital Resources Prevailed in Engineering College
Libraries of Kadapa District, A.P.
N. Ravi Sankar Reddy
1,M. Doraswamy
2*1.Ph.D. Scholar (PT) KSRM College of Engineering Kadapa District, A.P.
2.Department of Library and Information Science Dravidian University Kuppam- 517 426, Chittoor Dist.,
A.P.
*Corresponding Author:M. Doraswamy
Abstract:The main aim the study is to examine the level of satisfaction of various digital resources and services prevailed in engineering college libraries of Kadapa Distrtict of Andhra Pradesh. The survey design method with help of a well-structured questionnaire is used in the study. And 819 users of engineering colleges were randomly selected as sample for this study. The study aimed at identifying the satisfaction of various digital resources such as e-books, e-journals, e-newsletters, e-theses/dissertations, e-indexing databases, e-abstracting databases, e-bibliographical databases, e-standards, institutional repositories, AICTE Consortium, DELNET resources and services, N-List resources NPTEL video lectures made by the users. The study revealed that the users are more satisfied with the CD/DVD databases, AICTE Consortium, NPTEL Video lectures, and DELNET resources and services compared to other digital resources. Institutional repositories and e-journals are the least ranked among digital resources for lowest satisfaction level.
Keywords: Digital Resources,Libraries.
Article Received: 26 Sept. 2019 Revised: 18 Oct. 2019 Accepted: 21 Oct. 2019
Introduction
In the present communication technological era academic library such as college libraries have been an enormous contribution and accountability to support in education and learning process. Being academic institutions, all colleges are applying and implementing Infrastructures of ICT in their libraries according to users information needs. Advancement of ICT has radically misrepresented worldwide library resources and services. The college library contributes primarily to the teaching and learning process for faculty members and students and it has an accountability to distribute and communicate users with a collection of resources and services.
Therefore, the colleges need to strengthen their library resources and services according to users’ information needs and satisfaction levels. In today’s rapidly changing information world, information needs of users are met through an overabundance of sources. The library is obviously the source of power of knowledge in higher education and research, the use of library resources and services is a matter of concerns to faculty
members and students. The successes of any modern library today have been based on users’ satisfaction. The library should know the information needs of their users and make changes according to the user’s information needs; otherwise the library will not achieve their mission. The mission of all academic libraries is to collect, to organize and to dissemination of information in order to users’ information needs. The assessment and evaluation of library users satisfaction is an authentic tool for measuring library performance.
The present study attempts to investigate the various aspects on users’ satisfaction towards digital library resources and services, conducting such a study will help to determine future plans for the engineering college libraries authority and users in reshaping their digital library resources and services for providing users in a more effective manner.
Objectives of the Study
digital resources such as books, e-journals, e-newsletters, e-theses/dissertations, e-indexing databases, e-abstracting databases, e-bibliographical databases, e-standards, institutional repositories, AICTE Consortium, DELNET resources and services, N-List resources NPTEL video lectures made by the users. Recommend concrete suggestions and
recommendations to authorities for improving the satisfaction levels of digital resources basin on inputs collected from users.
Hypothesis
The Following Hypothesis were
Formulated for Testing
There would not be any significant differences in satisfaction levels of various digital resources between male and female students and undergraduate and postgraduate students.
Research Design
Methodology
The methodology of this research is based on the exploratory design.
Sources of the Data
The required data for the study was collected from the primary and secondary sources. The primary data was collected from the questionnaires. The secondary data was collected from various sources like books, journals, websites etc.
Data Collection Instrument
The primary data was collected through questionnaire tool which was carefully designed and tested to analyse the use of
digital resources by users of engineering colleges.
Sampling Instrument
The sampling technique used here is simple random sampling method.
Sample size
The sample size of this study comprises of 10 percent of the final year undergraduate students and fifty percent of the postgraduate students of 21 engineering colleges located in Kadapa district of Andhra Pradesh. All these engineering colleges affiliated to Jawaharlal Nehru Technological University, Ananthapuramu, and Andhra Pradesh.
Sampling Population
This study is conducted among 1180 users of the engineering colleges in Kadapa district. The response was received from 819 users which constitute 69.41% of response rate.
Satisfaction Level of Digital Resources The level of satisfaction with different digital and services, namely books, journals, e-newsletters, e-theses/dissertations, e-indexing databases, e-abstracting databases, e-bibliographical databases, e-standards, institutional repositories, AICTE Consortium, DELNET resources and services, N-List resources NPTEL video lectures available in their library were discussed in the following paragraphs.
E-Books
The distribution of students according to the level of satisfaction with the e-books, in relation to gender and status is revealed in Table 1.
Table 1: Level of satisfaction with e-books
Level of Satisfaction Gender Status Total
Male Female UG PG
Fully 127
(27.86)
109 (30.02)
114 (25.68)
122 (32.54)
236 (28.82)
Fairly 154
(33.78)
122 (33.61)
159 (35.81)
117 (31.20)
276 (33.69)
Partially 129
(28.29)
114 (31.41)
137 (30.86)
106 (28.26)
243 (29.69)
Not much 19
(04.17)
08 (02.21)
09 (02.02)
18 (04.80)
27 (03.29)
Not 27
(05.90)
10 (02.75)
25 (05.63)
12 (03.20)
37 (04.51)
Total n=456
(100.00)
n=363 (100.00)
n=444 (100.00)
n=375 (100.00)
E-Journals
The distribution of students according to the level of satisfaction with the e-journals, in
relation to gender and status is revealed in Table 2.
Table 2: Level of satisfaction with e-journals
Level of Satisfaction Male Gender Female UG Status PG Total
Fully 105
(23.03)
111 (30.57)
113 (25.46)
103 (27.47)
216 (26.38)
Fairly (27.64) 126 (31.44) 114 (27.26) 121 (31.74) 119 (29.31) 240
Partially (34.86) 159 (34.15) 124 (39.64) 176 (28.54) 107 (34.56) 283
Not much (06.14) 28 (01.37) 05 (03.37) 15 (04.80) 18 (04.02) 33
Not (08.33) 38 (02.47) 09 (04.27) 19 (07.45) 28 (05.73) 47
Total n=456
(100.00)
n=363 (100.00)
n=444 (100.00)
n=375 (100.00)
N=819 (100.00) Table 2 shows that a majority of the users (34.56%) are partially satisfied with the e-journals, 29.31 percent of them are fairly satisfied, 26.38 percent are fully satisfied, 5.73 percent are not at all satisfied, where as the remaining 4.02 percent are not much satisfied.
E-Newsletters
The distribution of students according to the level of satisfaction with the e-newsletters, in relation to gender and status is revealed in Table 3.
Table 3: Level of satisfaction with e-newsletters
Level of Satisfaction Male Gender Female UG Status PG Total
Fully 89
(19.52)
76 (20.94)
66 (14.87)
99 (26.40)
165 (20.14)
Fairly (23.24) 106 (30.86) 112 (24.78) 110 (28.81) 108 (26.63) 218
Partially (28.29) 129 (22.87) 83 (26.12) 116 (25.60) 96 (25.89) 212
Not much (12.29) 56 (13.49) 49 (19.36) 86 (05.06) 19 (12.82) 105
Not (16.66) 76 (11.84) 43 (14.87) 66 (14.13) 53 (14.52) 119
Total n=456
(100.00)
n=363 (100.00)
n=444 (100.00)
n=375 (100.00)
N=819 (100.00) Table 3 shows that a majority of the users (26.63%) are fairly satisfied with the e-newsletters, 25.89 percent of them are partially satisfied, 20.14 percent are fully satisfied, 14.52 percent are not at all satisfied, where as the remaining 12.82 percent are not much satisfied.
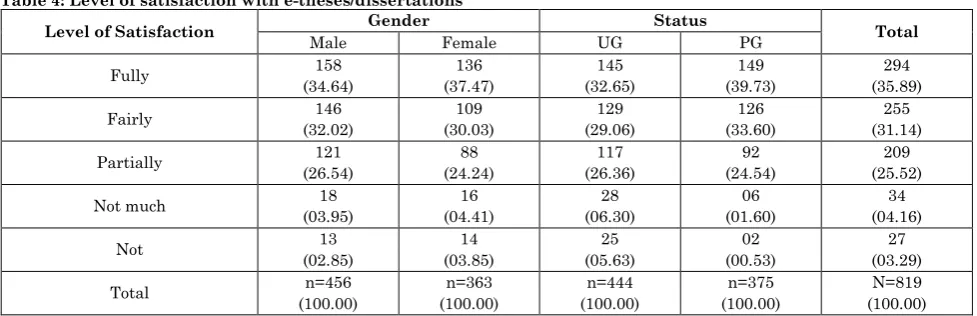
E-Theses/Dissertations
The distribution of students according to the level of satisfaction with the e-theses/dissertations, in relation to gender and status is revealed in Table 4.
Table 4: Level of satisfaction with e-theses/dissertations
Level of Satisfaction Gender Status Total
Male Female UG PG
Fully 158
(34.64)
136 (37.47)
145 (32.65)
149 (39.73)
294 (35.89)
Fairly 146
(32.02)
109 (30.03)
129 (29.06)
126 (33.60)
255 (31.14)
Partially 121
(26.54)
88 (24.24)
117 (26.36)
92 (24.54)
209 (25.52)
Not much 18
(03.95)
16 (04.41)
28 (06.30)
06 (01.60)
34 (04.16)
Not 13
(02.85)
14 (03.85)
25 (05.63)
02 (00.53)
27 (03.29)
Total n=456
(100.00)
n=363 (100.00)
n=444 (100.00)
n=375 (100.00)
Indexing Databases
The distribution of students according to the level of satisfaction with the indexing
databases, in relation to gender and status is revealed in Table 5.
Table 5: Level of satisfaction with indexing databases
Level of Satisfaction Gender Status Total
Male Female UG PG
Fully (25.66) 117 (23.69) 86 (23.43) 104 (26.40) 99 (24.79) 203
Fairly (32.68) 149 (33.34) 121 (35.59) 158 (29.87) 112 (32.96) 270
Partially (23.90) 109 (27.27) 99 (25.23) 112 (25.60) 96 (25.41) 208
Not much (08.55) 39 (07.17) 26 (05.85) 26 (10.40) 39 (07.93) 65
Not 42
(09.21)
31 (08.53)
44 (09.90)
29 (07.73)
73 (08.91)
Total (100.00) n=456 (100.00) n=363 (100.00) n=444 (100.00) n=375 (100.00) N=819
Table 5 shows that a majority of the users (32.96%) are fairly satisfied with the indexing databases, 25.41 percent of them are partially satisfied, 24.79 percent are fully satisfied, 8.91 percent are not at all satisfied, the remaining 7.93 percent are not much satisfied.
Abstracting Databases
The distribution of students according to the level of satisfaction with the abstracting
databases, in relation to gender and status is revealed in Table 6.
Table 6: Level of satisfaction with abstracting databases
Level of Satisfaction Gender Status Total
Male Female UG PG
Fully (22.81) 104 (26.99) 98 (21.63) 96 (28.27) 106 (24.66) 202
Fairly (26.55) 121 (32.24) 117 (27.71) 123 (30.67) 115 (29.08) 238
Partially (17.32) 79 (18.74) 68 (16.89) 75 (19.20) 72 (17.94) 147
Not much (12.93) 59 (09.91) 36 (13.28) 59 (09.60) 36 (11.59) 95
Not (20.39) 93 (12.12) 44 (20.49) 91 (12.26) 46 (16.73) 137
Total (100.00) n=456 (100.00) n=363 (100.00) n=444 (100.00) n=375 (100.00) N=819
Table 6 shows that a majority of the users (29.08%) are fairly satisfied with the abstracting databases, 24.66 percent of them are fully satisfied, 17.94 percent are partially satisfied, 16.73 percent are not at all satisfied, where as the remaining 11.59 percent are not much satisfied.
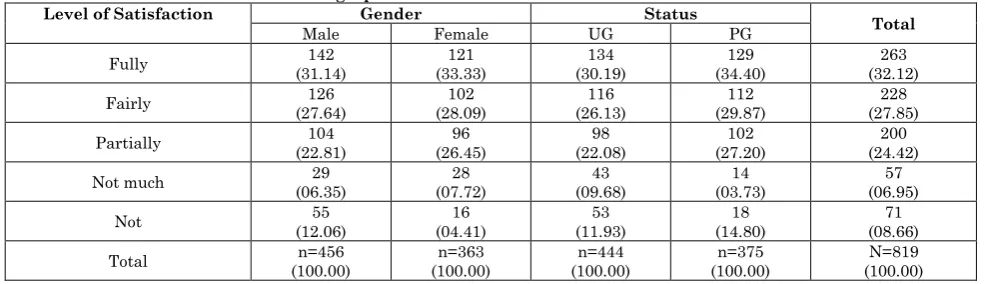
Bibliographic Databases
The distribution of students according to the level of satisfaction with the bibliographic databases, in relation to gender and status is revealed in Table 7. Table 7 shows that a
majority of the users (32.12%) are fully satisfied with the bibliographic databases, 27.85 percent of them are fairly satisfied, 24.42 percent are partially satisfied, 8.66 percent are not at all satisfied, where as the remaining 6.95 percent are not much satisfied.
Table 7: Level of satisfaction with bibliographic databases
Level of Satisfaction Gender Status Total
Male Female UG PG
Fully (31.14) 142 (33.33) 121 (30.19) 134 (34.40) 129 (32.12) 263
Fairly (27.64) 126 (28.09) 102 (26.13) 116 (29.87) 112 (27.85) 228
Partially 104
(22.81)
96 (26.45)
98 (22.08)
102 (27.20)
200 (24.42)
Not much (06.35) 29 (07.72) 28 (09.68) 43 (03.73) 14 (06.95) 57
Not 55
(12.06)
16 (04.41)
53 (11.93)
18 (14.80)
71 (08.66)
CD/DVD Databases
The distribution of students according to the level of satisfaction with the CD/DVD
databases, in relation to gender and status is revealed in Table 8.
Table 8: Level of satisfaction with CD/DVD databases
Level of Satisfaction Gender Status
Total
Male Female UG PG
Fully 382
(83.77)
274 (75.48)
374 (84.24)
282 (75.20)
656 (80.10)
Fairly (03.30) 15 (09.09) 33 (03.16) 14 (09.06) 34 (05.87) 48
Partially (07.23) 33 (10.74) 39 (05.18) 23 (13.07) 49 (08.79) 72
Not much (04.17) 19 (03.59) 13 (05.40) 24 (02.14) 08 (03.90) 32
Not (01.53) 07 (01.10) 04 (02.02) 09 (00.53) 02 (01.34) 11
Total n=456
(100.00)
n=363 (100.00)
n=444 (100.00)
n=375 (100.00)
N=819 (100.00) Table 8 shows that a majority of the users (80.10%) are fully satisfied with the CD/DVD databases, 8.79 percent of them are partially satisfied, 5.87 percent are fairly satisfied, 3.90 percent are not much satisfied, where as the remaining 1.34 percent are not at all satisfied.
E-Standards
The distribution of students according to the level of satisfaction with the e-standards, in relation to gender and status is revealed in Table 9. Table 9 shows that a majority of the
users (34.31%) are fully satisfied with the e-standards, 24.43 percent of them are fairly satisfied, 19.29 percent are partially satisfied, 14.65 percent are not at all satisfied, where as the remaining 7.32 percent are not much satisfied.
Table 9: Level of satisfaction with e-standards
Level of Satisfaction Gender Status
Total
Male Female UG PG
Fully (32.46) 148 (36.64) 133 (29.28) 130 (40.26) 151 (34.31) 281
Fairly (24.35) 111 (24.52) 89 (22.98) 102 (26.14) 98 (24.43) 200
Partially (22.37) 102 (15.43) 56 (19.37) 86 (19.20) 72 (19.29) 158
Not much 36
(07.89)
24 (06.61)
31 (06.98)
29 (07.74)
60 (07.32)
Not (12.93) 59 (16.80) 61 (21.39) 95 (06.66) 25 (14.65) 120
Total (100.00) n=456 (100.00) n=363 (100.00) n=444 (100.00) n=375 (100.00) N=819
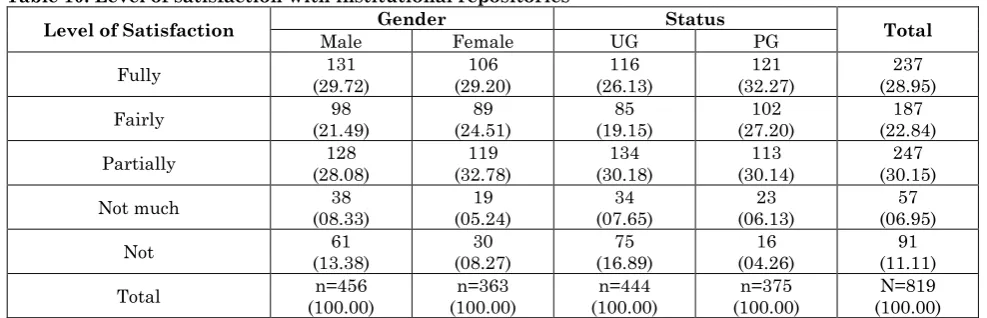
Institutional Repositories
The distribution of students according to the level of satisfaction with the institutional
repositories, in relation to gender and status is revealed in Table 10.
Table 10: Level of satisfaction with institutional repositories
Level of Satisfaction Male Gender Female UG Status PG Total
Fully 131
(29.72)
106 (29.20)
116 (26.13)
121 (32.27)
237 (28.95)
Fairly (21.49) 98 (24.51) 89 (19.15) 85 (27.20) 102 (22.84) 187
Partially (28.08) 128 (32.78) 119 (30.18) 134 (30.14) 113 (30.15) 247
Not much (08.33) 38 (05.24) 19 (07.65) 34 (06.13) 23 (06.95) 57
Not (13.38) 61 (08.27) 30 (16.89) 75 (04.26) 16 (11.11) 91
Total (100.00) n=456 (100.00) n=363 (100.00) n=444 (100.00) n=375 (100.00) N=819
AICTE Consortium
The distribution of students according to the level of satisfaction with the AICTE consortium, in relation to gender and status is revealed in Table 11.Table 11 shows that a
majority of the users (74.48%) are fully satisfied with the AICTE consortium, 10.13 percent of them are not at all satisfied, 6.59 percent are partially satisfied, 4.52 percent are fairly satisfied, where as the remaining 4.28 percent are not much satisfied.
Table 11: Level of satisfaction with AICTE consortium
Level of Satisfaction Gender Status Total
Male Female UG PG
Fully 338
(74.13)
272 (74.94)
361 (81.32)
249 (66.40)
610 (74.48)
Fairly (03.52) 16 (07.16) 21 (04.28) 19 (04.81) 18 (04.52) 37
Partially 48
(10.52)
26 (07.16)
23 (05.18)
31 (08.26)
54 (06.59)
Not much (03.50) 16 (05.23) 19 (04.72) 21 (03.73) 14 (04.28) 35
Not (08.38) 38 (06.88) 25 (04.50) 20 (16.80) 63 (10.13) 83
Total (100.00) n=456 (100.00) n=363 (100.00) n=444 (100.00) n=375 (100.00) N=819
DELNET Resources and Services
The distribution of students according to the level of satisfaction with the DELNET
resources and services, in relation to gender and status is revealed in Table 12.
Table 12: Level of satisfaction with DELNET resources and services
Level of Satisfaction Male Gender Female UG Status PG Total
Fully (60.53) 276 (61.71) 224 (59.46) 264 (62.94) 236 (61.06) 500
Fairly 42
(09.22)
29 (07.99)
39 (08.78)
32 (08.54)
71 (08.67)
Partially (12.28) 56 (10.48) 38 (10.82) 48 (12.26) 46 (11.48) 94
Not much (05.26) 24 (11.29) 41 (08.78) 39 (06.93) 26 (07.93) 65
Not (12.71) 58 (08.53) 31 (12.16) 54 (09.33) 35 (10.86) 89
Total (100.00) n=456 (100.00) n=363 (100.00) n=444 (100.00) n=375 (100.00 N=819
Table 12 shows that a majority of the users (61.06%) are fully satisfied with the DELENT resources and services, 11.48 percent of them are partially satisfied, 10.86 percent are not at all satisfied, 8.67 percent are fairly satisfied, where as the remaining 7.93 percent are not much satisfied.
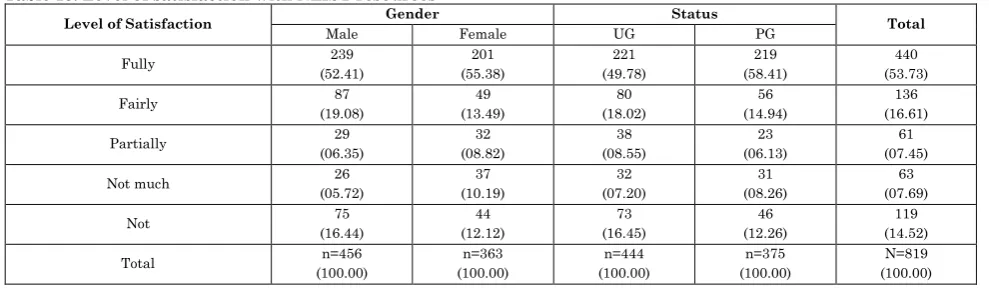
NLIST Resources
The distribution of students according to the level of satisfaction with the NLIST resources, in relation to gender and status is revealed in Table 13. Table 13 shows that a
majority of the users (53.73%) are fully satisfied with the NLIST resources, 16.61 percent of them are fairly satisfied, 14.52 percent are not at all satisfied, 7.69 percent are not much satisfied, where as the remaining 7.45 percent are partially satisfied
Table 13: Level of satisfaction with NLIST resources
Level of Satisfaction Gender Status Total
Male Female UG PG
Fully 239
(52.41)
201 (55.38)
221 (49.78)
219 (58.41)
440 (53.73)
Fairly 87
(19.08)
49 (13.49)
80 (18.02)
56 (14.94)
136 (16.61)
Partially 29
(06.35)
32 (08.82)
38 (08.55)
23 (06.13)
61 (07.45)
Not much 26
(05.72)
37 (10.19)
32 (07.20)
31 (08.26)
63 (07.69)
Not 75
(16.44)
44 (12.12)
73 (16.45)
46 (12.26)
119 (14.52)
Total n=456
(100.00)
n=363 (100.00)
n=444 (100.00)
n=375 (100.00)
NPTEL Video Lectures
The distribution of students according to the level of satisfaction with the NPTEL video
lectures, in relation to gender and status is revealed in Table 14.
Table 14: Level of satisfaction with NPTEL video lectures
Level of Satisfaction Gender Status Total
Male Female UG PG
Fully (49.57) 226 (50.69) 184 (48.19) 214 (52.27) 196 (50.06) 410
Fairly (21.71) 99 (26.45) 96 (20.94) 93 (27.21) 102 (23.81) 195
Partially (18.42) 84 (19.02) 69 (22.75) 101 (13.86) 52 (18.68) 153
Not much (04.16) 19 (02.47) 09 (06.10) 27 (01.60) 06 (03.42) 28
Not 28
(06.14)
05 (01.37)
09 (02.02)
19 (05.06)
33 (04.03)
Total n=456
(100.00) (100.00) n=363 (100.00) n=444 (100.00) n=375 (100.00) N=819 Table 14 shows that a majority of the users (50.06%) are fully satisfied with the NPTEL video lectures, 23.81 percent of them are fairly satisfied, 18.68 percent are partially satisfied, 4.03 percent are not at all satisfied, where as the remaining 3.42 percent are not much satisfied.
Testing of Hypotheses
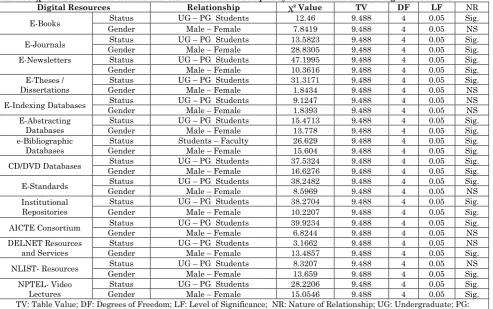
Table 15: χ² test between the Gender and status of users Vs Frequency of satisfaction level of digital resources
Digital Resources Relationship χ² Value TV DF LF NR
E-Books Status UG – PG Students 12.46 9.488 4 0.05 Sig.
Gender Male – Female 7.8419 9.488 4 0.05 NS
E-Journals Gender Status UG – PG Students Male – Female 13.5823 28.8305 9.488 9.488 4 4 0.05 0.05 Sig. Sig.
E-Newsletters Status UG – PG Students 47.1995 9.488 4 0.05 Sig.
Gender Male – Female 10.3616 9.488 4 0.05 Sig.
E-Theses /
Dissertations Gender Status UG – PG Students Male – Female 31.3171 1.8434 9.488 9.488 4 4 0.05 0.05 Sig. NS
E-Indexing Databases Gender Status UG – PG Students Male – Female 9.1247 1.8393 9.488 9.488 4 4 0.05 0.05 NS NS E-Abstracting
Databases
Status UG – PG Students 15.4713 9.488 4 0.05 Sig.
Gender Male – Female 13.778 9.488 4 0.05 Sig.
e-Bibliographic Databases
Status Students – Faculty 26.629 9.488 4 0.05 Sig.
Gender Male – Female 15.604 9.488 4 0.05 Sig.
CD/DVD Databases Gender Status UG – PG Students Male – Female 37.5324 16.6276 9.488 9.488 4 4 0.05 0.05 Sig. Sig.
E-Standards Status UG – PG Students 38.2482 9.488 4 0.05 Sig.
Gender Male – Female 8.5969 9.488 4 0.05 NS
Institutional Repositories
Status UG – PG Students 38.2704 9.488 4 0.05 Sig.
Gender Male – Female 10.2207 9.488 4 0.05 Sig.
AICTE Consortium Status UG – PG Students 39.9234 9.488 4 0.05 Sig.
Gender Male – Female 6.8244 9.488 4 0.05 NS
DELNET Resources and Services
Status UG – PG Students 3.1662 9.488 4 0.05 NS
Gender Male – Female 13.4857 9.488 4 0.05 Sig.
NLIST- Resources Status UG – PG Students 8.3207 9.488 4 0.05 NS
Gender Male – Female 13.659 9.488 4 0.05 Sig.
NPTEL- Video Lectures
Status UG – PG Students 28.2206 9.488 4 0.05 Sig.
Gender Male – Female 15.0546 9.488 4 0.05 Sig.
TV: Table Value; DF: Degrees of Freedom; LF: Level of Significance; NR: Nature of Relationship; UG: Undergraduate; PG: Postgraduate; Sig. Significance
It is evident from Table 15 that there are significant differences in the frequency level of satisfaction of various digital resources such as journals, newsletters, e-abstracting databases, e-bibliographic databases, CD/DVD databases, institutional repositories, and NPTEL video lectures between the male and female students as well as undergraduate and postgraduate students. It is proved by the χ² values, which are significant at 0.05 level with four degrees of freedom. This means that more number of
students. It is proved by the χ² values, which are significant at 0.05 levels with four degrees of freedom. This means that more number of postgraduate students is satisfied with these resources compared to the undergraduate students. However, there is no significant difference in this regard between the male and female students. Regarding to the DELNET resources and series and NLIST resources, there are significant differences in the level of satisfaction between the male and female students.
It is proved by the χ² values, which are significant at 0.05 levels with four degrees of freedom. This means that more number of female students is satisfied with these resources compared to the male students. However, there is no significant difference in this regard between the undergraduate and postgraduate students [1-4].
Conclusions and Suggestions
The following are the conclusions obtained from the analysis of data collected from users of engineering colleges in Kadapa district of Andhra Pradesh.
The users are more satisfied with the CD/DVD databases as compared to other digital resources and services. It is followed by AICTE Consortium, NPTEL Video lectures, DELNET resources and services, e-theses/dissertations, which have got second, third, fourth and fifth ranks respectively for their satisfaction levels. Institutional repositories and e-journals are
the least ranked among digital resources for lowest satisfaction level.
There are significant differences in the frequency level of satisfaction of various digital resources such as e-journals, newsletters, abstracting databases, e-bibliographic databases, CD/DVD databases, institutional repositories, and NPTEL video lectures between the male
and female students as well as undergraduate and postgraduate students. More number of female students and postgraduate students are satisfied with these resources compared to the male and undergraduate students respectively.
There is no significant difference in the level of satisfaction of e-indexing databases between the male and female students as well as undergraduate and postgraduate students.
Regarding to the e-books, e-theses/dissertations, and AICTE consortium, more number of postgraduate students is satisfied compared to the undergraduate students as indicated by the chi-square value which is significant at 0.05 level with four degrees of freedom. There is no significant difference in this regard between the undergraduate and postgraduate students.
Regarding to the DELNET resources and series and NLIST resources, more number of female students is satisfied compared to the male students. There is no significant difference in this regard between the undergraduate and postgraduate students. The budget for the purchase of digital
resources should be enhanced in proportion to the rising cost of online resources and databases as well as to meet the increasing demands of the reading community.
The existing financial resources for purchase of digital resources and online databases are to be utilized in a scientific way based on the needs of the reading community.
In order to determine the effectiveness of digital resources and services in catering to the information requirement of users, libraries must organize regular evaluations and assessments.
References
1. Kusuma Kumari K, Doraswamy M (2019) Users Perception on Library Printed Resources: A Survey on NAAC Accredited Degree Colleges in Vijayawada City. International Journal of Research and Analytical Reviews (IJRAR), 6(2):592-299.
3. Subramanyam G, Doraswamy M (2017) A Study on Usage Level of Digital Resources and Services in University Engineering College Libraries in Rayalaseema Region of Andhra Pradesh. IJRAR- International Journal of Research and Analytical Reviews, 4(4): 97-103.