Abstract—I/O workload is a critical and important factor to analyze I/O pattern and file system performance. However tracing I/O operations on the fly distributed parallel file system is non-trivial due to collection overhead and a large volume of data. In this paper, we design and implement a parallel file system logging method for high performance computing using shared memory-based multi-layer scheme. It minimizes the overhead with reduced logging operation response time and provides efficient post-processing scheme through shared memory. Separated logging server can collect sequential logs from multiple clients in a cluster through packet communication. Implementation and evaluation result shows low overhead and high scalability of this architecture for high performance parallel logging analysis.
Keywords—I/O workload, PVFS, I/O Trace. I. INTRODUCTION
VER the past few decades a large number of studies have been made on file system traces to analyze I/O pattern and file system performance[1,2,3]. Through tracing file system operation and analyzing the trace data, we can get insight into the file system behavior.
The result of file system traces has been used for a wide variety of purposes: First, researches of file system traces have been used for file system performance [4]. By tracing file system and analyzing the trace data, we can identify the bottleneck point of file system. It is helpful to improve the file system performance. Monitoring file system operation is need for optimize of file system performance. Second, file system traces is helpful for file system debugging. In the process of file system development, file system tracing is the one of important factors. It can works for verification of each I/O operation and detecting the problems. Third, file system traces are utilized to analyze I/O workload of file system. To maximize performance using the limited resource, file system managers trace file system and analyze I/O workload and optimize file system based on the I/O workload data. In addition, the I/O workload data is one of important factors for the design of new file system. Finally, file system traces is useful for analyzing the access pattern of user application. For example, we can trace the I/O operation of MPI program and analyze access pattern of MPI
The authors are with the Supercomputing Center, Korea Institute of Science and Technology Information (KISTI), Korea (e-mail: [email protected]).
I/O program [5,6,7]. From the result we can optimize the MPI Program for high performance.
According to those purposes of I/O trace, the location of tracing is different. Our goal is a trace system for I/O workload analysis among the previous four purposes.
Even though I/O workload is significant for this variety of purposes, it is difficult to get I/O trace data on the fly system of the real world, because of collection overhead and a large volume of data. Especially, file system traces on a live distributed parallel file system such as PVFS [8], Luster[9], GPFS[10], for data-intensive high-end applications is non-trivial due to the following reason. First, the distributed file system organized physically many number of different systems like Fig. 1. Second, it generates a huge amount of data, since parallel and distributed file systems are used for data-intensive high-end applications. Third, the file system trace should not affect its performance.
In this paper we preset the design and implementation of a shared memory based parallel file system logging method called MIOT (Multi-layer I/O Tracer), which collects I/O operations of PVFS [8]. Through performance evaluation, we show the proprieties of the proposed approach.
The contributions of this work are:
Low overhead logging system architecture with reduced logging operation response time
Efficient post-processing scheme using shared memory
Extension to be multiple system logging system using remote log server through socket communication The rest of this paper is organized as follows. We reviewed and discussed existing tracing tools in Section II. In Section III, we describe the architecture of MIOT, which collects I/O operation data on distributed file system environment using shared memory. We show the performance evaluation in Section IV. In Section V, a short conclusion and future works are given.
II. RELATED WORKS
There have been many studies on tracing file system for each different purpose, such as analysis and optimization of I/O access pattern or file system debugging [1, 2, 3]. Most of previous studies obtained data by tracing at system call level or virtual file system [11, 12]. Roselli [2] collect and analyze the result of file system tracing from a variety of different
Design and Implementation of Shared Memory
based Parallel File System Logging Method for
High Performance Computing
Hyeyoung Cho, Sungho Kim, and SangDong Lee
environment, including both UNIX and NT systems. He traces data by invoking a trace function after system call at UNIX system and a tool at Window NT traces. In 2004, Tracefs [13] tries to decrease overhead through buffering. However, these approaches were designed for local file system. In addition, because the traces located on system call or virtual file system layer, it cannot trace the I/O workload of parallel applications such as MPI-IO applications [6,7]. MPI-IO is generally used in high performance computing environment, since it allows for rich descriptions of the I/O patterns for scientific application.
Recently, several papers have been devoted to the study of file system traces on distributed file system for I/O intensive parallel applications. DFSTrace [14] is a system to collect and analyze file system activities in a distributed UNIX workstation environment. However it traces on system call level or virtual level which cannot collect MPI-IO application. Other approach is passive network monitoring. Passive tracing is performed by placing a monitoring system like tcpdump [15] on the network that snoops all NFS or CIFS traffic [16, 17,18]. However passive tracing should handle a very large volume of data, because passive tracing monitors all network packets.
III. PARALLEL VIRTUAL FILE SYSTEM
Parallel Virtual File System (PVFS) developed at Clemson University and Argonne National Laboratory is an open source parallel file system under the GPL and used on clusters based on Linux systems. PVFS is designed to provide high performance for parallel applications, where concurrent, large I/O and many file access are common. PVFS provides dynamic distribution of I/O and metadata. PVFS stripes file data across multiple disks in different nodes in a cluster. By spreading out file data, larger files can be created, potential bandwidth is increased, and network bottlenecks are minimized [8].
Fig. 1 Structure of PVFS
Fig. 1 shows the structure of PVFS. One node in a cluster can play a number of roles in the PVFS system. A node can be one or more of three different types: meta server, I/O server or compute node. Meta server have two responsibilities: validating permission to access files and maintaining metadata on PVFS files. Applications running on compute nodes communicate with the meta server when performing activities such as listing directory contents, opening files and removing files for metadata processing. I/O server used for accessing PVFS file data and correlating data transfer. Direct connections are established between applications and I/O servers to directly
exchange data during read and write operations. Compute nodes support the interface accessing PVFS. The library of calls is used by applications running on compute nodes, or client nodes, in order to communicate with both meta server and the I/O server. Typically, a single node will serve as a meta server, while a group of the nodes will be compute nodes and another group will serve as I/O server. It is also possible to use all nodes as both I/O and compute nodes [19].
IV. THE DESIGN AND IMPLEMENTATION
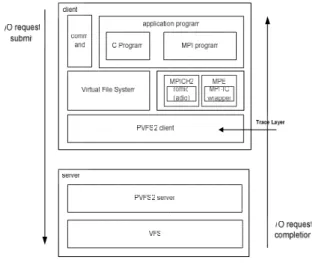
Fig. 2 illustrates the PVFS I/O operation path. There are several options for accessing PVFS on a client node. First, there is a shared, or static, library that can be used to interact with the file system using its native interface. However, applications should be written by using specific functions such as pvfs_open and pvfs_write. Another option is to use Virtual File System (VFS) interface. Loading PVFS kernel module allows users to mount PVFS just like any other traditional file system. A final option is to use MPI-IO interface, which is a part of the MPI-2 standard for message passing in parallel applications. MPI-IO interface for PVFS is provided through the ROMIO MPI-IO implementation [7, 19].
Fig. 2 PVFS I/O operation path
There are different layers which are possible locations for I/O traces on the architecture of PVFS. According to the purpose of trace, the location of tracer is different. In the case of tracing on virtual file system layer, it can get the I/O request data of programs using POSIX interface, such as C programming applications and command line operations, but it can not detect I/O request of MPI program. In the case of tracing on MPICH2 library layer, it does not include the tracing data of programs using POSIX interface. In the case of tracing on PVFS2 server, the tracing time is not accurate and it can not get accurate data for I/O workload, since the data was already reflected by file system policy, such as distribution size.
We traced I/O requests at PVFS client layers, since our purpose of trace is overall I/O workload analysis for distributed file system. It can get I/O workload data including both requests
of programs using POSIX interface and requests of MPI applications.
Fig. 3 shows the logging process of both PVFS and MIOT. The logging process of PVFS is divided into three steps. First step is initialization and assignment of a data structure which will be traced. Second step is log formatting to express tracing data as human recognizable strings such sprintf() or vsprintf(). Third step is log writing on a local file system. These schemes are quite simple and easy to implement but have lots of overheads in terms of response time.
To minimize the overhead, we designed MIOT using shard memory like (b) in Fig. 3. In Fig. 4 we described detail logging flow of MIOT. PVFS client copies the log data to shared memory and returns to PVFS service process immediately and can restart next processing for I/O request. Therefore this structure can reduce overheads of those two steps, and finally minimize response time of file operation.
log data setup log format log data write pvfs service process I/ O request pvfs service process logging service process logging request return delay time
(a) PVFS gossip_debug() logging process
(b) MIOT SHMPut() logging process
Fig. 3 logging process of PVFS and MIOT
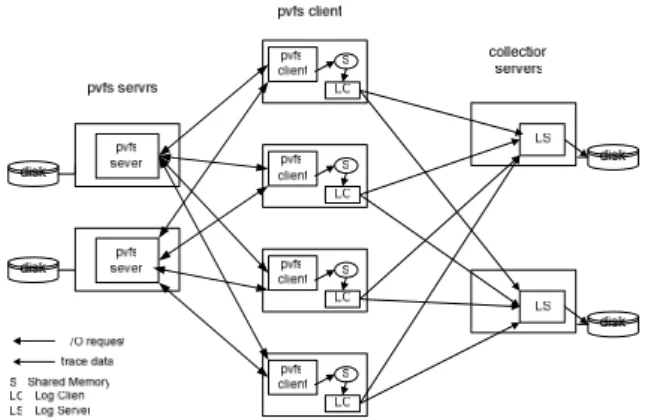
Fig. 5 shows the overall architecture of MIOT. In other to trace and collect I/O operations of distributed and parallel file system, we designed MIOT by three-tire architecture: PVFS client, Log Client(LC), Log Server(LS). PVFS client copies a log data to a shared memory. The shared memory is implemented as circular buffer structure. The size of circular buffer is configured as 20000. LC monitors the shard memory and sends the log data to LS by periods. LS can receive the log data using socket and store it to local file system.
Fig. 4 Logging flow of MIOT
Fig. 5 Architecture of MIOT
The separated logging server can collect sequential logs from multiple clients in a cluster through packet communication. This structure of MIOT can minimize response time of PVFS service through the overhead process transfers to external process on remote system.
V. PERFORMANCE EVALUATION
To evaluate our approach, we measured cost of PVFS and MIOT log process. Table I presents the overhead of logging methods. To achieve high accuracy, we use Intel Pentium’s rdtsc(x86 Read Time-Stamp Counter, RDTSC) instruction. The RDTSC instruction reads the processor’s 64-bit cycle counter and stores its value in a register. The overhead of RDTSC is very small, when it is compared with the overhead of gettimeofday(). Therefore it used for more accurate and detailed performance tests, such as overhead measurement of system call function[20,21]. These results were obtained by executing each logging methods more than 10,000 times. The measurement is tested on the Intel Xeon 2.00GHz.
TABLEI
RESPONSE TIME OF LOGGING PROCESS
System Total (cycles) log format (cycles) log write (cycles) SHM copy (cycles) PVFS log 16089 14373 (89.33%) 1716 (10.65%) - MIOT 293 - - 293 (100%) Response time of logging system described in Table I. The result indicates that overhead of MIOT log process decreased more than
54
times compared with overhead of PVFS log process.For analyzing overall client overhead, we measured the CPU utilization. Fig. 6 shows CPU utilization when MIOT and IOR benchmark with 128MB file size and changing data transfer size was run. The result shows that the average of CPU utilization was 1.27%. It means since MIOT is low overhead architecture, it can be useful as an I/O tracer for high performance parallel logging analysis.
To test overall performance of MIOT in scalable environment, we used 8 nodes small cluster system like Table II. Each node has two Intel Xeon processors and all nodes are connected via gigabit Ethernet. PVFS 2.6.1 is installed with
MIOT. Since our testbed is a small scale cluster system, we configured PVFS with 4 I/O servers and 1 meta server. To measure I/O performance, we used IOzone, which generates and measures a variety of file operations[22].
0% 10% 20% 30% 40% 50% 60% 70% 80% 90% 100% utilization(%) 1 6 11 16 21 26 31 36 41 46 51 56 61 66 71 76 81 time(sec) CPU utilization idle system user average idle : 98.73% use : 0.138 system : 1.096
Fig. 6 CPU utilization
TABLEII
CONFIGURATION OF TESTBED
OS Linux 2.6.18
PVFS PVFS 2.6.1
CPU Intel Xeon 2.00GHz
Memory 2GB
HDD 40GB SCSI
Network Gigabit Ethernet
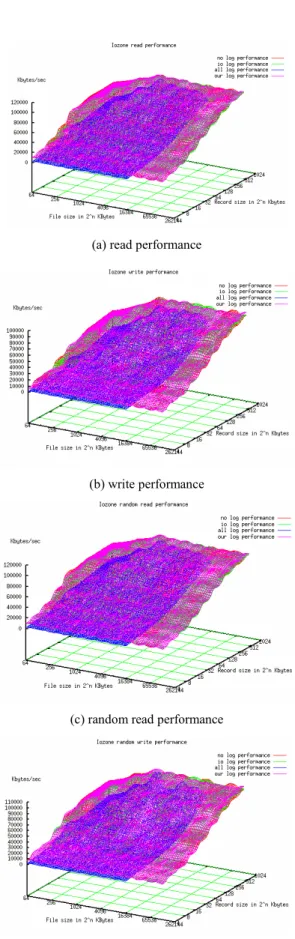
Fig. 7 shows performance results of IOzone benchmark. The most of PVFS performance include MIOT is similar with PVFS performance without logging. The average of MIOT overhead was 0.92-1.81% while the average of io log overhead was 1.18-5.01%. In the case of performance include all log option; it can not get the result at more than 16 megabyte of file, since the overhead is too big. The average of overhead was 46.99 -48.21%. Even though the test is run on a small size cluster system, the results shows architecture of MIOT is low overhead and MIOT can support the scalability of PVFS.
VI. CONCLUSION AND FUTURE WORK
In this paper, we design and implement a parallel file system logging method for high performance computing using shared memory-based multi-layer scheme. It minimizes overhead with reduced logging operation response time and provides efficient post-processing scheme through shared memory. Through external processing on remote servers, we decrease logging overhead. Our implementation and evaluation result shows low overhead and high scalability of this architecture for high performance parallel logging analysis.
In the future, we will collect using this I/O tracing method on a distributed file system and analyze I/O workload of high performance computing application. Through the analysis, we will recognize the characteristic of both user I/O pattern and overall system. In addition, the results of analysis will be used as a feedback for file system management and optimization.
(a) read performance
(b) write performance
(c) random read performance
(d) random write performance
REFERENCES
[1] John K. Ousterhout, Hervg Da Costa, David Harrison, John A. Kunze, Mike Kupfer, and James G. Thompson, “ A Trace-Driven Analysis of the UNIX 4.2 BSD File System,” ACM SIGOPS Operating Systems Review archive, Volume 19, Issue 5, pp. 15~24, 1985.
[2] Drew Roselli, Jacob R. Lorch, and Thomas E. Anderson, "A comparison of file system workloads," Proc. of USENIX Annual Technical Conference, pp. 41~54, 2000.
[3] Akshat Aranya, Charles P. Wright, and Erez Zadok, “Tracefs: A File System to Trace Them All,” FAST 2004.
[4] Pin Lu and Kai Shen, “Multi-Layer Event Trace Analysis for Parallel I/O Performance Tuning,” Proceedings of the 2007 International Conference on Parallel Processing, 2007.
[5] Anthony Chan, William Gropp, and Ewing Lusk, “User’s Guide for MPE: Extensions for MPI Programs”, from MPICH2 web site, http://www.mcs.anl.gov/research/projects/mpich2
[6] MPICH2 web site, http://www.mcs.anl.gov /research/projects/mpich2 [7] Rajeev Thakur, William Gropp, Ewing Lusk, “On Implementing MPI-IO
Portably and with High Performance,” In Proceedings of the 6th Workshop on I/O in Parallel and Distributed Systems, pp. 23-32, 1999. [8] PVFS web size, http://www.pvfs.org
[9] Lustre web site, http://wiki.lustre.org
[10] GPFS Wikipedia, http://en.wikipedia.org/wiki/GPFS
[11] Chris Ruemmler and John Wilkes, “A trace-driven analysis of disk working set sizes”, Technical Report HPL-OSR-93-23, Hewlett- Packard Laboratories, April 1993.
[12] sourceforge starce home page, http://sourceforge.net/projects/strace/ [13] Akshat Aranya, Charles P. Wright, Erez Zadok, “Tracefs: A File System
to Trace Them All,” Proceedings of the 3rd USENIX Conference on File and Storage Technologies, pp. 129 – 145, 2004.
[14] L. Mummert, M. Satyanarayanan, “Long term distributed file reference tracing: Implementation and experience,” Software—Practice & Experience, Volume 26, Issue 6, pp. 705-736, 1996.
[15] tcpdump/libcap homepage, http://www.tcpdump.org/
[16] M. Blaze, “NFS Tracing by Passive Network Monitoring, ” In Proceedings of the USENIX Winter Conference, January 1992. [17] D. Ellard, J. Ledlie, P. Malkani, and M. Seltzer. Passive NFS Tracing of
Email and Research Workloads. In Proceedings of the Annual USENIX Conference on File and Storage Technologies, March 2003.
[18] Andrew W. Leung, Shankar Pasupathy, Garth Goodson, Ethan L. Miller “Measurement and Analysis of Large-Scale Network File System Workloads,” In the proceedings of the 2008 USENIX Annual Technical Conference, June 2008.
[19] Ibrahim F. Haddad inSysAdmin, “PVFS: A Parallel Virtual File System for Linux Cluster,” Linux Journal, 2000.
[20] Mohan Rajagopalan, Matti Hiltunen, Trevor Jim, and Richard Schlichting, “Authenticated System Calls,” DSN–2005: The International Conference on `Dependable Systems and Networks, June 2005.
[21] Intel web site, http://software.intel.com/en-us/forums/watercooler- catchall /topic/54276
[22] iozone web site, http://www.iozone.org/
Hyeyoung Cho received the M.E. degree in computer engineering from the Information and Communications University, Daejeon, Korea in 2004. She is currently a researcher of the Supercomputing Center of Korea Institute of Science and Technology Information. Her interests include cluster system, distributed and parallel file system, and embedded system. She is a member of the Korea Information Science Society.
Sungho Kim received the Ph.D. degree in aerospace engineering from Korea Advanced Institute of Science and Technology, Daejeon, Korea in 1999. He is currently a chief researcher of the Supercomputing Center of Korea Institute of Science and Technology Information, Daejeon, Korea. He performed many national projects related to cluster computer architecture, system software and grid technology. He is now one of the key members to design 4th
supercomputer of KISTI Supercomputing Center and other related projects. His research interests include cluster computing and embedded computing.
SangDong Lee received the Ph.D. degree in physics from Pusan National University, Korea in 2000. He is currently a chief researcher of the Supercomputing Center of Korea Institute of Science and Technology Information, Daejeon, Korea. He performed many national projects related to supercomputer and high performance computing applications. He is now one of the key members to design and manage 4th supercomputer of KISTI Supercomputing Center and other related projects. His research interests include e-science and grid computing and cluster computing.