MJCCA9 – 659 ISSN 1857-5552 e-ISSN 1857-5625
Received: December 8, 2014 UDC: 548.73
Accepted: December 31, 2015 Review
QUANTITATIVE PHASE ANALYSIS BY X-RAY DIFFRACTION – SIMPLE ROUTES
Stanko Popović
Croatian Academy of Sciences and Arts, Croatia
Physics Department, Faculty of Science, University of Zagreb, Croatia [email protected]
The elemental composition of a multiphase material can be obtained by means of chemical and spectroscopic techniques. However, these techniques face a great difficulty in distinguishing the chemical identity of the phases present in the material and in derivation of the fractions of particular phases. X-ray powder diffraction seems to be an ideal technique for the analysis of a multiphase material. Each crystal-line phase of the material gives its characteristic diffraction pattern independently of the other phases; this fact makes it possible to identify the phase of interest and to determine its fraction. The intensities of dif-fraction lines of a given phase are proportional to its dif-fraction and an appropriate quantitative analysis can be performed after the application of the correction for the absorption of X-rays in the material.
The principles of quantitative X-ray diffraction phase analysis of a multiphase material are
pre-sented, with a special attention paid to the doping methods. The following methods are described: (i)
de-termination of the fraction of a phase using repeated dopings, (ii) dede-termination of the fraction of a phase using a single doping, (iii) simultaneous determination of the fractions of several phases using a single doping; (iv) determination of the fraction of the dominant phase. The applicability of the doping methods is stated and the optimum conditions to minimize systematic errors are discussed. Recent approaches in quantitative X-ray diffraction phase analysis are also mentioned in short.
Keywords: X-ray powder diffraction; quantitative phase analysis; doping methods
КВАНТИТАТИВНА ФАЗНА АНАЛИЗА СО ПОМОШ НА РЕНДГЕНСКА ДИФРАКЦИЈА – ЕДНОСТАВНИ ПАТИШТА
Хемискиот состав на мултифазен материјал може да се определи со помош на хемиски и спектроскопски техники. Меѓутоа, при користење на овие техники се појавуваат големи тешкотии на патот на дефинирање на хемискиот идентитет на присутните фази во материјалот, како и при определувањето на фракциите на одредените фази. Рендгенската дифракција на спрашени обрасци е една од идеалните техники за анализа на мултифазни материјали. Секоја од кристалните фази во материјалот дава нејзини карактеристични дифракциони максимуми, независно од другите фази. Тоа овозможува да се определат присутните фази, како и нивните фракции. Интензитетите на дифракционите линии на определена фаза се пропорционални со нејзината фракција, што овозможува да се направи квантитативна анализа по примена на корекција на апсорпцијата на рендгенските зраци во материјалот.
Презентирани се принципите на квантитативната фазна анализа на мултифазен материјал со помош на рендгенска дифракција, при што посебно внимание е обрнато на методот на додатоци. Опишани се следните методи: (i) определување на фазна фракција користејќи повторени додавања, (ii) определување на фазна фракција користејќи едно додавање, (iii) симултано определување на фазни фракции користејќи едно додавање и (iv) определување на фракција на доминантната фаза. Наведена е применливоста на методот на додатоци и дискутирани се опти-малните услови за минимизирање на систематските грешки. Накратко е наведен и неодамнешниот развој на квантитативната фазна анализа со помош на рендгенска дифракција.
Клучни зборови: рендгенска дифракција на спрашени обрасци; квантитативна фазна анализа; метод на додатоци
1. INTRODUCTION
Quantitative phase analysis of a multiphase system on the basis of its diffraction pattern has been a subject of interest from the very beginning of X-ray diffraction. All simple methods for identi-fication of particular phases in the system and de-termination of their fractions are based on the prin-ciples postulated by Alexander & Klug [1] and Klug & Alexander [2]. Let a system consist of several phases denoted with capital letters and let the same notation represent their (mass, weight, molar) fractions, i.e.
A + B + C + . . . + X + Y + . . . = 1. (1)
The integrated intensity of a selected diffrac-tion line of a phase, say A, is related to its fraction:
IA= KA A/(dA
where dA is the density of the phase A, is the
mass absorption coefficient of the system, and KA
is a factor depending on the nature of the phase A, on the selected diffraction line and the geometry of the diffractometer. For pure phase A, since A = 1, (2) changes into
IA0= KA /(dAA
whereA is the mass absorption coefficient of the
phase A. From (2) and (3) it follows:
IA/IA0 = A (A/). (4)
The absorption coefficients are not known accurately. Therefore, it is obvious from (4) that the fraction A cannot be obtained simply by measuring the ratio IA/IA0, i.e. by a direct comparison of the
diffraction pattern of the system containing the phase A with the pattern of pure phase A.
Analogously to (4), for another phase, say B, it follows:
IB/IB0 = B (B/). (5)
From (4) and (5) one obtains
A/B = KAB (IA/IB), (6)
where
KAB = (B/A)(IB0/IA0).
KAB is a constant for the two phases which
are considered (in this case A and B), for the se-lected diffraction lines and for the diffractometer which is used.
A direct application of (6) is not straightfor-ward, since the absorption coefficients are not ac-curately known. In order to circumvent this prob-lem, semi-empirical internal standard methods may be used. For each phase, say A, the fraction of which is to be determined, a calibration curve is constructed in such a way as to relate A/S vs. IA/IS ,
where S denotes the internal standard. According to (6), the calibration curve is a straight line having the slope KAS. The slope is obtained from the
inten-sity measurement of a series of mixtures with known ratios A/S. In order to find the fraction of the phase A in the system, a known fraction of the standard S is added to the system, the intensity ratio IA/IS is measured and A is found from the
previously constructed calibration curve. More details on the internal standard method, as applied in special cases, can be found in the textbook of Klug & Alexander [2].
In the method developed by Chung [3, 4] no calibration curve is needed, as the absorption coef-ficients are flushed out of the intensity–fraction equation. The method is based on a previous knowledge, or measurement, of relative (reference) intensities of (the strongest) diffraction lines for each pair of phases that are present in the system, or rather for each phase and a reference phase (co-rundum, -Al2O3). All information related to the
quantitative composition of the system can be de-coded directly from its diffraction pattern.
2. THE DOPING METHODS
The doping methods involve the addition, to the original system, of known amount(s) of the phase(s), the fraction of which is (are) to be deter-mined. The corresponding equations, deduced with no approximation, relate the fraction of the phase to be determined to the intensities diffracted by that phase and by any non-added phase which is present in the system, before and after doping. The intensity–fraction equations are free of the absorp-tion coefficients. The methods can be applied to a system containing unidentified phase(s), in simul-taneous analysis only for the phases of interest, and in determination of the fraction of the amorphous content. Four doping methods are described in the following sections.
(i) Determination of the fraction of a phase using repeated dopings
say B, which is considered as the reference phase. The fraction A' of the phase A is added to the system. The fraction of this phase in the doped system is now (A + A')/(1 + A') and the fraction of the reference phase is B/(1 + A'). In this case, it follows from (6):
KAB (IA/IB)' = (A + A')/B,
or, (IA/IB)' = (constant) (A + A'), (7)
the prime indicating the intensities measured after doping. The plot of (IA/IB)' as a function of A' is a
straight line; the fraction sought, A, is the absolute value of the A'-axis intercept. In order to increase the accuracy, several pairs of diffraction lines of A and B can be used.
(ii) Determination of the fraction of a phase using a single doping
In order to avoid several consecutive dop-ings, Bezjak & Jelenić [6] have shown that the fraction of any phase, say A, can be determined using a single doping and from only two diffrac-tion patterns. Namely, from (6) and (7) it follows:
(IA/IB)' = [(A + A')/A](IA/IB). (8)
The equation (8) relates the intensities of dif-fraction lines of the sample doped with a known fraction, A', of the phase of interest, and the intensi-ties of diffraction lines of the original sample. B is any other phase already present in the system. That is a straight line, and its slope, (A + A')/A, deter-mined from experimental data for all possible inten-sity ratios, yields the initial fraction of the phase A.
(iii) Simultaneous determination of the fractions of several phases using a single doping
It has been shown by Popović et al. that the fractions of several phases can be simultaneously determined from only two diffraction patterns: the pattern of the original sample and the pattern of the sample doped with known fractions of all phases of interest [7, 8, 9]. The two patterns are to be taken under the same experimental conditions. In princi-ple, the fractions of all phases in the system can be determined, if known fractions of all phases except one are added. The equations shown below are obtained using the relation that the sum of all frac-tions after doping also equals 1, instead of 1 + A', as in the methods (i) and (ii). The method is de-scribed for a binary system, for a ternary system with one phase or two phases added, and for a general multiphase system.
Binary system
Original sample [equations (1) and (6)]:
A + B = 1, (9)
A/B = KAB (IA/IB). (6)
If one wants to determine the fraction of the phase B, a known fraction of that phase, Ba, is
add-ed to the original sample. Then A is used as the reference phase.
Doped sample:
Ad+ Bd + Ba = 1, (10)
Ad/(Bd + Ba)= KAB (IA d/IB d+a). (11)
Ad and Bd +Ba are the fractions of the phases
in the doped sample, and IA dand IB d+a are the
cor-responding intensities. The following is also valid:
Ad/Bd = A/B. (12)
There are five equations (9, 6, 10–12) for five unknowns, A, B, Ad, Bd and KAB. It follows that
the fractions of the phases are:
B = BaRAB/(P – P RAB), A = 1 – B, (13)
where
RAB = (IA d/IB d+a)(IB/IA), P = 1 – Ba. (14)
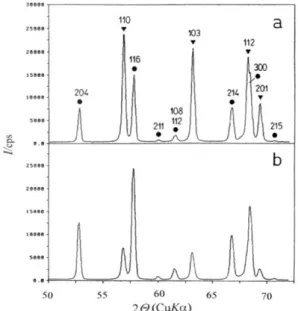
P is the parameter which equals 1 – the frac-tion of the added phase in the doped sample, or, the fraction of the original composition in the doped sample. An example of the method is shown in Figure 1.
Ternary system
(a) The fraction of one phase, say B, is to be found.
Original sample: In addition to (6) one has:
A + B + C = 1, (15)
C/B = KCB (IC/IB). (16)
A known fraction, Ba, of the phase B is
add-ed to the original sample. Then, either A or C may be used as the reference phase.
Doped sample: Besides (11) and (12), the following is valid:
Ad+ Bd + Ba + Cd = 1, (17)
Cd/(Bd + Ba) = KCB (IC d/IB d+a), (18)
Cd/Bd = C/B. (19)
It can be shown that, out of eight equations (15, 6, 16, 17, 11, 18, 12, 19), there are only seven independent equations for eight unknowns, A, B, C, Ad, Bd, Cd, KAB and KCB. This means that only
the fraction of the added phase, B, can be deter-mined. If B is related to either A or C, as the refer-ence phase, it follows that there are five equations for five unknowns. The problem can be, therefore, treated in terms of a binary system. If B is related to A, one obtains that B is given by (13), with RAB
defined by (14). If B is related to C, it follows:
B = BaRCB/(P – P RCB), RCB = (IC d/IB d+a)(IB/IC).
In both cases P = 1 – Ba. It is obvious that
RAB = RCB.
(b) The fractions of all three phases are to be found. In this case, known fractions of two phases, say, B and C, are added to the original sample. Then A is used as the reference phase.
Original sample: In addition to (15) and (6) one has
A/C = KAC (IA/IC). (20)
Doped sample: The fractions Ba and Caare
added to the original sample. Besides (11) and (12) the following is valid:
Ad+ Bd + Ba + Cd + Ca = 1, (21)
Ad/(Cd + Ca)= KAC (IA d/IC d+a), (22)
Ad/Cd = A/C. (23)
There are eight independent equations (15, 6, 20, 21, 11, 22, 12, 23) for eight unknowns, A, B, C,
Ad, Bd, Cd, KAB and KAC. It can be shown that in this
case the fractions of the phases are given as follows:
B = BaRAB/(P – P RAB), C = CaRAC/(P – P RAC),
A = 1 – (B + C).
The parameter P equals, as previously, the fraction of the original composition in the doped sample,
P = 1 – (Ba + Ca),
while RAB and RAC contain intensities of the added
phases, B and C, and the intensities of the non-added phase, A, before and after doping:
RAB = (IA d/IB d+a)(IB/IA), RAC = (IA d/IC d+a)(IC/IA).
Multiphase system
The essential points of the doping method can be summarized as follows. Let the system con-sist of N phases. Its diffraction pattern is taken and a partial or complete identification of the phases is performed. The prominent, non-overlapping (in principle the strongest) diffraction lines of particular phases are chosen and their net integrated intensities are measured. Then the system is doped by known fractions of M phases, the original fractions of which are to be determined (M = 1, 2, 3, ... N– 1). The intensities of the chosen diffraction lines are measured again. In principle, if N – 1 phases are added, the original fractions of all N phases can be found. The fraction of any phase, say X, in the original sample is given by equation
X = XaRYX/(P – P RYX). (24)
Here Xa is the fraction of the added phase X in
the doped sample, and Y is any non-added (refer-ence) phase. P equals the fraction of the original composition in the doped sample, or, 1 – the total fraction of all the added phases in the doped sample. RYX is expressed through the intensities of the phases
X and Y before (IX, IY) and after (IX d+a, IY d) doping:
RYX = (IY d/IX d+a)(IX/IY). (25)
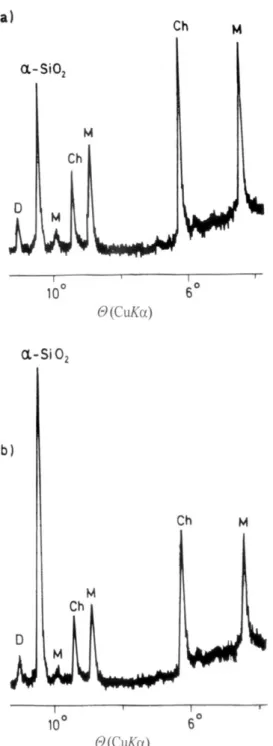
An example of the method is shown in Fig-ure 2.
One can utilize several pairs of diffraction lines of the phases X and Y in order to increase the accuracy of the measurement. Namely, from (24) and (25) it follows:
Fig. 2. X-ray diffraction patterns of industrial dust, method (iii), determination of the fraction of quartz, -SiO2 (X): (a) original sample, (b) the sample doped with Xa = 0.286.
The fraction of quartz in the original sample: X = 0.200(10). Other phases: Ch, chlorites; D, dolomite; M, micas.
Radiation CuK[9]
A plot of IX d+a/IY d as a function of (IX/IY) is
a straight line with the slope
K = (X P + Xa) /(X P),
from which it follows that the fraction of the phase of interest is given by
X = Xa /(PK –P). (26)
(iv) Determination of the fraction of the dominant phase
A specific case of the doping method is proposed in which the fraction of the dominant crystalline phase in a multiphase system can be determined by measurement of diffraction line intensities of only that phase [8, 9]. Let the system contain a phase, say X, which is dominant, and let diffraction lines of other phases be weak. The dop-ing method (iii) may not be appropriate in such a case, as diffraction lines of the phase used as the reference phase will be even weaker after doping. In this case, the following procedure may be ap-plied. The diffraction pattern of the original sample is taken (1st pattern) and the intensity of a prominent non-overlapping (in principle the strongest) dif-fraction line of the phase X is measured (IX). Then
the sample is doped by a known fraction, Xa, of the
phase X. The diffraction pattern of the doped sam-ple is taken (2nd pattern), and the intensity of the chosen diffraction line of the phase X is measured again (IX d+a). Finally, the diffraction pattern of the
pure phase X is taken (3rd pattern) and the intensity of the same diffraction line is measured once more (IX0). It is important that all three diffraction
pat-terns are taken under the same conditions. The fraction of the phase X in the original sample is given by equation
X = (Xa/P) (R1/R2), (27)
where
R1 = 1 – (IX d+a / IX0), R2 = (IX d+a / IX) – 1, (28)
and P is the fraction of the original composition in the doped sample,
P = Ad+ Bd+ Cd+
. . .
+ Xd + Yd +
. . .
= 1 – Xa .
Several diffraction lines of the phase X can be used in order to increase the accuracy. Howev-er, this method is not applicable in a case where X is close to 1, as R1 and R2 then tend to zero and the
value obtained for X may not be reliable.
3. COMMENTS
The analysis of the described methods (iii) and (iv) shows that it is advisable to choose Xa
close to 0.5 in order to achieve a better accuracy of X [8, 9]. Extensive grinding and mixing of the original and doped samples are necessary to ensure sample homogeneity. In case the grains/crystallites are rather small, having the size of, say, 1 to 10
inte-grated intensities of diffraction lines should be precisely measured; the background line may be estimated by application of the appropriate proce-dures. The pure phase added to the original sample should have a similar degree of crystal perfection as the same phase present in the original sample.
The preferred orientation of the grains/crys-tallites has to be avoided. In case of its presence, the measured intensities of diffraction lines deviate from the true values corresponding to the random orientation of grains/crystallites. The presence of the preferred orientation can be noticed if rather different values of the fraction of X are obtained for different combinations of diffraction lines of X and Y. Grains/crystallites having a plate-like or a needle-like shape tend to assume a preferred mode of orientation when mounted in the sample holder. If the degree of the preferred orientation is not high, a rather accurate value of X can be obtained by averaging the data that follow from diffraction lines which are differently affected, by application of the plot of IX d+a/IY d as a function of(IX/IY) (26).
In case the preferred orientation of grains/cry-stallites is not present, the fractions of the phases can be found by comparison of the measured inten-sities of diffraction lines and the inteninten-sities of the same diffraction lines calculated on the basis of the crystal structure of the phases in question. For instance, the ratio of the molar fractions of rutile and anatase, TiO2,is given by
R/A = 1.25 (I110R/I101A),
where I110Rand I101A are the measured intensities of
diffraction lines 110 and 101 of rutile and anatase, resp. [10].
The doping method (iii) is, in principle, based on the non-overlapping diffraction lines. If a phase, say X, exhibits several partially overlapped diffrac-tion lines in a narrow angular interval, all these lines may be considered as a single diffraction line, if dif-fraction lines of other phases are not present in that interval. The problem of overlapping of diffraction lines can be overcome by means of the individual profile fitting method which enables derivation of the profiles of particular diffraction lines [11]. It has been suggested to combine the doping method (iii) and the individual profile fitting method, thus performing the quantitative phase analysis without the reference to structural models of particular phases [12].
The fractions of particular phases present in the studied system can be derived using the Rietveld
method. That method is the so-called full pattern analysis technique. Models of the crystal structures of the phases present in the system, together with instrumental and background information, are used to generate the theoretical diffraction pattern that can be compared to the observed pattern. The least squares procedure is then used to minimize the difference between the calculated diffraction pattern and the observed diffraction pattern by adjusting model parameters. That procedure may result in deter-mination of the fractions and microstructural para-meters of the phases present in the system and in refinement of their crystal structures [13].
REFERENCES
[1] L. Alexander, H. P. Klug, X-ray diffraction analysis of crystalline dusts, Anal. Chem.20, 886–889 (1948). [2] H. P. Klug, L. E. Alexander, X-ray Diffraction
Proce-dures, Chapter 7, New York, John Wiley, 1974. [3] F. H. Chung, Quantitative interpretation of X-ray
dif-fraction patterns of mixtures. I. Matrix-flushing method for quantitative multicomponent analysis; II. Adiabatic principle of X-ray diffraction analysis of mixtures , J. Appl. Cryst.7, 519–525, 526– 531 (1974).
[4] F. H. Chung, Quantitative interpretation of X-ray diffraction patterns of mixtures. III. Simultaneous determination of a set of reference intensities, J. Appl. Cryst. 8, 17–19 (1975). [5] L. E. Copeland, R. H. Bragg, Quantitative X-ray
diffrac-tion analysis, Anal. Chem.30, 196–201 (1958).
[6] A. Bezjak, I. Jelenić, The application of the doping method in quantitative X-ray diffraction analysis, Croat. Chem. Acta43, 193–198 (1971).
[7] S. Popović, B. Gržeta-Plenković, The doping method in quantitative X-ray diffraction phase analysis, J. Appl. Cryst. 12, 205–208 (1979).
[8] S. Popović, B. Gržeta-Plenković, T. Balić-Žunić, The doping method in quantitative X-ray diffraction phase analysis. Addendum, J. Appl. Cryst. 16, 505–507 (1983). [9] S. Popović, B. Gržeta-Plenković, Dilution and addition methods in quantitative X-ray diffraction phase analysis; in: Advanced Methods in X-ray and Neutron Structure Analysis in Materials Science, Editor J. Hašek, New York, Plenum Press, 1989, pp. 29–41.
[10] A. Gajović, K. Furić, N. Tomašić, S. Popović, Ž. Skoko, S. Musić, Mechanochemical preparation of nanocrystalline TiO2 powders and their behavior at high temperatures, Journal of Alloys and Compounds398, 188-199 (2005). [11] H. Toraya, Whole-powder-pattern fitting without reference
to a structural model: application to X-ray powder diffrac-tion data, J. Appl. Cryst. 19, 440–447 (1986).
[12] B. Gržeta, S. Popović, H. Toraya, DOP-FIT method for quantitative analysis of multicomponent powders, Mate-rials Science Forum, 228–231, 49–54 (1996).