DOI: 10.12928/TELKOMNIKA.v16i2.6193 665
Breast Mass Segmentation Using a Semi-automatic
Procedure Based on Fuzzy C-means Clustering
Moustapha Mohamed Saleck*1, Abdelmajid El Moutaouakkil2, Mohammed Moucouf3, MaksiBouchaib4, Hani Samira5, Jamaldine Zineb6 1,2
Dept. of Computer Science, Chouaib Doukkali University, El Jadida-Morocco
3
Dept. of Mathematics, Chouaib Doukkali University, El Jadida -Morocco
4,5,6
Dept. of Radiology, Hospital Mohamed V, El Jadida-Morocco *Corresponding author, e-mail: [email protected]
Abstract
Mammography is the primary modality that helped in the early detection and diagnosis of women b reast diseases. Further, the process of extracting the masses in mammogram represents a challenging task facing the radiologists, due to prob lems such as fuzzy or speculated b orders, low contrast and the presence of intensity inhomogeneities. Aims to help the radiologists in the diagnosis of b reast cancer, many approaches have b een conducted to automatically segment the masses in mammograms. Towards this aim, in this paper, we present a new approach for extraction of tumors from region -of-interest (ROI) using the algorithm of Fuzzy C-Means (FCM) setting two clusters for semi-automated segmentation. The proposed method meant to select as input data the set of pixels that enab le to get the meaningful information required to segment the masses with high accuracy. This could b e accomplished through eliminating unnecessary pixels, which influence on this process through separating it outside of the input data using an optimal thresho ld given b y monitoring the change of clusters rate during the process of threshold decrementing. The proposed methodology has successfully segmented the masses, with an average sensitivity of 82.02% and specificity of 98.23%.
Keywords: b reast cancer detection; fuzzy c-means clustering; threshold; median filtering; segmentation
Copyright © 2018 Universitas Ahmad Dahlan. All rights reserved.
1. Introduction
According to American cancer society, breast cancer is the most commonly diagnosed cancer type among women [1]. If the physicians are capable to detect cancer in its primary stages this would give women the maximum opportunity to stay alive, because the early check and detection of cancer is the most important thing in curing breast cancer. Radiologis ts and doctors could use computer aided diagnosis (CAD) system to help them making a reliable diagnosis of the breast cancer in its earlier stages [2]. Breast segmentation is a major step in various CAD methods; its performance and efficiency directly affect the performance of the subsequent processing steps in mammogram analysis.
Many approaches have been proposed to segment masses from surrounding tissues in digital mammograms. Mahfuzah Mustafa and al [3], used Chan-Vese Active Contour and Localized Active Contour for segmenting lesions in digitized mammogram images, the effectiveness of these techniques are then compared, the results obtained by Chan-Vese Active Contour are proven to be better than the Localized Active Contour method. J. Quintanilla et al [4], proposed mathematical morphology to enhance potential MCs. Afterwards, three algorithms (Fuzzy C-Means, K-Means, and Possibilistic Fuzzy c-Means) are used and compared in order to segment ROIs images, trying to improve the results of microcalcifications cluster detection.
J. Anitha et al [5], proposed a new computer aided approach to detect the suspicious lesions by using a Dual Stage Adaptive Thresholding (DuSAT), the authors used global histogram and local window thresholding method to detect the suspicious mass region. Q.Abbas et al [6], presented a new method for automatic breast mass segmentation in mammograms by combining the region -based and the edge--based techniques in four stages, using dynamic contrast improvement to select ROI, detection of mass candidate points by prior and posterior probabilities based on robust multiscale feature-fusion, and final delineation of the mass region by a MAP scheme. D. Pereira et al [7], implemented an artifact removal algorithm in CC and MLO views, the wavelet transform and Wiener filter are used for image enhancement, finally, the authors employed multiple
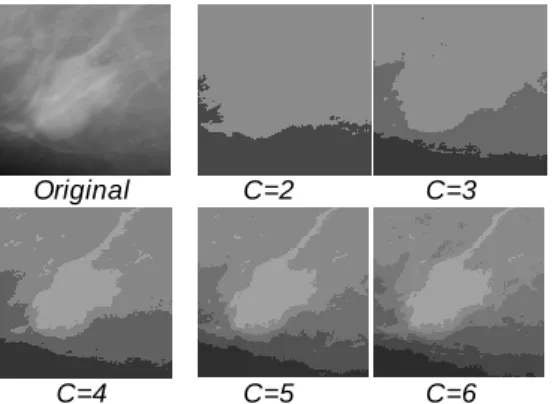
thresholding wavelet transform and genetic algorithm for masses detection and segmentation. J. Anitha et al [8], proposed spatialbased fuzzy level set algorithm for automatic mammogram mass segmentation, the output of fuzzy clustering is used as input for the level set segmentation that is used to refine the mass boundary, the results of fuzzy clustering are used to estimate the control parameters of level set algorithm. Khaddouj Taifi et al [9], proposed a hybrid technique for enhancing mammograms, this technique combines Nonsubsampled Contourlet Transform and Hommomorphic Filtering, then the authors presented a comparative study based on three different algorithms: proposed methods, homomorphic filtering and unsharp masking, the experimental results of this study show that the proposed method significantly reduces noise in high noise mammograms. The choice of the cluster number is one of the biggest challenges to ensure better segmentation result by Fuzzy C-means; because the performance of segmentation result strongly depends on the number of attached clusters.
Original C=2 C=3
C=4 C=5 C=6
Figure 1. The Different Clustering Results
Despite the large number of studies that have been developed in order to get the optimal number of clusters, and to adapt the fuzzy c -means for automatic image segmentation [10-11], an automatic processing for tumor segmentation by using FCM is still challenging in CAD system. Therefore, the aim of this paper is to overcome this limitation; and to present a novel breast mass segmentation method based on Fuzzy c-means algorithm, where the number of clusters is C=2. Aiming to get one of these clusters represent the mass with high accuracy, we introduce a threshold that allows selecting as input data just the meaningful set of pixels. After doing the noise reduction by using median filter, the process of decrementing starts with increasing the number of input data and account the amount of output data in each cluster. the change of output data amount, during threshold decrementing subject to examination in order to obtain an optimal threshold, which will enable us to select as FCM input, just the set of pixels suitable and enough to be used to doing the best segmentation.
The paper is organized as follows: Section 2 describes the materials and proposed methodology for segmentation of mammographic masses. Section 3 demonstrates the results and performance. Finally, section 4 presents the conclusion.
2. Research Method
In this part, we present details of the various methods and materials used in this study. 2.1. Database Description
Mammography Image Analysis Society (MIAS) has created a mammogram database. In this work, we use this database. The original MIAS database is digitized at 50-micron pixel edge and has been reduced to 200-micron pixel edge and clipped or padded so that every image is 1024 X 1024 pixels. All images are held as 8-bit gray level scale images with 256 different gray levels (0-255) and physically in portable gray map (PGM) format.
2.2. Preprocessing
Image preprocessing is necessary to improve the quality of the image and to remove the unwanted noise from mammogram images, which allows improving the accuracy of segmentation results. For this reason, 2D-median filter [11], is applied in this work. The method is called semi-automatic because of the need of selection of ROI by an expert.
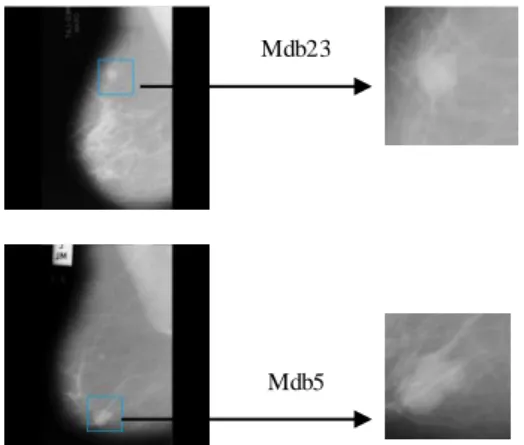
We have taken a square region of area 174x174 pixels as the ROI for this study, the value 174 is chosen in consultation with the radiologist because it is the radius of the largest mass present in the database [12].
Mdb23
Mdb5
Figure 2. ROI (174x174) Obtained from mdb5 and mdb23
2.3. Fuzzy C-Means Clustering
Fuzzy C-Means Clustering (FCM) algorithm was first introduced by Dunn [13] in 1973 and improved by Bezdek [14] in 1981. This algorithm is one of the most commonly used unsupervised pattern recognition approaches for tumor segmentation [15]. In the Fuzzy c-means, each image pixel has certain membership degree associated with each cluster centroid. These membership degrees have values between 0 and 1. FCM based on optimizing the following objective function (1):
∑ ∑ ( ) (1)
( ( ))
∑ ( ( ))
(2)
∑
∑ (3)
Where m >1 is the fuzzy index, n is the total number of pixels in image, is the membership degree
of k the pixel to the centroid . ‖ ‖ is the distance between and The function
J (1) is optimized with an iterative function to achieve fuzzy partitioning and the elements of the membership matrix and the cluster center is updated and is given by (2) and (3).
2.4. Basic Idea
As previously mentioned, the estimation of the optimal number of clusters often affects the performance and efficiency of the Fuzzy c-means algorithm in image segmentation. For this reason, the proposed methodology aims to provide a solution to overcome the sensitivity of the Fuzzy c -means to the clusters number in mammogram images segmentation by finding a range of appropriate pixels (The input FCM), where application of fuzzy c-means algorithm within this range can produce two clusters only as output, one of them represents the breast tumor. The first limit of the appropriate range is defined by the maximum gray level (MG) because the abnormal lesions in mammography images characterized by high-intensity values compared to other regions of the
breast. While, an optimal threshold (Opt), represents the second limit of this range.
To find an optimal threshold (Opt), we have used a decrement operator (P) and a threshold testing (Tt) initialized by Tt=MG – P. For each iteration the set of pixels existing inside of the range [Tt-MG], should be used as input of FCM, then it subject to clustering, after that, we compute the percentage of output data in each cluster (cluster_1, cluster_2), and the set of pixels unclassified (outside of the range). The basic idea of decrement threshold is to increase the amount of pixels (input data) which subject to clustering, thus finding different results of output c lusters depending on the input data, from these results we can accurately determine an appropriate threshold.
Figure 3. Process of Clustering During Threshold Decrementing
3. Results and Analysis
In this section, it is explained the results of research and at the same time is given the comprehensive discussion. Results can be presented in figures, graphs, tables and others that make the reader understand easily [2], [5]. The discussion can be made in several sub-chapters.
3.1. Sub Bab 1 xx 3.2. Sub Bab 2
yy
4. Conclusion
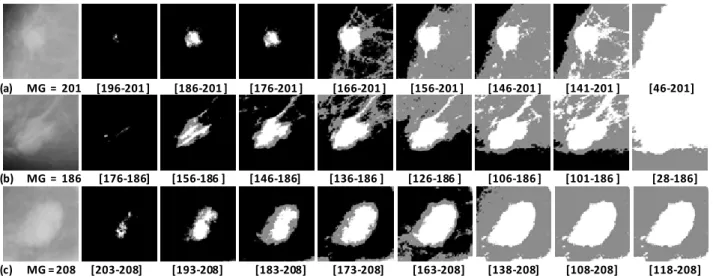
Figure 4. Examples of Results from Different Range of Application. (a) Mdb23, (b) Mdb5, (c) Mdb15. .
. . . . . . .
[MG……..Tt….
]
FCM
Cluster_1 ( %)
Cluster_2 ( %)
Unclassified ( x%)
Cluster_1 ( %)
Cluster_2 ( %)
Unclassified = 0%
FCM
[MG………….
]
. . .
.
. . . . . . . . = – P, where P=5 ;
𝐉 ∑
𝐢∑
𝐧𝐤𝐔
𝐢𝐤𝐝
(𝐱
𝐤𝐯
𝐢)
,
Where 𝒙𝒌∈ [Opt – MG] (4)(a) MG = 201 [196-201 ] [186-201 ] [176-201 ] [166-201 ] [156-201 ] [146-201 ] [141-201 ] [46-201]
(b) MG = 186 [176-186] [156-186 ] [146-186] [136-186 ] [126-186 ] [106-186 ] [101-186 ] [28-186]
(a)
(b)
(c)
Figure 5. Rate of Cluster_1, Cluster_2, Unclassified Pixels, During Process of Threshold Decrementing. (a) Mdb23, (b) Mdb5, (c) Mdb15.
In observing the evolution of output data from cluster_1 and cluster_2 during the process of threshold test decrementing, we can distinguish two kinds of results. The first case is illustrated in figure 5. (a) and (b) shows an increase and strong growth at the cluster_1 level, followed by a sudden decrease. In contrast, the cluster_2 that represent the masses, begin to grow by a low increase followed by a sudden sharp increase. The sudden change in the evolution of the cluster happens at the same point of threshold test (crucial point), this point represents an optimal threshold of segmentation. So, we can use the following formula to find an appropriate threshold.
=
,
=
.
// , are cluster_1 and cluster_2.
// are tw o successive points from the curve of clusters evolution in process of decrementing.
// optimal threshold.
// : are the gradients of , .
The second case is illustrated in figure 5.(c), it can be noted that there is an increase homogeneous followed by fixed evolution at the cluster_1 level and a similar increase with a stronger rate after a few iterations at the cluster_2 level, followed by fixed evolution. In contrast with the previous situation, in this case, all pixels are used as input data to segment the mass from ROI. So, this situation is achieved when:
, Where
// : minimum gray level.
𝑓 𝑆
𝑇𝑡< 𝑂𝑝𝑡 𝑇
𝑡Choosing a high value of decrement operator (P) gives divergent thresholds for testing whereas many values have been exceeded, this divergence influences on the accuracy of threshold optimal. On the other hand, when the parameter takes a low value, so we have a long time to perform the process of segmentation, for this reason, and after many tests with several images in th e database MIAS, we obtained good results with P= 5.The morphological operation “area open” applied, to retain only the biggest region which represents the mass and removes all other regions.
Figure 6. The Output Images
3. Experiment Results
In this work, the proposed method is tested by using a set of 21 digitized mammograms contain 22 masses taken from MIAS database. Our system was implemented in Java 8.0 using the Java Advanced Imaging (JAI) API. The process of extracting the masses from ROIs achieved without user intervention.
To evaluate the method all masses contours are manually marked by one of three
radiologists (one ground truth agreed by three radiologists in the same examination session) from El Jadida hospital, in Morocco, based on the visual criteria.
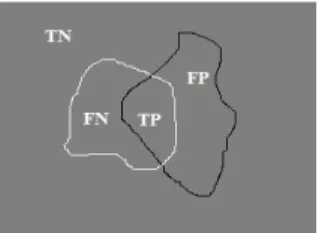
Figure 7. True Positives, True negatives, False Positives, and False Negatives definition.
Where the white contours lines represent the contours denoted by a radiologist, and the black contours lines are the segmentation results using the proposed method.
TP represents the intersection between the segmentation results given by the radiologist and the segmentation results given by the system, FN is the segmentation obtained by the radiologist, FP represents the segmentation obtained by the system and TN is the region outside the s egmentation obtained by both the radiologist and the system. In order to evaluate the performance of segmentation, the following measures are used.
Sensitivity=
(5)
Specificity=
(6)
Accuracy=
(7)
Pixels Unclassified
[146 - 201] [106 - 186] [118 - 208]
Optimal ranges Cluster_2 Cluster_1 (Mass cluster)
Overlap=
(8)
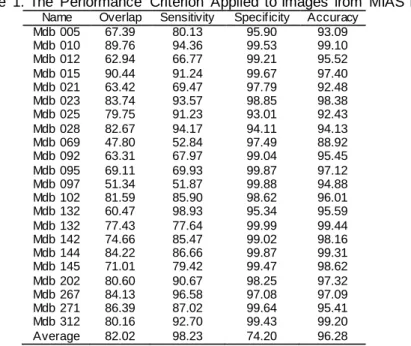
The overlap indicates how much the mass boundary delineated by an algorithm intersects with the mass boundary delineated by radiologists. The sensitivity measure indicates the probability that pixels are classified among the diseases (TP).The specificity measure indicates the probability that the pixels are classified among the non-disease (TN). Accuracy indicates the ratio of correctly classified pixels to the ROI.
Table 1. The Performance Criterion Applied to Images from MIAS Database
Name Overlap Sensitivity Specificity Accuracy
Mdb 005 67.39 80.13 95.90 93.09
Mdb 010 89.76 94.36 99.53 99.10
Mdb 012 62.94 66.77 99.21 95.52
Mdb 015 90.44 91.24 99.67 97.40
Mdb 021 63.42 69.47 97.79 92.48
Mdb 023 83.74 93.57 98.85 98.38
Mdb 025 79.75 91.23 93.01 92.43
Mdb 028 82.67 94.17 94.11 94.13
Mdb 069 47.80 52.84 97.49 88.92
Mdb 092 63.31 67.97 99.04 95.45
Mdb 095 69.11 69.93 99.87 97.12
Mdb 097 51.34 51.87 99.88 94.88
Mdb 102 81.59 85.90 98.62 96.01
Mdb 132 60.47 98.93 95.34 95.59
Mdb 132 77.43 77.64 99.99 99.44
Mdb 142 74.66 85.47 99.02 98.16
Mdb 144 84.22 86.66 99.87 99.31
Mdb 145 71.01 79.42 99.47 98.62
Mdb 202 80.60 90.67 98.25 97.32
Mdb 267 84.13 96.58 97.08 97.09
Mdb 271 86.39 87.02 99.64 95.41
Mdb 312 80.16 92.70 99.43 99.20
Average 82.02 98.23 74.20 96.28
We give in the Table the results of some existing algorithms to compare the performance of the proposed method with previously explored methods.
Table 2. Results Comparison
Paper
Ref. No Proposed Method
Results
Database Overlap Sensitivity Specificity Accuracy
[3] Chan-Vese Active Contour - - - - - - 90% DDSM [7] w avelet analysis, genetic algorithm 79.2% - - - - - - DDSM [5] dual stage adaptive thresholding
(DuSAT)
- - 93.5% - - - - - - 92.5% - - - -
MIAS DDSM [16] Mean Shift Segmentation and Iris Filter 60 % 81% - - - - University Shiga
4. Conclusion
It is often difficult to extract a tumor from normal breast tissues by radiologists in mammogram images, because of their ambiguous margins and subtle appearance. In this paper, we have proposed a semi-automatic segmentation using FCM where the number of clusters is known without estimation. The input of FCM is a set of pixels taken from a range limited by maximum gray level and a threshold; these pixels represent the set of data which will all ow us to get two clusters only, one of them represents the tumor with high accuracy. The results obtained demonstrate the efficiency and effectiveness of our proposed method.
References
[1] American Cancer Society. Cancer Facts & Figures 2016. 2016: 1-9.
[2] A. Oliver et al. A review of automatic mass detection and segmentation in mammographic images . Med.
Image Anal. 2010; 14(2): 87–110.
[3] M. Mustafa, H. Najwa, O. Rashid, N. Rul, H. Abdullah. Mammography Image Segmentation : Chan-Vese Active Contour and Localised Active Contour Approach. 2017; 5(3): 577–583.
[4] J. Quintanilla-Dominguez, B. Ojeda-Magañ, M. G. Cortina-Januchs, R. Ruelas, A. Vega-Corona, D. Andina. Image segmentation by fuzzy and possibilistic clustering algorithms for the identification of microcalcifications. Sci. Iran. 2011; 18(3): 580–589.
[5] J. Anitha, J. Dinesh Peter, S. Immanuel Alex Pandian. A dual stage adaptive thresholdin g (DuSAT) for automatic mass detection in mammograms. Comput. Methods Programs Biomed. 2017; 138: 93–104.
[6] Q. Abbas, M. E. Celebi, I. F. Garcia. Breast mass segmentation using region -based and edge-based methods in a 4-stage multiscale system. Biomed. Signal Process. Control. 2013; 8: 204–214.
[7] D. C. Pereira, R. P. Ramos, M. Z. do Nascimento. Segmentation and detection of breast cancer in mammograms combining wavelet analysis and genetic algorithm. Comput. Methods Programs Biomed. 2014; 114(1): 88–101.
[8] J. Anitha. A Spatial Fuzzy b ased Level Set Method for Mammogram Mass Segmentation. Ieee Spons. 2Nd Int. Conf. Eletronics Commun. Syst. Spons. 2Nd Int. Conf. Eletronics Commun. Syst. no. Icecs . COMMUNICATION SYSTEM ( ICECS 2015 )2015.
[9] K. Taifi, R. Ahdid, M. Fakir, S. Safi. A Hybrid the Nonsubsampled Contourlet Transform and Homomorphic Filtering for Enhancing Mammograms. 2015; 16(3): 539–545.
[10] V. Schwämmle, O. N. Jensen. A simple and fast method to determine the parameters for fuzzy c-means cluster analysis . Bioinformatics. 2010; 26(22): 2841–2848.
[11] T. Bernholt, R. Fried, U. Gather, I. Wegener. Modified repeated median filters. Stat. Comput. 2006; 16(2): 177–192.
[12] K. Vaidehi, T. S. Subashini. Automatic characterization of benign and malignant masses in mammography. Procedia Comput. Sci. 2015; 46: 1762–1769.
[13] J. C. Dunn. A Fuzzy Relative of the ISODATA Process and Its Use in Detecting Compact Well -Separated Clusters. J. Cyb ern. 1974; 3(3) 32–57.
[14] J. C. Bezdek. Pattern Recognition with Fuzzy Objective Function Algorithms . 1981; 25(3).
[15] W. Chen, M. L. Giger, U. Bick. A fuzzy c-means (FCM)-based approach for computerized segmentation of breast lesions in dynamic contrast-enhanced MR images. Acad. Radiol. 2006; 13(1): 63–72.
[16] T. Terada, Y. Fukumizu, H. Yamauchi, H. Chou, Y. Kurumi. Detecting Mass and its Region in Mammograms Using Mean Shift Segmentation and Iris Filter. 2010; 1176–1179.