R E S E A R C H
Open Access
Densitometric and local histogram based
analysis of computed tomography images
in patients with idiopathic pulmonary
fibrosis
Samuel Y. Ash
1*†, Rola Harmouche
2†, Diego Lassala Lopez Vallejo
1, Julian A. Villalba
1, Kris Ostridge
3, River Gunville
4,
Carolyn E. Come
1, Jorge Onieva Onieva
2, James C. Ross
2, Gary M. Hunninghake
1, Souheil Y. El-Chemaly
1,
Tracy J. Doyle
1, Pietro Nardelli
2, Gonzalo V. Sanchez-Ferrero
2, Hilary J. Goldberg
1, Ivan O. Rosas
1,
Raul San Jose Estepar
2†and George R. Washko
1†Abstract
Background:Prior studies of clinical prognostication in idiopathic pulmonary fibrosis (IPF) using computed tomography (CT) have often used subjective analyses or have evaluated quantitative measures in isolation. This study examined associations between both densitometric and local histogram based quantitative CT measurements with pulmonary function test (PFT) parameters and mortality. In addition, this study sought to compare risk
prediction scores that incorporate quantitative CT measures with previously described systems.
Methods:Forty six patients with biopsy proven IPF were identified from a registry of patients with interstitial lung disease at Brigham and Women’s Hospital in Boston, MA. CT scans for each subject were visually scored using a previously published method. After a semi-automated method was used to segment the lungs from the
surrounding tissue, densitometric measurements including the percent high attenuating area, mean lung density, skewness and kurtosis were made for the entirety of each patient’s lungs. A separate, automated tool was used to detect and quantify the percent of lung occupied by interstitial lung features. These analyses were used to create clinical and quantitative CT based risk prediction scores, and the performance of these was compared to the performance of clinical and visual analysis based methods.
Results:All of the densitometric measures were correlated with forced vital capacity and diffusing capacity, as were the total amount of interstitial change and the percentage of interstitial change that was honeycombing measured using the local histogram method. Higher percent high attenuating area, higher mean lung density, lower
skewness, lower kurtosis and a higher percentage of honeycombing were associated with worse transplant free survival. The quantitative CT based risk prediction scores performed similarly to the clinical and visual analysis based methods.
(Continued on next page)
* Correspondence:[email protected] †Equal contributors
1Division of Pulmonary and Critical Care Medicine, Department of Medicine,
Brigham and Women’s Hospital, 75 Francis St., PBB, CA-3, Boston, MA 02115, USA
Full list of author information is available at the end of the article
(Continued from previous page)
Conclusions:Both densitometric and feature based quantitative CT measures correlate with pulmonary function test measures and are associated with transplant free survival. These objective measures may be useful for identifying high risk patients and monitoring disease progression. Further work will be needed to validate these measures and the quantitative imaging based risk prediction scores in other cohorts.
Keywords:Interstitial lung disease, Idiopathic pulmonary fibrosis, Computed tomography, Quantitative, Imaging, Mortality
Background
Idiopathic pulmonary fibrosis (IPF) is a progressive and usually fatal disease. While the median survival is only 2.53.5 years without treatment, the clinical course can be variable, and the prediction of IPF related outcomes in an individual can be challenging [1, 2]. IPF severity is often described using pulmonary function test (PFT) pa-rameters, or using systems such as the GAP index, which incorporates gender, age, forced vital capacity (FVC) and diffusing capacity (DLCO) into a risk predic-tion model [3]. Because patients with IPF usually have had a computed tomography (CT) scan, both qualitative and quantitative CT measurements have also been stud-ied to determine their associations with PFT measures and clinical outcomes [4–15]. These studies have often used volumetric CT data acquired in a research setting, and there has been limited investigation into what additional information CT measurements provide above and beyond risk prediction models such as the GAP index [16].
In this study, using clinically acquired non-volumetric data, we aimed to validate previously described associa-tions of densitometric quantitative CT measurements with PFT parameters and mortality in IPF. [6, 17] In addition, we have developed a fully automated method that uses the local histogram pattern of lung density combined with the distance from the pleural surface to quantify the volume of radiographic tissue subtypes that make up normal, emphysematous, and interstitial tissues [18, 19]. We hypothesized that the total percentage of interstitial disease and the percentage of disease that was the honeycombing subtype would be associated with FVC, DLCO and mortality in IPF. In addition, we aimed to compare the prognostic value of a previously de-scribed clinical and visual analysis based risk prediction system with those based on clinical and objective mea-sures [16]. Specifically, because a visually calculated fi-brosis score had been previously described to be able to substitute for diffusing capacity in the GAP score, we hy-pothesized that the objectively measured interstitial changes, measured either directly using a local histo-gram based detection system, or indirectly in the form of high attenuation areas, could be used in a similar manner [4, 16, 20]. Finally, because honeycombing has
been shown to be related to poor outcomes in IPF, we hypothesized that the percentage of interstitial dis-ease that was honeycombing could be used in the same way [4].
Methods
Study design and data acquisition
The David E. Herlihy Data Registry and DNA Repository is an institutional review board approved registry of pa-tients with ILD at Brigham and Women’s Hospital in Boston, MA (Partners Institutional Review Board Protocol Number 2012-P-000840/1). All patients over the age of 18 receiving care for interstitial lung disease (ILD) at Brigham and Women’s Hospital are eligible to enroll. At the time of enrollment patients have the option to opt in or out of the 5 portions of the study including a research question-naire, medical history review, serum and plasma banking, genetic testing, and future contact for other studies. All patients in the registry provided informed consent and only those patients who consented to medical history re-view, which specifically includes the analysis of imaging data, were considered for this study. Only those patients who had a prior lung biopsy that showed usual interstitial pneumonia (UIP), and who had CT imaging and spirom-etry within 48 h of each other were included. Patients whose longitudinal follow up data were not available, in-cluding lung transplant status and mortality, were excluded. All testing was performed only as clinically indicated.
Objective CT analyses
The CT images used for this study were those typically termed “high resolution”: non-volumetric 1 mm slices with 10 mm spacing with a sharp kernel image recon-struction obtained without the administration of intra-venous contrast. Using a previously described automated technique, the lung was segmented from the surround-ing tissue [21]. The axial images were then visually inspected and manually edited as needed to correct in-accurate segmentations.
density, MLD) were measured. In addition, the per-centage of the total volume of tissue that had a dens-ity between -250 Hounsfield units (HU) and -600 HU was recorded as the percent high attenuation area (HAA%) [22].
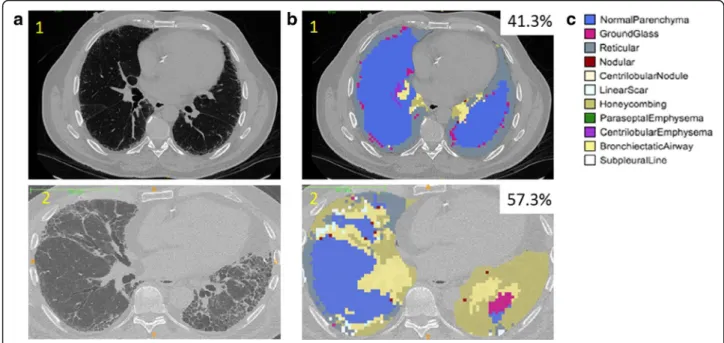
Full details regarding the local histogram based object-ive quantification of the volume of radiographic feature subtypes are available in the (Additional file 1). Briefly, we used both the properties of the local tissue and the distance from the pleural surface to determine a radiographic feature subtype for every portion of the lung [18, 19, 23]. First, in order to train the subtype identification tool, a single expert placed a total of 3357
of each of the subjects were classified into tissue subtypes based on their similarity to the training data as shown in Fig. 3.
The total percentage of all of the interstitial features (objective interstitial score, interstitial%) was then deter-mined by combining the reticular, centrilobular nodule, linear scar, nodular, subpleural line, ground glass and honeycombing subtype volumes and dividing by the total volume of all tissue types (normal, interstitial and emphysematous). The percentage of interstitial disease made up of by honeycombing (honeycombing%) was de-termined by dividing the volume of the honeycombing subtype by the total volume of all of the interstitial sub-types. Due to the exploratory nature and small size of this study, subjects used in the training set were not ex-cluded from the final analysis.
Visual analysis
The same CT images used for the objective analysis were reviewed by two experts and the percentage of lung occupied by fibrotic disease (reticular and honeycomb-ing) was qualitatively defined as described previously [16, 24]. Briefly, the two experts determined the percent-age of lung occupied by reticular and honeycombing changes in each of six lung zones, three on each side, with the upper lung zone extending from the apex to the level of the aortic arch, the middle from the aortic arch to the inferior pulmonary veins, and the inferior from the inferior pulmonary veins to the bases. The per-centages identified by both experts were then averaged to determine the mean total percentage of lung occupied by visually defined fibrotic changes, also termed the vis-ual fibrosis score (fibrosis%) [16, 24].
Fig. 2aSample slice for CT scan of a subject.bThe same sample slice from a subject CT scan showing placement of fiducials for the training of the local histogram based objective method. Abbreviations: ground glass (GG), honeycombing (Hon), reticular (Ret), computed tomography (CT)
Statistical analysis
Pearson correlation coefficients were calculated between the CT measurements (densitometric: MLD, skewness, kurtosis, HAA%, visual: fibrosis%, and local histogram based: interstitial%, honeycombing%) and the nearest in time percent predicted forced vital capacity (FVC%) and percent predicted diffusing capacity of carbon monoxide (DLCO%). The Pearson correlation coefficient was also calculated between the visual fibrosis score (fibrosis%) and the objective interstitial score (interstitial%).
All of the CT predictors were dichotomized at their medians and both Kaplan-Meier and univariate Cox re-gression survival analyses were performed for the out-come of time to death or transplant (transplant free survival). Univariate Cox regression survival analyses were also performed for the outcome of time to death for the subgroup of subjects who did not undergo trans-plant. Each predictor was evaluated using the cumulative sum of Martingale-based residuals and none were found to violate the proportional hazards assumption [25].
The continuous GAP score was calculated for each subject as previously published [3]. For the purposes of the GAP score calculation, subjects who did not have a DLCO available were assumed to have been unable to perform the test. The continuous qualitative or visual GAP-CT score was calculated by using the visual fibrosis
score in place of the DLCO as previously described [16]. Three additional GAP scores were calculated by using the following quantitative measures in place of the visual fibrosis score: 1) interstitial% (GAP-QCT), 2) honey-combing% honeycombing), and 3) HAA% (GAP-HAA). For each of these combination clinical and imaging scoring methods, their performance with regard to the prediction of transplant free survival was assessed using the c-index, which was calculated using the method described by Pencina et al. [26, 27] The c-index accommodates censoring, and can be thought of as similar to the area under the receiver operating curve for logistic regression, in that it ranges from 0 to 1.0 (variably expressed as 0-100%), and a value of 0.5 indi-cates no predictive discrimination while a value of 1.0 indicates perfect discrimination [16].
A p value of less than 0.05 was considered to indicate statistical significance. All analyses were performed using SAS, version 9.4 (SAS Institute, Cary, NC).
Results
Of the 176 subjects in the registry as of August 15, 2015, 46 (26%) met inclusion criteria. All 46 had longitudinal data available regarding lung transplant and mortality, and 36 (78%) had DLCO measurements available for the same time point as spirometry. The clinical characteristics Fig. 4Kaplan Meier survival curves for transplant free survival for the densitometric CT measures.aHAA%,bMLD,cskewness,dkurtosis.
of these subjects are shown in Table 1. While the indica-tions for lung biopsy were not recorded in all cases, visual review revealed that the majority of subjects had CT find-ings consistent with UIP.
The visual fibrosis score and the objective interstitial score were highly correlated (r = 0.77, p< 0.001). All of the CT measurements, including the densitometric mea-sures, the quantitative interstitial score, the quantitative honeycombing measure, and the visual fibrosis score were strongly correlated with both FVC% and DLCO% as shown in Table 2. The median follow up duration was 465 days, during which 14 (30%) patients underwent lung transplant and 12 (26%) died. Higher HAA%, higher MLD, lower skewness and lower kurtosis were associated with a shorter transplant free survival as shown in Fig. 4 a-d and Table 3. Those subjects with higher fibrosis% and honeycombing% also had a shorter transplant free survival as shown in Figs. 5a and c and
Table 3. There was trend toward a shorter transplant free survival for those subjects with higher interstitial%, but this did not reach statistical significance as shown in Fig. 5b and Table 3. In the subgroup that did not undergo transplant, the same features were associated with increased mortality with the exception of honey-combing% as shown in Table 3.
The c-indices for the standard GAP score as well as for the GAP-CT, GAP-QCT, GAP-honeycombing and GAP-HAA scores are shown in Table 4. With the exception of the GAP-HAA score all of the calculated continuous GAP scores had similar c-indices. These were also similar to the previously published c-indices for both the standard GAP score and the GAP-CT score [3, 20].
Discussion
In this study of 46 subjects with biopsy proven IPF we found that both densitometric and local histogram based quantitative CT measurements were correlated with FVC% and DLCO%. Densitometric measures including higher HAA%, higher MLD, lower skewness and lower kurtosis, and a higher proportion of local histogram defined interstitial changes made up of honeycombing were all associated with shorter transplant free survival. In addition, in this cohort, GAP scores that utilized quantitative CT measures of interstitial disease (GAP-QCT, GAP-honeycombing and GAP-HAA) performed similarly to the standard GAP score and to the visual analysis based GAP-CT score with regard to associations with transplant free survival.
Table 1Characteristics of the cohort
Gender Number Percent
Male 33 71.7
Race Number Percent
White 38 82.6
Black 2 4.35
Asian 3 6.5
Hispanic 3 6.5
Pulmonary Function Mean
(Standard Deviation)
Median, Interquartile Range
FEV1 - L 2.03 (0.69) 2.02, [1.62, 2.45]
FEV1 % predicted 64.76 (21.05) 64, [49, 82]
FVC - L 2.40 (0.86) 2.36, [1.71, 2.91]
FVC % predicted 60.17 (21.11) 58.5, [44.0, 73.0]
DLCO–mL/min/mmHg 10.40 (3.99) 10.06, [7.75, 12.53]
DLCO % predicted 39.61 (15.66) 37.0, [30.5, 48.5]
Quantitative CT Measures -Densitometric
Mean
(Standard Deviation)
Median, Interquartile Range
Mean Lung Density (HU) -670.14 (86.24) -680.46, [-733.31, -607.03]
Skewness 1.35 (0.55) 1.40, [1.01, 1.79]
Kurtosis 5.06 (2.32) 4.72, [3.18, 6.18]
Percentage of Lung Occupied by High Attenuation Area, HAA%
17.21 (6.45) 15.41, [12.54, 23.13]
Qualitative CT Measures Mean
(Standard Deviation)
Median, Interquartile Range
Fibrosis Score, fibrosis% 26.89 (15.80) 22.92, [14.17, 37.50]
Quantitative CT Measures - Feature Based
Mean
(Standard Deviation)
Median, Interquartile Range
Quantitative interstitial score, interstitial%
68.53 (18.39) 65.75, [57.53, 81.90]
Percentage of Interstitial Disease Occupied by Honeycombing, Honeycombing%
26.36 (17.19) 21.65, [12.09, 38.04]
Abbreviations: computed tomography (CT), diffusing capacity of carbon
monoxide (DLCO), forced expiratory volume in 1 s (FEV1), forced vital capacity (FVC), Hounsfield units (HU), standard deviation (SD)
Table 2Pearson correlation coefficients for quantitative CT measures and PFT measures
CT measure FVC % predicted DLCO % predicted
r p r p
Quantitative Densitometric
Mean Lung Attenuation -0.78 <0.001 -0.73 <0.001
Skewness 0.76 <0.001 0.73 <0.001
Kurtosis 0.71 <0.001 0.68 <0.001
Percent High Attenuating Area -0.77 <0.001 -0.69 <0.001
Qualitative
Fibrosis Score, fibrosis% -0.64 <0.001 -0.7 <0.001
Quantitative Feature Based
Quantitative Interstitial Score, interstitial%
-0.79 <0.001 -0.70 <0.001
Percentage of Interstitial Disease Occupied by Honeycombing, Honeycombing%
-0.66 <0.001 -0.66 <0.001
A multitude of variables have been evaluated as markers of disease severity in IPF, including clinical predictors such as symptom based scoring systems, spi-rometric and other physiologic measures, pathologic patterns, serum and bronchoalveolar lavage biomarkers,
and both qualitative and quantitative radiographic measures [4]. Each of these has its advantages and disad-vantages with regard to accuracy, reproducibility, ease of use, and applicability at the individual patient level. With regard to radiographic predictors, both qualitative
Table 3Unadjusted hazard ratios for death or transplant (A) and for death in those who did not undergo transplant (B) for measurements dichotomized at their medians
Measurement Hazard ratio for death
or transplant
p Hazard ratio for deatha
p
Quantitative Densitometric
Mean Lung Density (High vs. Low) 3.27 0.006 5.05 0.015
Skewness (Low vs. High) 2.92 0.012 3.56 0.039
Kurtosis (Low vs. High) 4.49 0.001 4.37 0.013
High Attenuating Area (High vs. Low) 3.17 0.007 7.69 0.009
Qualitative
Fibrosis Score, fibrosis% (High vs. Low) 3.48 0.003 3.96 0.026
Quantitative Feature Based
Quantitative Interstitial Score, interstitial% (High vs. Low) 2.30 0.065 3.51 0.065
Percentage of Interstitial Disease Occupied by Honeycombing, Honeycombing% (High vs. Low)
3.28 0.014 2.86 0.094
Pulmonary Function Test
FVC percent predicted (Low vs. High) 2.80 0.016 3.14 0.063
DLCO percent predicted (Low vs. High) 3.78 0.012 3.38 0.100
Abbreviations: diffusing capacity of carbon monoxide (DLCO), forced vital capacity (FVC).a
In the subgroup who did not undergo transplantation
scoring systems and the visual presence of a UIP pattern have been associated with a higher risk of death [6, 24, 28–33]. While useful, these approaches are limited by the need trained experts, the time con-suming process of visual review, and the subjectivity of visual analysis. For instance, Walsh et al showed that inter-observer agreement for the presence of UIP on CT was only 0.40, even for experienced thoracic radiologists [34]. These limitations suggest a role for quantitative CT analysis, especially when considering the analysis of images from larger cohorts.
In prior studies of CT scans obtained as part of research protocols, higher values of MLD and lower values of skewness and kurtosis, have been associated with worse pulmonary function, with the absolute value of correlation coefficients ranging from 0.18 to 0.74 [10, 17, 35]. In addition, Best et al found that skewness and kurtosis were associated with mortality [6]. In our study, we replicated those results using non-volumetric, clinically acquired CT scans, suggest-ing that these methods may be applicable outside of a research setting. In fact, the levels of association with FVC and DLCO in particular were higher than previ-ously described, perhaps due to the relative severity and homogeneity of disease in our cohort. In addition, we found that impairments in all of the densitometric mea-sures that we evaluated were associated with shorter transplant free survival.
We also evaluated a local histogram and distance based approach for quantifying radiographic subtypes of lung tissue. We, and others, have used similar ap-proaches in the study of emphysema, but there has been limited evaluation of such methods in IPF, and, to our knowledge, we are the first to apply this specific tech-nique, which includes the distance from the pleural sur-face as part of the analysis, to IPF. [9, 18, 19, 36] We found that higher values of both the total percentage of lung occupied by interstitial features and the proportion of those features that were honeycombing, were strongly correlated with impairments in FVC% and DLCO%. We also found that there was a trend toward worse trans-plant free survival for those with higher total amounts of
interstitial changes, a finding analogous to that of visual fibrosis scores. In addition, there was worse transplant free survival for those with a higher proportion of inter-stitial disease that was honeycombing, a finding which could be considered analogous to the visual presence of a UIP type radiographic pattern. For simplicity, we did not directly evaluate clinical associations with the per-centage of total lung occupied by honeycombing, how-ever we did find that the total percentage of lung occupied by interstitial changes was highly correlated with the percentage of those changes that were honey-combing (r = 0.95, p< 0.001) suggesting that the two may have similar clinical associations.
Prior work by Ley et al showed that a visual fibrosis score could substitute for DLCO, thus we sought to both replicate this finding and determine if quantitative mea-sures could be used in place of this qualitative measure-ment [16]. We found that both the standard continuous GAP score and the visual GAP-CT score performed similarly to their previous descriptions, and that, when used in place of the visual score, the quantitative mea-sures based on local histogram analysis (GAP-QCT and GAP-honeycombing) provided similar results with re-gard to transplant free survival. The GAP score based on the densitometric measure HAA% (GAP-HAA) per-formed nearly, but not quite, as well as the other quanti-tative CT measures. Together, these findings suggest that quantitative CT measures could be used in place of qualitative measures for predicting risk in patients with IPF, though this interpretation is limited by the explora-tory nature of this study and the use of only the deriv-ation cohort for these analyses. Additional studies in validation cohorts, including those with less severe dis-ease, will be needed to validate this finding. Of note, for the GAP-QCT score we utilized a measure of all intersti-tial changes, including ground glass, while the visual fi-brosis score only reflects reticular and honeycombing changes. The latter we chose based on its prior descrip-tion in the literature [16]. With regard to the former, we felt that for simplicity it would be best to quantitatively characterize lung tissue as normal, emphysematous or interstitial, with the only subgroup analysis being the analysis of honeycombing due to its known visual associ-ation with poor outcomes [32]. In this cohort this differ-ence in fibrosis/interstitial score definition is unlikely to have dramatically affected the results as the vast majority (84.1%) of the objective interstitial changes were either reticular or honeycombing, but additional work will be needed in larger and less diseased cohorts to determine what potential role each of the interstitial tissue subtypes play in the objective CT analysis of IPF.
The strengths of our study include the robustness of our findings despite the use of clinically acquired data including not excluding patients with suboptimal
Table 4c-Indices for continuous GAP models for prediction of transplant free survival
Predictor c-Index Confidence
interval
Diffusing Capacity, DLCO 0.66 0.56, 0.75
High Attenuation Area, HAA% 0.59 0.50, 0.68
Visual Fibrosis Score, fibrosis% 0.69 0.61, 0.77
Quantitative Interstitial Score, interstitial% 0.65 0.54, 0.75
Percentage of Interstitial Disease Occupied by Honeycombing, Honeycombing%
imaging. In addition, using the local histogram and dis-tance based approach we were able to specifically evalu-ate the association of a particular radiographic tissue type with more severe disease. This method, while in many ways more complex than densitometry, provides a more intuitive result: the percentage of lung occupied by interstitial disease. This simplicity may make this method more clinically usable than other, less intuitive measures. The local histogram based approach may also be more accurate than densitometry in subjects who have both emphysema and IPF as low attenuation em-physematous areas may confound whole lung densito-metric measures. Future studies will be needed to evaluate this possibility, as well as to compare the per-formance of this method against other densitometric, local histogram, and textural analysis based approaches [6–13, 16, 17, 37]. Finally, while the local histogram and distance based approach is a somewhat complex method to initially deploy, if validated, then it could be easily scaled to analyze as many CT scans as desired, without the need for time consuming visual reads by a single expert, and with the reproducibility that may be lacking if visual analysis is performed by multiple experts. This scalability would allow its use in potentially much larger research and clinical cohorts.
This study does have several weaknesses, including the small sample size, the single center retrospective design, the use of a cohort with biopsy proven and very severe disease, the inclusion of training cases in the final ana-lysis, and the need to augment the automated lung segmentation with manual editing in the majority of the cases. Of particular note are the sample size, which limited our ability to adjust for other covariates in the mortality models, and the disease severity based both on the percentages of interstitial disease and the high rates of death and transplant, which potentially limit generalizability to those patients with less severe disease. The latter limitation is likely due in part to the fact that as a tertiary referral and transplant cen-ter, many of the patients we see have more advanced disease, as well as because of our choice to only in-clude those patients with biopsy proven IPF. We chose to include only those with biopsy proven IPF to ensure that our findings were related to that dis-ease in particular, however, it should be noted that during the visual review process it was noted that the vast majority of subjects did have visual CT findings highly consistent with IPF, suggesting that based on current guidelines a significant number of the biop-sies may not have been performed. Finally, while the relatively high percentages of objectively defined inter-stitial changes and honeycombing seen in our study are to some extent likely due to the disease severity in the cohort, and while the visual fibrosis score and
objective interstitial score were highly correlated, the large absolute difference between the objective and visual measures suggests that there is likely some over classification of normal tissue as diseased. This may be due to the significant radiographic noise present in the clinically acquired CT scans used for this study, and additional work is needed using both established and novel de-noising techniques to account for this issue [38].
In addition to the aforementioned need for replication in larger and less diseased cohorts, other areas of future research include investigating if longitudinal changes in CT measurements correlate with clinical and physiologic decline, and, if so, if they are affected in a measurable way by the new therapeutic agents for IPF. If this were the case, then these measurements may serve as valuable surrogate endpoints in clinical trials.
Conclusions
This study of clinically acquired data in patients with bi-opsy proven IPF demonstrated that both densitometric and feature based quantitative CT measurements were associated in FVC% and DLCO%, as well as with trans-plant free survival. In addition, GAP scores that incorp-orate quantitative CT measures in place of either DLCO or visual CT measures are associated with transplant free survival. Further work is needed to replicate these associations in larger and less severely diseased cohorts and to determine if changes in CT measurements over time correlate with other markers of disease severity or with outcomes such as respiratory exacerbations and death.
Endnote 1
Note that paraseptal emphysema was specifically not included because of prior experience which revealed its frequent misclassification as normal tissue, and that no panlobular emphysema was identified during the train-ing process.
Additional file
Additional file 1:Technical Supplement. (ZIP 73 kb)
Abbreviations
objectively identified interstitial radiographic features in place of the diffusing capacity for carbon monoxide; HAA%: Percent high attenuating area; Honeycombing%: Percentage of objectively identified interstitial radiographic features made up by the honeycombing subtype; ILD: Interstitial lung disease; IPF: Idiopathic pulmonary fibrosis; LH: Local histogram; MLD: Mean lung density; Objective interstitial score interstitial%: Percentage of lung occupied by objectively identified interstitial radiographic features; PFT: Pulmonary function test; UIP: Usual interstitial pneumonia; Visual fibrosis score: fibrosis%, Percentage of lung occupied by visually identified interstitial features
Acknowledgements
The authors would like to acknowledge the patients who agreed to be part of the Herlihy Registry.
Funding
This work was supported by a generous gift from the family of David E. Herlihy to the Interstitial Diseases Group at Brigham and Women’s Hospital for the creation of the David E. Herlihy Data Registry and DNA Repository. This work was also supported by NIH grants: 5-T32-HL007633-30 (Ash), R01-HL107246 (Washko, Estepar, Harmouche, Onieva Onieva), R01-HL116933 (Washko, Estepar, Ross, Harmouche, Onieva Onieva), P01-HL114501 (Rosas, Washko), R01-HL089856 (Washko, Estepar, Ross), 1-K23-HL119558-01A1 (Doyle), and 5-K23-HL114735 (Come).
Availability of data and material
The data from the Herlihy Registry and from this project in particular are not yet publically available due to institutional review board restrictions. The program and extension used for image analysis, 3D Slicer and the Chest Imaging Platform, are open source programs available at https://www.slicer.org/ and http://chestimagingplatform.org.
Authors’contributions
Study concept and design:SYA, RH, JCR, RSJE, GRW;Acquisition, analysis, or
interpretation of data:All authors;Drafting of the manuscript:All authors,
Intellectual Content:All authors;Statistical analysis:SYA, GWR;Obtained
funding:GWR, RSJE, IOR;Administrative, technical or material support:SYA, RH,
JCR, RSJE, JOO;Study supervision:GWR, RSJE. All authors read and approved the final manuscript.
Competing interests
GRW reports consultancies from GlaxoSmithKline, Genetech and Boehringer Ingelheim.
Consent for publication
No consent for publication was required.
Ethics approval and consent to participate
No ethics approval was required for this study. This study was approved by the Partners Institutional Review Board (Protocol Number 2012-P-000840/1).
Author details
1Division of Pulmonary and Critical Care Medicine, Department of Medicine,
Brigham and Women’s Hospital, 75 Francis St., PBB, CA-3, Boston, MA 02115, USA.2Laboratory of Mathematics in Imaging, Department of Radiology, Brigham and Women’s Hospital, 1249 Boylston St, Boston, MA 02115, USA. 3NIHR Southampton Respiratory Biomedical Research Unit, Southampton
Centre for Biomedical Research, Southampton General Hospital, Tremona Road MP218, Southampton SO16 6YD, UK.4Department of Biology, Creighton University, 2500 California Plaza, Omaha, NE 68178-0324, USA.
Received: 15 July 2016 Accepted: 23 February 2017
References
1. Martinez FJ, Safrin S, Weycker D, Starko KM, Bradford WZ, King Jr TE, Flaherty KR, Schwartz DA, Noble PW, Raghu G, Brown KK. The clinical course of patients with idiopathic pulmonary fibrosis. Ann Intern Med. 2005;142:963–7.
2. Fernandez Perez ER, Daniels CE, Schroeder DR, St Sauver J, Hartman TE, Bartholmai BJ, Yi ES, Ryu JH. Incidence, prevalence, and clinical course
of idiopathic pulmonary fibrosis: a population-based study. Chest. 2010;137:129–37.
3. Ley B, Ryerson CJ, Vittinghoff E, Ryu JH, Tomassetti S, Lee JS, Poletti V, Buccioli M, Elicker BM, Jones KD, et al. A multidimensional index and staging system for idiopathic pulmonary fibrosis. Ann Intern Med. 2012;156:684–91. 4. Ley B, Collard HR, King Jr TE. Clinical course and prediction of survival in idiopathic pulmonary fibrosis. Am J Respir Crit Care Med. 2011;183:431–40. 5. Raghu G, Collard HR, Egan JJ, Martinez FJ, Behr J, Brown KK, Colby TV,
Cordier JF, Flaherty KR, Lasky JA, et al. An official ATS/ERS/JRS/ALAT statement: idiopathic pulmonary fibrosis: evidence-based guidelines for diagnosis and management. Am J Respir Crit Care Med. 2011;183:788–824. 6. Best AC, Meng J, Lynch AM, Bozic CM, Miller D, Grunwald GK, Lynch DA.
Idiopathic pulmonary fibrosis: physiologic tests, quantitative CT indexes, and CT visual scores as predictors of mortality. Radiology. 2008;246:935–40. 7. Rosas IO, Yao J, Avila NA, Chow CK, Gahl WA, Gochuico BR. Automated
quantification of high-resolution CT scan findings in individuals at risk for pulmonary fibrosis. Chest. 2011;140:1590–7.
8. Coxson HO, Hogg JC, Mayo JR, Behzad H, Whittall KP, Schwartz DA, Hartley PG, Galvin JR, Wilson JS, Hunninghake GW. Quantification of idiopathic pulmonary fibrosis using computed tomography and histology. Am J Respir Crit Care Med. 1997;155:1649–56.
9. Iwasawa T, Asakura A, Sakai F, Kanauchi T, Gotoh T, Ogura T, Yazawa T, Nishimura J, Inoue T. Assessment of prognosis of patients with idiopathic pulmonary fibrosis by computer-aided analysis of CT images. J Thorac Imaging. 2009;24:216–22.
10. Hartley PG, Galvin JR, Hunninghake GW, Merchant JA, Yagla SJ, Speakman SB, Schwartz DA. High-resolution CT-derived measures of lung density are valid indexes of interstitial lung disease. J Appl Physiol. 1994;76:271–7. 11. Kim HJ, Brown MS, Chong D, Gjertson DW, Lu P, Coy H, Goldin JG.
Comparison of the quantitative CT imaging biomarkers of idiopathic pulmonary fibrosis at baseline and early change with an interval of 7 months. Acad Radiol. 2015;22:70–80.
12. Sverzellati N, Calabro E, Chetta A, Concari G, Larici AR, Mereu M, Cobelli R, De Filippo M, Zompatori M. Visual score and quantitative CT indices in pulmonary fibrosis: Relationship with physiologic impairment. Radiol Med. 2007;112:1160–72.
13. Xu Y, van Beek EJ, Hwanjo Y, Guo J, McLennan G, Hoffman EA. Computer-aided classification of interstitial lung diseases via MDCT: 3D adaptive multiple feature method (3D AMFM). Acad Radiol. 2006;13:969–78. 14. Jacob J, Bartholmai BJ, Rajagopalan S, Kokosi M, Nair A, Karwoski R,
Walsh SL, Wells AU, Hansell DM. Mortality prediction in IPF: evaluation of automated computer tomographic analysis with conventional severity measures. Eur Respir J 2016.
15. Salisbury ML, Lynch DA, van Beek EJ, Kazerooni EA, Guo J, Xia M, Murray S, Anstrom KJ, Yow E, Martinez FJ, et al. Idiopathic Pulmonary Fibrosis: Adaptive Multiple Features Method Fibrosis Association with Outcomes. Am J Respir Crit Care Med 2016.
16. Ley B, Elicker BM, Hartman TE, Ryerson CJ, Vittinghoff E, Ryu JH, Lee JS, Jones KD, Richeldi L, King Jr TE, Collard HR. Idiopathic pulmonary fibrosis: CT and risk of death. Radiology. 2014;273:570–9.
17. Best AC, Lynch AM, Bozic CM, Miller D, Grunwald GK, Lynch DA. Quantitative CT indexes in idiopathic pulmonary fibrosis: relationship with physiologic impairment. Radiology. 2003;228:407–14.
18. Castaldi PJ, San Jose Estepar R, Mendoza CS, Hersh CP, Laird N, Crapo JD, Lynch DA, Silverman EK, Washko GR. Distinct quantitative computed tomography emphysema patterns are associated with physiology and function in smokers. Am J Respir Crit Care Med. 2013;188:1083–90. 19. Ash SY, Harmouche R, Ross JC, Diaz A, Hunninghake GM, Putman RK,
Onieva J, Martinez FJ, Choi AM, Hatabu H, et al. The objective identification and quantification of interstitial lung abnormalities in smokers. Acad Radiol In press.
20. Ley B, Collard HR. Risk prediction in idiopathic pulmonary fibrosis. Am J Respir Crit Care Med. 2012;185:6–7.
21. Ross JC, San Jose Estepar R, Kindlmann G, Diaz A, Westin CF, Silverman EK, Washko GR. Automatic lung lobe segmentation using particles, thin plate splines, and maximum a posteriori estimation. Med Image Comput Comput Assist Interv. 2010;13:163–71.
23. Mendoza CS, Washko GR, Ross JC, Diaz AA, Lynch DA, Crapo JD, Silverman EK, Acha B, Serrano C, Estepar RS. Emphysema Quantification in a Multi-Scanner Hrct Cohort Using Local Intensity Distributions. Proc IEEE Int Symp Biomed Imaging 2012:474-477.
24. Lynch DA, Godwin JD, Safrin S, Starko KM, Hormel P, Brown KK, Raghu G, King Jr TE, Bradford WZ, Schwartz DA, et al. High-resolution computed tomography in idiopathic pulmonary fibrosis: diagnosis and prognosis. Am J Respir Crit Care Med. 2005;172:488–93.
25. Lin DY, Wei LJ, Ying Z. Checking the Cox model with cumaltive sums of martingale-based residuals. Biometrika. 1993;80:557–72.
26. Pencina MJ, D'Agostino RB. Overall C as a measure of discrimination in survival analysis: model specific population value and confidence interval estimation. Stat Med. 2004;23:2109–23.
27. C-statistics for survival data. [http://ncook.bwh.harvard.edu/sas-macros.html] 28. Mogulkoc N, Brutsche MH, Bishop PW, Greaves SM, Horrocks AW, Egan JJ,
Greater Manchester Pulmonary Fibrosis C. Pulmonary function in idiopathic pulmonary fibrosis and referral for lung transplantation. Am J Respir Crit Care Med. 2001;164:103–8.
29. Battista G, Zompatori M, Fasano L, Pacilli A, Basile B. Progressive worsening of idiopathic pulmonary fibrosis. High resolution computed tomography (HRCT) study with functional correlations. Radiol Med. 2003;105:2–11. 30. Shin KM, Lee KS, Chung MP, Han J, Bae YA, Kim TS, Chung MJ. Prognostic
determinants among clinical, thin-section CT, and histopathologic findings for fibrotic idiopathic interstitial pneumonias: tertiary hospital study. Radiology. 2008;249:328–37.
31. Sumikawa H, Johkoh T, Colby TV, Ichikado K, Suga M, Taniguchi H, Kondoh Y, Ogura T, Arakawa H, Fujimoto K, et al. Computed tomography findings in pathological usual interstitial pneumonia: relationship to survival. Am J Respir Crit Care Med. 2008;177:433–9. 32. Flaherty KR, Thwaite EL, Kazerooni EA, Gross BH, Toews GB, Colby TV,
Travis WD, Mumford JA, Murray S, Flint A, et al. Radiological versus histological diagnosis in UIP and NSIP: survival implications. Thorax. 2003;58:143–8.
33. Wells AU, Desai SR, Rubens MB, Goh NS, Cramer D, Nicholson AG, Colby TV, du Bois RM, Hansell DM. Idiopathic pulmonary fibrosis: a composite physiologic index derived from disease extent observed by computed tomography. Am J Respir Crit Care Med. 2003;167:962–9.
34. Walsh SL, Calandriello L, Sverzellati N, Wells AU, Hansell DM, Consort UIPO. Interobserver agreement for the ATS/ERS/JRS/ALAT criteria for a UIP pattern on CT. Thorax. 2016;71:45–51.
35. Rienmuller RK, Behr J, Kalender WA, Schatzl M, Altmann I, Merin M, Beinert T. Standardized quantitative high resolution CT in lung diseases. J Comput Assist Tomogr. 1991;15:742–9.
36. Bartholmai BJ, Raghunath S, Karwoski RA, Moua T, Rajagopalan S, Maldonado F, Decker PA, Robb RA. Quantitative computed tomography imaging of interstitial lung diseases. J Thorac Imaging. 2013;28:298–307. 37. Iwasawa T, Ogura T, Sakai F, Kanauchi T, Komagata T, Baba T, Gotoh T,
Morita S, Yazawa T, Inoue T. CT analysis of the effect of pirfenidone in patients with idiopathic pulmonary fibrosis. Eur J Radiol. 2014;83:32–8. 38. Kim HJ, Li G, Gjertson D, Elashoff R, Shah SK, Ochs R, Vasunilashorn F,
Abtin F, Brown MS, Goldin JG. Classification of parenchymal abnormality in scleroderma lung using a novel approach to denoise images collected via a multicenter study. Acad Radiol. 2008;15:1004–16.
• We accept pre-submission inquiries
• Our selector tool helps you to find the most relevant journal
• We provide round the clock customer support
• Convenient online submission
• Thorough peer review
• Inclusion in PubMed and all major indexing services
• Maximum visibility for your research
Submit your manuscript at www.biomedcentral.com/submit