CAREGIVER CHARACTERISTICS ASSOCIATED WITH PHYSICIAN-BASED PREVENTIVE ORAL HEALTH SERVICE (PB-POHS)
Alexandra AC Boudreau
A thesis submitted to the faculty at the University of North Carolina at Chapel Hill in partial fulfillments of the requirements for the degree in Master in Science in the School of Dentistry
(Pediatric Dentistry).
Chapel Hill 2015
Approved by:
Jessica Lee Kimon Divaris
William Vann
ii
©2015
ABSTRACT
Alexandra AC Boudreau: Caregiver Characteristics Associated with Physician-Based Preventive
Oral Health Services (PB-POHS)
(Under the direction of Jessica Lee)
BACKGROUND: Most states have adopted Physician-Based Preventive Oral Health Services
(PB-POHS) to address challenges related to the oral health care for young children. Our aims
were to describe caregiver and child characteristics of children who received PB-POHS versus
those who did not, while comparing characteristics of children receiving the optimal number of
PB-POHS to those not.
METHODS: We examined a cohort of 1,405 child-caregiver dyads enrolled in the Carolina Oral
Health Literacy (COHL) Study. Caregivers completed a structured interview and each child’s
Medicaid medical, dental and hospital claims for the three-year period of study was evaluated.
RESULTS: Our analytical sample included 831 children. Sixty-four percent received PB-POHS;
only 11% received the optimal number of visits. Other than county of residence, there were no
significant differences in caregiver characteristics among recipients and non-recipients of
PB-POHS.
CONCLUSIONS: PB-POHS programs may overcome the traditional barriers to dental care
iv
TABLE OF CONTENTS
LIST OF TABLES………..….…….…...vi
LIST OF ABBREVATIONS………vii
INTRODUCTION………...1
Overview of Early Childhood Caries ………1
Access to Dental Services for Young Children……….2
Models of Preventive Oral Health Services in the Medical Arena……….2
PB-POHS from the Physicians’ Perspective……….3
Caregiver Characteristics of Children Receiving PB-POHS……….…….3
Significance……….……4
Specific Aims………...4
METHODS……….….6
Study Design and Sample ……….…6
Data Collection………....6
Analytical Strategy………..8
RESULTS……….9
DISCUSSION……….………12
CONCLUSIONS..……….……….15
TABLES...………...……….16
vi
LIST OF TABLES
Table 1.1 – Sociodemographic Characteristics of the Analytical Cohort of COHL
Child-caregiver dyads.………16
Table 1.2 – Sociodemographic Characteristics of the Analytical Cohort of COHL
Child-caregiver dyads.………....18
Table 2.1 – County of residence and receipt of PB-POHS among the analytical
cohort of COHL Child-caregiver dyads.…….………20
Table 2.2 – County of residence and receipt of PB-POHS among the analytical
cohort of COHL Child-caregiver dyads.…….………....21
Table 3 – Sociodemographic Characteristics of Children who received only
PB-POHS (and no dental office based services)……….22
Table 4 – Predicted (marginal) probabilities of receiving any PB-POHS for strata of race and country of residence after multivariate logistic regression modeling adjusting for caregivers’ race, county of residence, health literacy, and children’s
LIST OF ABBREVIATIONS
ECC Early Childhood Caries COHL Carolina Oral Health Literacy FPL Federal Poverty Level
GED General Educational Development
IMB Into the Mouth of Babes
NC North Carolina
NHANES National Health and Nutrition Examination Survey
PB-POHS Physician Based Preventive Oral Health Services
REALD-30 Rapid Estimate of Adult Health Literacy in Dentistry
INTRODUCTION
Overview of Early childhood caries (ECC)
t well-documented that early childhood caries (ECC) is the most common chronic disease
of childhood1,2 and despite many professional and public health initiatives to increase awareness
and prevention, it remains an important public health problem3.Importantly, the burden of ECC
is characterized by marked disparities4 and disproportionately affects children from low-income
families5. As one example, children from families with incomes below 200% the federal poverty
level (FPL) are three times more likely to have unmet overall healthcare needs, which are
overwhelmingly of dental origin6.
Up until recently the prevalence of caries had been increasing in pre-school aged
children. NHANES data from 2011-2012 showed that 23% of 2-5 year olds had dental caries, a
reduction from the previously reported 27% in 1999-20027,8. The prevalence of caries had been
increasing in North Carolina (NC) preschool aged children in the early 2000’s but presently rates
are declining9. Elevated birthrates and barriers in access to care among low-income families were
cited as reasons for the increase in rates of decay in NC children ages 0-310. Recent NC
surveillance data reports both a 14% decrease in dmft scores and an increase in treatment of
dental disease in preschool aged children from 2004-2009. However, while oral health conditions
are improving state-wide, disparities still exist as 18 NC counties had 25% of children entering
Access to Dental Services for Young Children
Access to dental care is a major barrier for the prevention and treatment of dental caries.
Mouradian and colleagues12 reported barriers to dental services including a 1) scarcity of area
dentists, 2) lack of area dentists accepting Medicaid, 3) shortage of pediatric dentists, 4) lack of
individuals’ knowledge and attitudes concerning oral health, and 5) the challenges of culturally
diverse populations, and 6) problems intrinsic to Medicaid. In NC, barriers in access to care
have not been studied systematically; however, 84 of the state’s 100 counties are designated as
dental shortage areas13.
Models of Preventative Oral Health Services in the Medical Arena
The disparity in access to dental services has helped promote models of delivering
preventative oral health services in medical practices. NC developed one of the first models in
2000. Called “Into the Mouths of Babes” (IMB), it is a physician-based oral health education,
disease prevention, and referral program. It provides Medicaid reimbursement for physicians,
nurse practitioners, and physician assistants to screen, perform oral health counseling, fluoride
varnish application, and referral for dental care. A major aim of IMB is to identify children ages
0-3 who are at high risk for dental disease, with subsequent early referral and the timely
establishment of a dental home 14 15. To date, 45 additional states have developed such programs 16 17.
Physician-based preventative oral health service (PB-POHS) programs have the potential
to circumvent traditional barriers of access to oral health care services and help improve young
children’s oral health. Primary care providers can identify dental caries in young children18,
3
environment, disease prevention and reduction are achievable20 for high-risk children. Indeed, in
defining optimal IMB utilization as ≥ 4 visits, Pahel and colleagues10 simulated data to estimate a
caries reduction as high as 49% in 17 month olds whereas the actual reduction in caries-related
restorative treatments was 17% in 6 year olds.
PB-POHS from the Physicians’ Perspective
All available evidence indicates that physicians are willing to incorporate aspects of oral
health services into their practice. A national survey by Lewis and colleagues21 reported that 90%
of physicians believed they played an important role in identifying dental disease in their patients
and 74% said that they would be willing to apply topical fluoride22. Lewis and colleagues also
found that only 25% of physicians participating in a national survey received training in oral
health and many providers cited this lack of instruction as a reason for not delivering oral
health-related services23.
Caregiver Characteristics of Children Receiving PB-POHS
To date, most studies of Physician-Based Oral Health Services (PB-POHS) examine the
providers’ viewpoint and less is known regarding characteristics of caregiver-child dyads
receiving these services. Quinonez and colleagues24 examined Socio-demographics
characteristics, dental knowledge, and dental practices of caregivers of children with PB-POHS,
have been examined, finding that earlier timing of the first IMB visit, more children in the
family, and putting the child to bed with a bottle/sippy cup were associated with more visits.
However, the study did not include caregivers of children who did not receive PB-POHS. County
level variables have also been examined for both recipients and non-recipients finding that non
physicians had a higher likelihood for receiving PB-POHS. Counties with more dentists had a
decreased likelihood of having PB-POHS25. The literature however is sparse regarding caregiver
characteristics of non-recipients. Kranz and colleagues examined this population finding that
distance from physician’s office was not predictive of children receiving PBOHS while increased
distance to dental office was predictive of fewer dental office visits26. Little else regarding this
population has been reported.
Significance
A more detailed examination of caregiver characteristics of those children who do and do
not receive PB-POHS is an important question from a practical and public health perspective
because such data can guide the further deployment and scaling-up of PB-POHS programs. For
example, such information might reveal barriers in terms of usage of PB-POHS such as
geographical location, low caregiver literacy, low self-efficacy, etc. Insights into these
characteristics could facilitate better access to care by developing strategies to increase the
PB-POHS utilization. Increased penetration of PB-PB-POHS in a community, region, or state could help
maximize the program’s effectiveness and ultimately improve young children’s oral health.
Specific Aims
To summarize: the benefits of PB-POHS have been documented and although data are
still emerging, available evidence suggests that these programs are effective in preventing early
childhood dental disease. Program adoption from the perspective of medical providers has been
underscored22, 29, 23, 24, but examination of adoption by caregivers has received scant attention.
5
1) Describe caregiver characteristics of children who do and do not receive PB-POHS
visits.
2) Identify caregiver characteristics of children who receive an optimal number of (4 or
METHODS
Study design and sample
This investigation built upon a cohort of families enrolled in the IRB-approved Carolina
Oral Health Literacy (COHL), which enrolled 1,403 child-caregiver dyads in seven NC counties.
A detailed description of the study enrollment procedure has been reported previously27, 28.
COHL subjects were low-income, mostly female, and clients of the Special Supplemental
Nutrition Program for Women, Infants and Children (WIC). Eligibility criteria included: 1)
primary caretakers, 2) healthy children under age 5, 3) children eligible for Medicaid enrolled for
at least 11 of 12 months annually, and 4) the family’s primary language was English. The major
outcome of interest in the present study was receipt of PB-POHS as measured using medical
office Medicaid-paid claims for oral health services. For this reason, we limited our analytical
sample to a sub-set of COHL-enrolled children who were eligible for PB-POHS at study
enrollment and for the ensuing 12 months, effectively creating an additional exclusion criterion
of age equal or less than 30 months.
Data collection
Each caregiver completed a structured interview under the guidance of one of the two
trained study interviewers. The interview included questions on socio-demographic measures,
health literacy, and oral health status/behaviors. Health literacy in the oral health domain was
7
recognition-based test29. At the time of the study, REALD-30 had been validated only in the
English language. Medicaid medical, dental, and hospital claims during the calendar years 2008,
2009, and 2010 were obtained for each child enrolled in the COHL study.
Variable Definition and Measurement
PB-POHS were defined as a medical office visits with the submission of a Medicaid
claim (J type) for oral health services during calendar years 2008, 2009, and 2012. This included
oral evaluation/examination/screening (codes D0150, D0120, D0145), oral healthcare
instructions (code D1330), and/or topical fluoride/varnish application (codes D1203, D1206). To
enumerate PB-POHS and dental visits prior to study enrollment we collected and analyzed
Medicaid claims data spanning the entire lifetime of the enrolled children. We relied upon two
definitions of PB-POHS. First, we considered a dichotomous definition of POHS, having any
versus no visits. Second, we examined another binary outcome of “optimal number of POHS”, 4
or more visits versus less (0-3).
Our explanatory variables included the following caregiver characteristics: literacy, level
of education, self-efficacy, oral health knowledge, number of children, and marital status. The
child’s age also served as an explanatory variable. Literacy was measured using the REALD-30
score in two ways. First we examined literacy using a continuous measure, where 0 is the lowest
and 30 the highest level of literacy. Next we examined categorical definitions as previous studies
have classified literacy as inadequate (<13) and adequate (≥13) 30.Self-efficacy was measured
with the general self-efficacy scale 31; self-efficacy scores range from 10 (lowest self-efficacy) to
40 (highest self-efficacy). Caregivers’ education was self-reported and coded as 1= less than high
Race was self-identified as white, African American, or American Indian. Age was measured in
years and continuous and categorical definitions were explored. Marital status was defined as
single, married; divorced/separated; other.
Analytical Strategy
We relied on descriptive methods to generate frequency distributions, simple proportions,
and cross-tabulations of variables of interest. To test the associations between receipt of any
(Specific Aim 1) and optimal number of PB-POHS (Specific Aim 2) and caregivers’
characteristics we first used bivariate methods including chi-square for categorical variables and
t-test for continuous variables. We also considered a 3-level categorical definition of PB-POHS
wherein children were classified as having received no (0), “some” (1-3), or the “optimal
number” (≥4) of visits, and examined its association with caregivers’ characteristics with
chi-square tests and analyses of variance (ANOVA). To disentangle possible associations between
independent variables and receipt of PB-POHS we constructed logistic regression models,
adjusting for covariates that were statistically associated (P<0.05) with PB-POHS at the bivariate
level as well as children’s age, county of residence, and follow-up time. We then reported
adjusted predicted probabilities and 95% confidence intervals (CI) of having received PB-POHS
for strata of interest using marginal effects estimation (Williams R, Stata J, 2012). To examine
the robustness of our findings and gain additional insights on the group of children who were
exclusive PB-POHS users (i.e., had no dental office-based care evidenced by their Medicaid
claims) we conducted additional analyses among that subset of participants. All analyses were
conducted using the statistical software STATA version 13.1 (StataCorp LP, College Station,
9
RESULTS
From the 1,403 child-caregiver dyads enrolled in the COHL cohort, 831 subjects met our
inclusion criteria. The sample’s descriptive information is presented in Table 1. Most children
were African American (n=340, 41%), followed by white (n=322, 39%) and American Indian
(n=161, 20%). The overwhelming majority of caregivers were female (96%) and their mean age
was 26 years. At the time of the baseline interview, the majority of children were between the
ages of 0-11 months (59%), with fewer falling in the 12-23 month (29%) and 24-29 month
(13%) age groups. Most caregivers had high school/GED or higher level of education with only
24% having not completed high school. Two-thirds of caregivers reported themselves as single,
with 23% reporting as married and 8% as divorce/separated or other.
The mean literacy score was 15.5 points on the 30-point REALD-30 scale, with the
majority of caregivers having an adequate level of health literacy (≥13 score). The vast majority
(97%) reported their children as having good, very good, or excellent oral health.
The analytical cohort was followed for an average 24 months (range: 18-30). During that
follow-up period, 528 children (64%) received some PB-POHS. There were few differences
between PB-POHS recipients and non-recipients. Race and health literacy were the only domains
where a statistically significant difference were noted. A markedly higher percentage (77%) of
American Indians received PB-POH services than blacks (66%) and whites (55%). A similar
bivariate association was noted in the domain of health literacy, with low-literacy participants
61%; P=o.03). However, the mean literacy score was slightly higher (15.7 versus 15.3) among
non-recipients.
There were only 93 children (11%) who received the optimal (≥4) number of PB-POH
visits (Tables 1A and B). Similar to the receipt of any versus no services, we found few
statistically significant differences between those who did and those who did not receive the
optimal number of visits. On average, those receiving the optimal number of visits were two
months older than children who did not receive and were followed up for one month longer. We
found no significant association of health literacy with receipt of optimal number of services. On
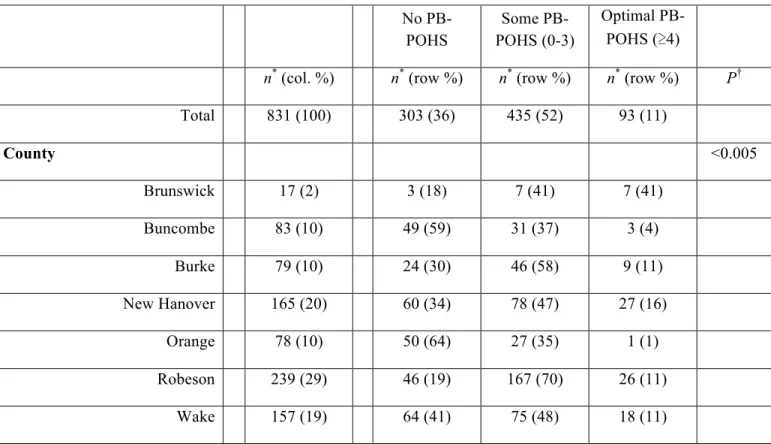
the other hand, county of residence had a major influence on the receipt of services. Brunswick
and Robeson counties had the highest percentage of receivers (82% and 81% respectively), while
Buncombe and Orange had the fewest (41% and 36% respectively). Brunswick County had the
most optimal receivers (41%) and again, Buncombe and Orange had the fewest. The other
counties had more comparable breakdowns.
A substantial number of children (338, or 64%) received exclusively PB-POHS and no
dental office-based visits. Fifty-seven (17%) of these children received the optimal number of
visits. Again, there were very few statistically significant findings between those receiving
fewer than optimal services and those receiving the optimal number of services (Table 3), and
these were with regard to socio-demographic characteristics (caregivers’ and children’s age) and
follow-up time. The average follow-up time was actually one month shorter in the optimal group
as compared with the suboptimal group.
Table 4 presents the crude and adjusted logistic regression-predicted probabilities of
11
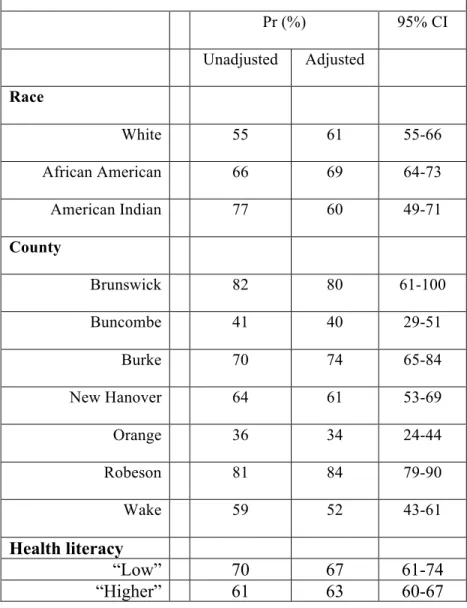
children’s age a priori and follow-up time, and an additional term for health literacy. It was
noteworthy that racial and health literacy differences diminished after adjustment, while county
DISCUSSION
In this study among a community-based cohort of approximately 800 child-caregiver
dyads, we found that location (county of residence) was the main predictor of a child’s receiving
PB-POHS over a two-year period. With the exception of race (an association that diminished
after adjustment for county of residence), caregivers’ characteristics (i.e., age and education)
were not associated with receipt of these oral health services. This observation has important
implications for improving young children’s access to preventive oral health services because it
underscores that PB-POHS may circumvent traditional barriers of dental care-seeking at the
caregiver level (e.g., education, number of children, general self-efficacy). Accordingly,
PB-POHS may help decrease oral health disparities among this vulnerable population.
This is the first study to examine caregiver characteristics including children who
received versus those who did not receive PB-POHS. The finding of essentially no differences in
caregiver characteristics between the two groups other than county of residence is a finding of
important significance. Visits to pediatricians’ offices for routine well-care are virtually
universal among this very young group of children, and caregivers’ characteristics should not be
a major influence, and this finding was illuminated in this study. At the same time, some
caregivers’ characteristics (including caregivers’ dental neglect) are strong predictors of
children’s entry into the dental care (dental office-based) system and thus may contribute to
13
examination of other characteristics specific to the caregiver and child, such as child’s disease
status or caregiver’s reported oral health status may capture differences not found in this study.
The current findings are most noteworthy in demonstrating that preventative oral health
services delivered in physicians’ offices may be a means to overcome traditional barriers
encountered with receiving dental care, including a paucity of dentists accepting Medicaid, a
shortage of pediatric dentists, and lack of individuals’ knowledge and attitudes concerning oral
health12. This finding carries strong policy implications for state and federal support of
PB-POHS. Although children are receiving more PB-POHS still only a small amount (11%) received
the optimal number of visits programs and policies should be aimed to increase the number of
children receiving the recommended four or more visits.
In light of these findings perhaps the focus should be shifted on to physicians to increase
adoption and provision of these services. The literature supports that a positive dental referral
environment leads to more physicians adopting preventative oral health services in their
practices32, 33 highlighting the importance of a collaborative relationship between community
physicians and dentists. Implementation of office-based systems such as sticky note reminders in
the charts; risk assessment tools, chart screening, flow sheets, enhances well child visit forms has
been found to increase delivery of preventative services in physician offices34 and changes in
policy are more likely to result in lasting changes with provision of care35,
Our findings should be viewed in the context of a few limitations. While this
study boasts a relatively large, community-based non-dental care seeking study sample and a
selection bias may be an issues as our sample likely reflects characteristics found in a user
population36. In NC PB-POHS are administered at roughly 40% of well-child visits, while we are
not able to compare these statistics directly, 64% of our sample received some PB-POHS which
may be interpreted as a high rate of utilization9. At the same time, the WIC population has also
been found to be at the highest risk for dental disease5. Because our cohort comprised a
convenience sample of WIC clients, inferences regarding the influence of the county of residence
should be made with caution. Participant groups by county of residence should be best
interpreted as “caregivers interviewed in WIC programs” in each county; moreover, it is likely
that county-level differences are reflected or are influenced by medical practice characteristics;
however, collection and examination of medical practice or provider level-specific information
was beyond the scope this study. Future investigations should examine the influence of medical
office and provider characteristics on the delivery of oral health services. An examination of
systematic differences between our sample’s composition, the WIC population and each county’s
population and use of medical and dental services could only be accomplished via the study of a
sample designed to be representative of WIC programs and/or counties.
At the time of the study REALD-30 was only validated in English thus our sample
comprised English-speaking families only—this precludes generalization of our findings to
Spanish-speaking families. Reliance on Medicaid paid claims implies that free care or services
sought outside the Medicaid network were not captured in the claims data. However, we
anticipate that most care-seeking of Medicaid-enrollees would take place within the Medicaid
15
CONCLUSIONS
Under the conditions of this study we conclude that:
1) There are no significant differences in caregiver characteristics among those who did and
not receive PB-POHS services.
2) County-level differences in receipt of services were noted and should be investigated
further.
3) The PB-POHS program may overcome the traditional predisposing and enabling barriers
TABLE 1.1 Sociodemographic Characteristics of the Analytical Cohort of COHL Child-Caregiver Dyads (n = 831)
No PB-POHS PB-POHS 4+ visits
n* (col. %) n* (row %) n * (row
%) P† n* (row %) P†
Total 831 (100) 303 (36) 528 (64) 93 (11)
Race <0.00
1
0.1
White 322 (39) 145 (45) 177 (55) 28 (9)
African American 340 (41) 117 (34) 223 (66) 46 (14)
American Indian 161 (20) 37 (23) 124 (77) 19 (12)
Caregiver’s sex 0.4 0.1
Male 32 (4) 14 (44) 18 (56) 1 (3)
Female 799 (96) 289 (36) 510 (64) 92 (12)
Caregiver’s age (tertiles; range)
mean
(SD) 0.2 0.1
Q1 (18.0, 22.4) 20.4 (1.2) 91 (33) 186 (67) 23 (8)
Q2 (22.4, 27.6) 24.8 (1.5) 102 (37) 176 (63) 39 (14)
Q3 (27.6, 60.9) 34.2 (5.8) 110 (40) 166 (60) 31 (11)
continuous 26.4 (6.8) 26.8 (6.6) 26.3 (6.9) 0.3 27.6 (7.8) 0.09
Child’s age (months; at
baseline interview) 0.8 0.06
0-11 487 (59) 174 (36) 313 (64) 45 (9)
12-23 237 (29) 87 (37) 150 (63) 30 (13)
24-29 107 (13) 42 (39) 65 (61) 18 (17)
continuous 11.1 (9.0) 11.3 (9.0) 10.9 (9.0) 0.5 13.1 (8.9) 0.02
Education 0.7 0.6
<HS 196 (24) 67 (34) 129 (66) 19 (10)
HS/GED 332 (40) 122 (37) 210 (63) 41 (12)
17
Marital status 0.3 0.8
Single 572 (69) 199 (35) 373 (65) 66 (12)
Married 193 (23) 76 (39) 117 (61) 21 (11)
Divorced/separated/other 66 (8) 28 (42) 38 (58) 6 (9)
Number of children 0.4 1.0
1 395 (48) 134 (34) 261 (66) 44 (11)
2 248 (30) 92 (37) 156 (63) 28 (11)
3 106 (13) 45 (42) 61 (58) 12 (11)
≥4 80 (10) 32 (40) 48 (60) 9 (11)
Health literacy 0.03 1.0
“low” REALD-30 (<13) 207 (25) 62 (30) 145 (70) 23 (11)
“higher” REALD-30 (≥13) 624 (75) 241 (39) 383 (61) 70 (11)
Mean REALD-30 (SD) 15.5 (5.2) 15.7 (5.1) 15.3 (5.2) 0.2 15.3 (4.8) 0.8
General self-efficacy
Mean GSEF-10 (SD) 33.4 (4.2) 33.5 (3.9) 33.4 (4.3) 0.7 33.3 (4.5) 0.7
Children’s oral health 0.3 0.3
Excellent/Very good/Good 460 (97) 172 (37) 288 (63) 63 (14)
Fair/Poor 13 (3) 3 (23) 10 (77) 3 (23)
Follow-up time (months) 23.5 (4.3) 23.4 (4.9) 23.6 (3.9) 0.5 24.6 (3.4) 0.007
*estimates among participants with non-missing information in stratum; †corresponding to X2 tests for categorical
TABLE 1.2 Sociodemographic Characteristics of the Analytical Cohort of COHL Child-Caregiver Dyads (n = 831) No PB-POHS Some PB-POHS (0-3) Optimal PB-POHS (≥4)
n* (col. %) n* (row %) n* (row %) n* (row %) P†
Total 831 (100) 303 (36) 435 (52) 93 (11)
Race <0.005
White 322 (39) 145 (45) 149 (46) 28 (9)
African American 340 (41) 117 (34) 177 (52) 46 (14)
American Indian 161 (20) 37 (23) 105 (65) 19 (12)
Caregiver’s sex 0.3
Male 32 (4) 14 (44) 17 (53) 1 (3)
Female 799 (96) 289 (36) 418 (52) 92 (12)
Caregiver’s age (tertiles;
range) mean (SD) 0.1
Q1 (18.0, 22.4) 20.4 (1.2) 91 (33) 184 (58) 23 (8)
Q2 (22.4, 27.6) 24.8 (1.5) 102 (37) 130 (50) 39 (14)
Q3 (27.6, 60.9) 34.2 (5.8) 110 (40) 121 (48) 31 (11)
continuous 26.4 (6.8) 26.8 (6.6) 26.0 (6.6) 27.6 (7.8) 0.07
Child’s age (months; at
baseline interview) 0.1
0-11 487 (59) 174 (36) 268 (55) 45 (9)
12-23 237 (29) 87 (37) 120 (51) 30 (13)
24-29 107 (13) 42 (39) 47 (44) 18 (17)
continuous 11.1 (9.0) 11.3 (9.0) 10.4 (8.9) 13.1 (8.9) 0.03
Education 0.8
19
HS/GED 332 (40) 122 (37) 169 (51) 41 (12)
Some college or higher 303 (36) 114 (38) 156 (51) 33 (11)
Marital status 0.6
Single 572 (69) 199 (35) 307 (54) 66 (12)
Married 193 (23) 76 (39) 96 (50) 21 (11)
Divorced/separated/other 66 (8) 28 (42) 32 (48) 6 (9)
Number of children 0.7
1 395 (48) 134 (34) 217 (55) 44 (11)
2 248 (30) 92 (37) 128 (52) 28 (11)
3 106 (13) 45 (42) 49 (46) 12 (11)
≥4 80 (10) 32 (40) 39 (49) 9 (11)
Health literacy 0.06
“low” REALD-30 (<13) 207 (25) 62 (30) 122 (59) 23 (11)
“higher” REALD-30 (≥13) 624 (75) 241 (39) 313 (50) 70 (11)
Mean REALD-30 (SD) 15.5 (5.2) 15.7 (5.1) 15.3 (5.3) 15.3 (4.8) 0.2
General self-efficacy
Mean GSEF-10 (SD) 33.4 (4.2) 33.5 (3.9) 33.4 (4.3) 33.3 (4.5) 0.9
Children’s oral health 0.5
Excellent/Very good/Good 460 (97) 172 (37) 225 (49) 63 (14)
Fair/Poor 13 (3) 3 (23) 7 (54) 3 (23)
Follow-up time (months) 23.5 (4.3) 23.4 (4.9) 23.4 (3.9) 24.6 (3.4) 0.03
*estimates among participants with non-missing information in stratum; †corresponding to X2 tests for categorical
TABLE 2.1 County of residence and receipt of PB-POHS services among the analytical cohort of COHL child-caregiver dyads (n = 831)
No PB-POHS
PB-POHS
4+ visits
n* (column %) n* (row %) n* (row %) P†
n* (row
%) P†
Total 831 (100) 303 (36) 528 (64) 93 (11)
County <0.0005 <0.0005
Brunswick 17 (2) 3 (18) 14 (82) 7 (41)
Buncombe 83 (10) 49 (59) 34 (41) 3 (4)
Burke 79 (10) 24 (30) 55 (70) 9 (11)
New Hanover 165 (20) 60 (34) 105 (64) 27 (16)
Orange 78 (10) 50 (64) 28 (36) 1 (1)
Robeson 239 (29) 46 (19) 193 (81) 26 (11)
Wake 157 (19) 64 (41) 93 (59) 18 (11)
21
TABLE 2.2 County of residence and receipt of PB-POHS services among the analytical cohort of COHL child-caregiver dyads (n = 831)
No PB-POHS
Some PB-POHS (0-3)
Optimal PB-POHS (≥4)
n* (col. %) n* (row %) n* (row %) n* (row %) P†
Total 831 (100) 303 (36) 435 (52) 93 (11)
County <0.005
Brunswick 17 (2) 3 (18) 7 (41) 7 (41)
Buncombe 83 (10) 49 (59) 31 (37) 3 (4)
Burke 79 (10) 24 (30) 46 (58) 9 (11)
New Hanover 165 (20) 60 (34) 78 (47) 27 (16)
Orange 78 (10) 50 (64) 27 (35) 1 (1)
Robeson 239 (29) 46 (19) 167 (70) 26 (11)
Wake 157 (19) 64 (41) 75 (48) 18 (11)
TABLE 3 Sociodemographic Characteristics of children who received only PB-POH (and no dental office-based) services during the study period (n = 338)
Some PB-POHS (1-3 visits)
Optimal PB-POHS (≥4 visits)
n* (col. %) n* (row %) P†
Total 338 (100) 57 (17)
Race 0.13
White 112 (34) 19 (17)
African American 131 (39) 28 (21)
American Indian 91 (27) 10 (11)
Caregiver’s sex 0.10
Male 13 (4) 0 (0)
Female 325 (96) 57 (18)
Caregiver’s age (tertiles; range) mean (SD) 0.08
Q1 (18.0, 21.7) 19.9 (1.0) 12 (11)
Q2 (21.8, 26.6) 23.7 (1.4) 24 (21)
Q3 (26.6, 60.9) 32.4 (5.5) 21 (19)
continuous 25.3 (6.8) 26.9 (7.5) 0.03
Child’s age (months; at baseline
interview) 0.02
0-11 241 (71) 32 (13)
12-23 74 (22) 18 (24)
24-29 23 (7) 7 (30)
continuous 8.4 (8.0) 13.1 (8.9) 0.002
Education 1.0
<HS 91 (27) 16 (18)
23
Some college or higher 111 (33) 18 (16)
Marital status 0.58
Single 256 (76) 41 (12)
Married 61 (18) 13 (11)
Divorced/separated/other 21 (6) 3 (9)
Number of children 0.84
1 182 (54) 29 (16)
2 89 (26) 15 (17)
3 36 (11) 8 (22)
≥4 30 (9) 5 (17)
Health literacy 0.26
“low” REALD-30 (<13) 98 (29) 13 (13)
“higher” REALD-30 (≥13) 240 (71) 44 (18)
Mean REALD-30 (SD) 15.1 (5.3) 15.7 (4.8) 0.32
General self-efficacy
Mean GSEF-10 (SD) 33.4 (4.2) 33.3 (4.5) 0.82
Children’s oral health 0.74
Excellent/Very good/Good 148 (98) 37 (25)
Fair/Poor 3 (2) 1 (33)
Follow-up time (months) 23.1 (3.8) 24.5 (3.5) 0.003
TABLE 4 Predicted (marginal) probabilities of receiving any PB-POHS for strata of race and county of residence after multivariate logistic regression modeling adjusting for caregivers’ race, county of residence, health literacy, and children’s age and follow-up time.
Pr (%) 95% CI
Unadjusted Adjusted
Race
White 55 61 55-66
African American 66 69 64-73
American Indian 77 60 49-71
County
Brunswick 82 80 61-100
Buncombe 41 40 29-51
Burke 70 74 65-84
New Hanover 64 61 53-69
Orange 36 34 24-44
Robeson 81 84 79-90
Wake 59 52 43-61
Health literacy
“Low” 70 67 61-74
25
REFERENCES
1) Nelson WE. Textbook of Pediatrics. 15th ed. Philadephia, Pa: WB Saunders; 1996:628.
2) U.S. Department of Health and Human Services. Oral Health in America: A Report of the Surgeon General. Rockville, MD: U.S. Department of Health and Human Services, National Institute of Dental and Craniofacial Research, National Institutes of Health, 2000.
3) Dye BA, Tan S, Smith V, Lewis BG, Barker LK, Thornton-Evans G, et al. Trends in oral health status: United States, 1988–1994 and 1999–2004. National Center for Health Statistics. Vital Health Stat 11(248). 2007.
4) Lee JY, Divaris K. The ethical imperative of addressing oral health disparities: a unifying framework. J Dent Res. 2014 Mar;93(3):224-30.
5) Edelstein BL, Chinn CH. Update on disparities in oral health and access to dental care for America's children. Acad Pediatr. 2009;9(6):415-9.
6) Newacheck PW, Hughes DC, Hung YY, Wong S, Stoddard JJ. The unmet health needs of America's children. Pediatrics. 2000;105(4 Pt 2):989-97.
7) Dye B. NCHS Data Brief. Centers for Disease Control and Prevention. March 2015. Available athttp://www.cdc.gov/nchs/data/databriefs/db191.htm. Accessed April 2, 2015
8) Beltrán-Aguilar E. MMWR Surveillance Summaries. Centers for Disease Control and Prevention. August, 25, 2005. Available
athttp://www.cdc.gov/mmwr/preview/mmwrhtml/ss5403a1.htm. Accessed April 2, 2015
9) Achembong LN, Kranz AM, Rozier RG. Office-based preventive dental program and statewide trends in dental caries. Pediatrics. 2014 Apr;133(4):e827-34
10)Pahel BT, Rozier RG, Stearns SC, Quiñonez RB. Effectiveness of preventive dental treatments by physicians for young Medicaid enrollees. Pediatrics. 2011;127(3):e682-9.
11)Rozier RG. Oral health in North Carolina: innovations, opportunities, and challenges. N C Med J. 2012 Mar-Apr;73(2):100-7.
12)Mouradian WE. Disparities in Children's Oral Health and Access to Dental Care. JAMA: The Journal of the American Medical Association. 284(20):2625-2631.
13) Find Shortage Areas: HPSA by State & County. Health Resources and Services
14)Rozier RG, Sutton BK, Bawden JW, Haupt K, Slade GD, King RS. Prevention of early childhood caries in North Carolina medical practices: implications for research and practice. J Dent Educ. 2003;67(8):876-85.
15)Kanellis MJ. Caries risk assessment and prevention: strategies for Head Start, Early Head Start, and WIC. J Public Health Dent. 2000;60(3):210-7.
16)Douglass AB, Douglass JM, Krol DM. Educating pediatricians and family physicians in children's oral health. Acad Pediatr. 2009;9(6):452-6.
17)American Academy of Pediatrics. State Medicaid Payment for Caries Prevention Services by Non-Dental Professionals . June 2013. Available
athttp://www2.aap.org/oralhealth/docs/OHReimbursementChart.pdf. Accessed April 2, 2015
18)Pierce KM, Rozier RG, Vann WF. Accuracy of pediatric primary care providers' screening and referral for early childhood caries. Pediatrics. 2002;109(5):E82-2.
19)Slade GD, Bailie RS, Roberts-Thomson K, et al. Effect of health promotion and fluoride varnish on dental caries among Australian Aboriginal children: results from a
community-randomized controlled trial. Community Dent Oral Epidemiol. 2011;39(1):29-43.
20)Minah G, Lin C, Coors S, Rambob I, Tinanoff N, Grossman LK. Evaluation of an early childhood caries prevention program at an urban pediatric clinic. Pediatr Dent.
2008;30(6):499-504.
21)Lewis CW, Grossman DC, Domoto PK, Deyo RA. The role of the pediatrician in the oral health of children: A national survey. Pediatrics. 2000;106(6):E84
22)Lewis C, Lynch H, Richardson L. Fluoride varnish use in primary care: what do providers think?. Pediatrics. 2005;115(1):e69-76.
23)Lewis CW, Boulter S, Keels MA, et al. Oral health and pediatricians: results of a national survey. Acad Pediatr. 9(6):457-61. (2009)
24)Quiñonez RB, Pahel BT, Rozier RG, Stearns SC. Follow-up preventive dental visits for Medicaid-enrolled children in the medical office. J Public Health Dent. 2008;68(3):131-8.
25)Rozier RG, King RS. Defining the need for dental care in North Carolina: contributions of public health surveillance of dental diseases and conditions. N C Med J. 66(6):438-44.
27
27)Lee JY, Divaris K, Baker AD, Rozier RG, Lee SY, Vann WF. Oral health literacy levels among a low-income WIC population. J Public Health Dent. 2011;71(2):152-60.
28)Lee JY, Divaris K, Baker AD, Rozier RG, Vann WF. The relationship of oral health literacy and self-efficacy with oral health status and dental neglect. Am J Public Health. 2012;102(5):923-9.
29)Lee JY, Rozier RG, Lee SY, Bender D, Ruiz RE. Development of a word recognition instrument to test health literacy in dentistry: the REALD-30--a brief communication. J Public Health Dent. 2007;67(2):94-8.
30)Vann WF Jr, Lee JY, Baker D, Divaris K. Oral health literacy among female caregivers: impact on oral health outcomes in early childhood. J Dent Res. 2010 Dec;89(12):1395-400.
31)Schwarzer R, Jerusalem M. Generalized self-efficacy scale. Measures in health psychology: A user’s portfolio. Causal and control beliefs.1995(1): 35-37.
32)Dela cruz GG, Rozier RG, Slade G. Dental screening and referral of young children by pediatric primary care providers. Pediatrics. 2004;114(5):e642-52.
33)Close K, Rozier RG, Zeldin LP, Gilbert AR. Barriers to the adoption and implementation of preventive dental services in primary medical care. Pediatrics. 2010;125(3):509-17.
34)Bordley WC, Margolis PA, Stuart J, Lannon C, Keyes L. Improving preventive service delivery through office systems. Pediatrics. 2001;108(3):E41.
35)Margolis PA, Stevens R, Bordley WC, et al. From concept to application: the impact of a community-wide intervention to improve the delivery of preventive services to children. Pediatrics. 2001;108(3):E42.