EDUCATIONAL ATTAINMENT’S UNEQUAL BENEFITS? DIFFERENCES IN IMPAIRED FECUNDITY AND INFERTILITY BETWEEN BLACK, HISPANIC, AND WHITE WOMEN
IN THE UNITED STATES
Andrea N. Goodwin
A thesis submitted to the faculty at the University of North Carolina at Chapel Hill in partial fulfillment of the requirements for the degree of Master of Arts in the Department of Sociology
in the College of Arts and Sciences.
Chapel Hill 2020
iii ABSTRACT
Andrea N. Goodwin: Educational Attainment’s Unequal Benefits? Differences in Impaired Fecundity and Infertility between Black, Hispanic, and White Women in the United States
(Under the direction of Robert A. Hummer)
Sociology of health research links higher educational attainment with positive effects on individual-level health. But existing evidence also indicates that the positive health effects of educational attainment are not experienced equally across different racial and ethnic groups in the U.S. Guided by the literature on stress and health, this study uses data from the National Survey of Family Growth (NSFG) to assess the fecundity and fertility statuses (i.e., ability to have children) of highly educated women in different racial and ethnic groups in the U.S. in comparison to each other and to their less-educated counterparts. The findings indicate
iv
ACKNOWLEDGMENTS
This research received support from the Biosocial Research Training grant (T32 HD091058) and the Population Research Infrastructure Program (P2C HD050924) awarded to the Carolina Population Center at The University of North Carolina at Chapel Hill by the Eunice Kennedy Shriver National Institute of Child Health and Human Development.
I would like to express my sincerest gratitude and warm appreciation to the following persons who contributed valuable feedback in helping me shape this thesis.
Dr. Robert A. Hummer, thesis chair, departmental advisor, and biosocial preceptor, for your expertise, constant calm guidance, and patience throughout the process of writing this thesis. Without your assistance this paper would not have been possible.
My committee members, Dr. Kathleen M. Harris and Dr. Liana J. Richardson, for your support, suggestions, and encouragement.
Dr. Whitney R. Robinson, biosocial preceptor, and Dr. Danielle Gartner, for your invaluable epidemiological perspective and helpful feedback.
Dr. Catherine Zimmer, for your continuous support which has spanned far beyond statistical assistance.
v
TABLE OF CONTENTS
LIST OF TABLES……….vii
LIST OF FIGURES………..viii
LIST OF ABBREVIATIONS……….ix
Introduction………..1
Background………..3
Fecundity and Fertility in the United States………3
Determinants of Fecundity and Fertility: Age and Educational Attainment……...4
Educational Differences in Fecundity and Fertility: Differential Access to and Utilization of ART………....…5
Possible Role of Increased Education among Racial/Ethnic Groups………..6
Stress and Increased Educational Attainment ………..7
Theoretical Framework………8
John Henryism………...8
Hypotheses……….10
Methods………..11
Data Source………11
Analytic Sample……….13
Variables………14
vi
Analytic Plan………..20
Results………21
Descriptive Results………21
Logistic Regression Results………...22
Discussion………..26
Conclusion……….31
APPENDIX 1: TABLES………...32
APPENDIX 2: FIGURES………..38
vii
LIST OF TABLES
Table 1 - Measurement of Fecundity Status………..32 Table 2 - Measurement of Infertility Status.………..33 Table 3 - Fecundity Status: Weighted Descriptive Statistics of Variables Included in Analysis..34 Table 4 - Infertility Status: Weighted Descriptive Statistics of Variables Included in Analysis..35 Table 5 - Logistic Regression (Odds Ratios) of Impaired Fecundity: U.S.
Women, Aged 22-44, 2011-17.……….36 Table 6 - Logistic Regression (Odds Ratios) of Infertility Status: U.S.
viii
LIST OF FIGURES
Figure 1 – Conceptual Model of the Association between Educational
ix
LIST OF ABBREVIATIONS
ART Assisted reproductive technologies BMI Body mass index
CAPI Computer-assisted personal interviewing CASI Computer-assisted self-interviewing NCHS National Center for Health Statistics NHSR National Health Statistics Reports NSFG National Survey of Family Growth
OR Odds ratio
1 Introduction
The positive association between educational attainment and health has been
well-documented in the extant sociology of health literature (Elo 2009; Link and Phelan 1995; Phelan, Link, and Tehranifar 2010). Additionally, higher educational attainment has often been identified as a key contributor to upward social mobility in the United States (Savage 2000). Together these findings have shaped a consensus across various disciplines that achieving certain benchmarks along the educational attainment continuum (particularly a college degree) correlates with a longer, healthier life for individuals, and better life chances for individuals and their families. However, the positive effects of education on health and other socioeconomic outcomes are not experienced equally across racial and ethnic groups in the United States (Farmer and Ferraro 2005). Researchers have found that higher levels of education for Black and Hispanic individuals have been less beneficial to their health when compared to their White counterparts in terms of mortality (Hummer and Lariscy 2011; Williams and Sternthal 2010), maternal and infant health (Hoyert 2007), and more general measures of health (Farmer and Ferraro 2005). In fact, with respect to several of these health outcomes, researchers have found that gaps between U.S. Blacks and Whites are actually wider at higher levels of educational attainment than at lower levels (Braveman et al. 2010; Sasson 2016).
2
Schmidt 2006; Guendelman and Stachel 2011; Chandra, Copen, and Stephen 2013)1. However, what is unknown to date is whether this disparity varies by education level and, specifically, whether college-education is protective for Black and Hispanic women too. This empirical question is worth investigation for several reasons. First, there is a clear trend of highly educated women postponing childbearing, and Black and Hispanic women are no exception to this trend (Martinez, Daniels, and Febo-Vazquez 2018; Mills et al. 2011; Nabukera et al. 2009; Sobotka 2017). While each woman’s window of fecundity and fertility is different, there is a finite period of time in which women can become pregnant or carry pregnancies to live birth. Conventional wisdom suggests that fecundity and fertility begin declining gradually after the early 30s and more rapidly after the late 30s. Research suggests that chronic stress may accelerate the age at which this decline begins. Thus, among women who experience chronic stress, those who are postponing childbearing may have an even more diminished window and not be aware of it. Among Black and Hispanic women who pursue higher educational attainment, chronic
racial/ethnic-related stress combined with delayed childbearing in service of this pursuit may be particularly detrimental to their fecundity and fertility.
Second, relative to White women, Black and Hispanic women face more barriers to the use of assisted reproductive technologies (ART), beyond the anticipated economic constraints (Bell 2010), despite having higher rates of impaired fecundity (Bitler and Schmidt 2006; Greil et al. 2011a, 2011b; Guendelman and Stachel 2011; Jain 2006; White, McQuillan, and Greil. 2006).
1 Studies varied by how they measured impaired fecundity and infertility. Age ranges ended at 44
3
This second point lends particular motivation to exploring infecundity and infertility because there appears to be social stratification associated with access to fertility-increasing ART.
Third, a growing body of literature suggests there may be especially deleterious effects of stress on physical health among highly educated Blacks and Hispanics (Chen et al. 2015;
Gaydosh et al. 2018), not only when compared to their White, similarly educated counterparts, but also in comparison to their less-educated, same-race peers (Gaydosh et al. 2018). Whether this pattern holds true for fecundity and fertility has not been studied.
I aim to analyze whether there are observable differences in the fecundity or infertility status among women who have completed college – a socioeconomic status (SES)-related benchmark that is generally associated with positive effects on health but that may confer greater or lesser benefits depending on their race/ethnicity. In particular, this study will address two questions:
RQ 1: Do infecundity/infertility rates within the United States vary by educational attainment (specifically achievement of a college degree)?
RQ 2: Do educational attainment disparities in infecundity/infertility among U.S. women vary by race/ethnicity?
Background
Fecundity and Fertility in the United States
4
these patterns, including the aforementioned trend of highly educated women tending to delay the onset of childbearing (Mills et al. 2011; Nabukera et al. 2009; Sobotka 2017).
In demographic terms, fertility indicates the product of reproduction (i.e., live births), whereas fecundity is the physiological ability to have children. There is not an overlap in the definitions of fecundity and fertility, and thus, they are not used interchangeably. However, when exploring the area of “fertility problems,” it is important to note that the terms infecundity and infertility are often used without precise definitions and may vary depending on the discipline (WHO 2004). For the purposes of this thesis, I use the operating definitions of the National Survey of Family Growth (NSFG) —a commonly used source of fecundity and fertility data in the United States and the data source for my study. The NSFG defines fecundity status as women’s physical ability to not only become pregnant, but to carry pregnancies to a live birth, with consideration of her partner’s ability only if she is married or cohabitating. The NSFG measures infertility status for only married or cohabitating women and defines it as the inability to become pregnant (See Methods section for more details).
Determinants of Fecundity and Fertility: Age and Educational Attainment
5
education has accompanied shifts toward later ages of childbearing (Nabukera et al. 2009; Mills et al. 2011; Sobotka 2017). In fact, a monozygotic twins study using the Minnesota Twin
Registry found that women with a college degree delay childbearing by 3.54 years, on average, compared to women with a high school diploma (Amin and Behrman 2014). This pattern of delayed childbearing among more highly educated women is particularly relevant to this study considering that natural fecundity in any woman exists for a finite set of years and decreases as one ages through that window of time.
Educational Differences in Fecundity and Fertility: Differential Access to and Utilization of ART
In the 1970s, with the rise of ART, infertility became medicalized and treated as a
pathological condition rather than a natural or social one (Bell 2010). Over the next 40 years, the number of U.S. medical visits for infertility, and the number of ART cycles being used, grew exponentially. Yet, the extremely high costs of ART (e.g., approximately $19,200 for one cycle of in vitro fertilization, including medications) (Wu et al. 2014), and the fact that less than a handful of states mandate comprehensive insurance coverage that covers ART, has created
socioeconomic stratification among ART users (Bell 2010). However, research has indicated that finances are not the only barrier maintaining the stratification of ART usage. In states like
Massachusetts, where there is mandated insurance coverage of ART, Black and Hispanic women are still underrepresented in ART clinics (ASRM 2015). New studies focused on “stratified reproduction” have established other factors that operate as barriers to seeking medical services for infertility among Black and Hispanic women. Specifically, cultural and class differences have been identified as possible sources for the disparities in ART treatments. Lower levels of
6
accounted for by a distrust of medical institutions (particularly among Blacks), cultural aversion to technological solutions, and fear of being rejected for treatment (White et al. 2006). Another barrier to treatment for Black women could be a lack of support for medical interventions from husbands/partners (Inhorn, Ceballo, and Nachtigall 2009). Inhorn et al. (2009) also suggest that Black and Hispanic women are more likely to have a more holistic approach to health than White women, and they may rely more heavily on spiritual or religious explanations for their
infecundity/infertility. Additionally, Molock (2009) argues that a strong tradition of Black and Hispanic women caring for other people’s children often leads to their social network of friends and family exerting less pressure on women to seek ART treatments.
Possible Role of Increased Education among Racial/Ethnic Groups
A growing body of literature reveals that Blacks experience less pronounced health benefits of increased educational attainment than Whites (Braveman et al. 2010; Farmer and Ferraro 2005; Hoyert 2007; Hummer and Lariscy 2011; Sasson 2016; Williams and Sternthal 2010). Further, some research suggests that pursuing higher education can actually be damaging to the health of Blacks and Hispanics. For example, recent evidence demonstrates Black and Hispanic young adults from disadvantaged backgrounds are more likely to have worse metabolic health if they attended (Chen et al. 2015) or completed college (Gaydosh et al. 2018), compared to their same-race peers with less educational attainment.
This latest finding is not simply a restatement of previous results, such as those by Williams and Sternthal (2010) in which the racial disparity in self-rated health was largest at the higher levels of SES (see also Farmer and Ferraro 2005). The recent evidence indicates a
7
Hispanic young adults compared to their less educated counterparts. While these findings from young adulthood are limited to that age group, and in and of themselves are not enough to
challenge the positive education-health gradient (Link and Phelan 1995), it does suggest a reason for the shallower education-health gradients for Blacks and Hispanics in later life. Moreover, if there is a correlation between college attendance or completion and compromised physical health in early adulthood (i.e., reproductive years) for Blacks and Hispanics, such patterns are
especially relevant for a study on fecundity and infertility status.
Stress and Increased Educational Attainment
In an effort to explain the apparent weaker returns of increased educational attainment for Black and Hispanic health in the United States, researchers have commonly indicated chronic stress as an intervening factor. Social stress theory generally provides a useful theoretical framework to explain health disparities across populations by identifying social conditions as fundamental causes of increased exposure to stress for members of disadvantaged or
8
experience a proliferation of stress that leads to the production and continuation of health inequalities.
The question that remains is why higher SES (which should reduce stress exposure and increase stress buffers) does not offset the disadvantages (and greater stress exposure) associated with being Black or Hispanic. Two approaches to answering this question are of particular interest for this study. The first approach identifies unique stressors that Blacks and Hispanics may confront in their pursuit of higher SES via increased education. For example, they may experience higher levels of race-related stressors experienced by all U.S. Blacks and Hispanics, such as discrimination and stereotype threat due to higher levels of cross-race interactions, as well as cultural discontinuity between their exposures in school and their home and community (Geronimus 1992; Hardaway and McLoyd 2009; Johnson, Richeson, and Finkel 2011). The second approach focuses on the coping strategies activated by Blacks and Hispanics, particularly those from disadvantaged backgrounds, deployed on the pathway to higher SES (James et al. 1987; James 1994; Jackson, Knight, and Rafferty 2010; Sellers et al. 2012). The two approaches are not mutually exclusive, but instead, can be complementary to one another. The biological toll of continuous emotional self-regulation and persistent overcoming of obstacles to one’s
increased educational attainment that are the focus of the second approach are often in response to the stressors at the center of the first approach. Accordingly, the two approaches are merged here to form the theoretical framework for this study.
Theoretical Framework
John Henryism
9
Henry, the namesake of James’s theory, was an African American folk hero who won a steel-driving race against a mechanical, steam-powered drill, only to die immediately after because his heart gave out from the physical and mental stress he exerted in the competition. Broadly
summarized, John Henryism explains how sustained activation of the stress-response system leads to biological wear and tear, accelerated aging, and accumulated risk.
More specifically, James describes John Henryism as “a strong behavioral predisposition to cope actively with psychosocial environmental stressors” among African Americans (James 1994:163). In other words, John Henryism builds on stress process models by focusing our attention on a particular type of coping strategy in which African Americans may engage in with regard to dealing with stressors. Initially applied to examine racial disparities in hypertension, the hypothesis suggests that prolonged, high-effort coping with challenging psychosocial
environmental stressors is at the root of correlations between stress-related health difficulties that disproportionately affect Black and Hispanic populations.
To explain within-group racial/ethnic differences in stress-related health problems, James’s hypothesis distinguishes between two groups of individuals in these communities. The first group does not respond to the harmful conditions with high-effort coping, or eventually gives up on the high-effort coping. The second group responds with high-effort coping and persists with the effort because bits of success encourage them. It is the latter group that is hypothesized to drive John Henryism’s impact on the overall prevalence of stress-related health conditions in African American and Hispanic populations (James 1994).
10
counterparts but, at the same time, they will exhibit higher levels of infecundity and/or infertility than their highly-educated White counterparts. In other words, the impact of John Henryism would lessen the health benefits of an education-related boost to SES for Black and Hispanic women compared to the benefits experienced by White women. This is because the persistent high-effort coping that is necessary for Black and Hispanic women to attain this educational benchmark wears down their health over time, manifesting as higher levels of infecundity and/or infertility relative to highly-educated Whites.
The conceptual framework (Figure 1) of my proposed study illustrates the disparate impact that educational attainment may have for different racial/ethnic populations in the United States. Led by the theoretical premise of John Henryism, the framework posits less pronounced differences in fecundity and infertility statuses within the Black and Hispanic racial/ethnic groups between women who have earned a bachelor’s degree (or higher) and those who have not. If the process of John Henryism is occurring, then the cumulative challenges to achieving higher education—i.e., the high effort coping which women must engage in to complete
college—should result in fewer benefits to health in comparison to their highly educated White counterparts.
Hypotheses
11
health behaviors, such as smoking, unfavorable body mass index (BMI), and lack of physical activity (Liu and Nunez 2010). Adapting John Henryism to fecundity and infertility status, I next offer the hypothesis that highly educated Black and Hispanic women (i.e., they have earned a bachelor’s degree or higher) will have less favorable fecundity and infertility statuses compared to similarly educated White women. In sum, and in specific response to the research questions, I propose the following hypotheses:
H1: Highly educated women will exhibit more favorable fecundity and/or infertility statuses than their less educated peers.
H2: The magnitude of the differences between high and low educated women will be less pronounced for Black and Hispanic women than White women.More specifically, highly educated Black and Hispanic women will exhibit higher rates of infecundity and/or infertility than their similarly educated White counterparts.
Methods
Data Source
The National Survey of Family Growth (NSFG) gathers information on family life, marriage and divorce, pregnancy, infertility, use of contraception, and general reproductive health (NSFG 2016). First conducted in 1973, the NSFG is a nationally representative sample of men and women, 15-44 years of age2. In 2006, the NSFG moved from a periodic survey design, as conducted by the National Center for Health Statistics (NCHS) six times between 1973 and 2002, to a continuous survey design. Interviews are conducted with a national probability sample
2 The inclusion of men began in 2002. The age range expanded to 49 years of age in 2015, for the
12
of women and men 15-44 years of age living in households in the United States. Excluded from the survey population, or population of inference, are institutionalized persons, such as those living in prisons and juvenile corrections facilities, homes for the intellectually disabled, long-term psychiatric hospitals, and those living on military bases. Conversely, included in the sample are age eligible persons living in non-institutional group quarters (e.g., dormitories, fraternities), college students sampled through their parents’ or guardians’ households, and women and men who are in the military but living off base (NSFG 2016).
Computer-assisted personal interviewing (CAPI) is used, in which trained female interviewers administer the interviews in person using laptop computers. For a subset of the more sensitive questions, audio-computer assisted self-interviewing (Audio-CASI or ACASI) is used. In this procedure, respondents answer the questions on the laptop computer, either by reading them on the screen or listening to the pre-recorded questions read over headphones, and enter their answers directly into the computer (NSFG 2016).
13
The NSFG data are used to produce National Health Statistics Reports (NHSR) of nationally representative estimates on sexual and reproductive patterns and trends (Martinez, Daniels, and Febo-Vazquez 2018; Chandra, Copen, and Stephen 2013). The 2013 NHSR focuses on “infertility and impaired fecundity,” which the report classifies as “fertility problems,” among women aged 15-44 in the United States. The NHSR use two measures that have been
consistently defined for women since the 1982 NSFG: fecundity status and infertility status. Both statuses are constructed from the responses to survey questions, not through the use of medical examinations.
Analytic Sample
This cross-sectional analysis combines data from the 2011-2013 NSFG, 2013-2015 NSFG, and 2015-2017 NSFG. All told, this included 16,191 interviews with women, which I aggregate in an effort to ensure sufficient sample sizes for the populations of highly educated Black, Hispanic, and White women. I limit the age range under consideration to 22-44 years to be consistent with the age range used in the NHSR. Also, age 22 corresponds with a point in the life course when many young adults have either opted into the workforce or completed their pursuit of a bachelor’s degree. The cut-off of 44 years of age is the top end of the NSFG’s age range through 2015, and it coincides with the standard age cut-off for fecundity and infertility status studies. My sample narrows to 11,486 observations with the age restrictions and three racial/ethnic groups of emphasis. The final analytic sample omits surgically sterile respondents from both fecundity and infertility status measurements and consists of only
14
status respondents and 1,804 of the infertility status respondents have earned a bachelor’s degree or higher.
Variables
Fecundity. Fecundity status in the NSFG describes women’s physical ability to not only become pregnant, but to carry pregnancies to a live birth. Serving as my first dependent variable, the fecundity status measure classifies the respondents into categories with Fecund being the residual category. Table 1 displays all the categories included in NSFG’s fecundity status measure.
My classification of “having impaired fecundity” includes the following three categories: Sterile, Nonsurgical in which the respondents report that it is impossible for them to have
a(nother) baby for reasons other than surgical sterilization or for their husband/partner to father a(nother) baby; Subfecund in which respondents report that it is difficult for them, and/or their husband/partner to conceive or deliver a(nother) baby, or if a medical doctor advised them never to become pregnant; and Long Interval Without Conception if, during the 36 months or more of continuous marriage or cohabitation prior to interview, respondents did not have a pregnancy, used no contraception, and were sexually active each month.
Infertility. As noted above, infertility status was measured only among married or cohabitating women since infertility is viewed as a couple-based phenomenon. Unless one member of the partnership is completely sterile, it is assumed that either partner could potentially achieve pregnancy with a different partner. And, the NSFG measure does not attempt to
15
and Stephen 2013). By restricting the infertility measure to married or cohabitating women, the analytic sample for this dependent variable is 4,454.
As Table 2 shows, married and cohabiting respondents are then classified as either surgically sterile, infertile, or presumed fertile. Respondents are categorized as surgically sterile if they or their current husband or cohabitating partner have undergone a sterilization procedure that has not been reversed. Respondents are deemed infertile at the time of interview if neither they nor their current husband/partner are surgically sterile and “during the previous 12 months or longer, she and her husband or partner were continuously married or cohabitating, were sexually active each month, had not used contraception, and had not become pregnant”
(Chandra, Copen and Stephen 2013:2). Respondents are presumed fertile if they do not meet the criteria for the surgically sterile or infertile classifications. Table 2 displays the categories included in NSFG’s infertility status measure.
Contrary to infertility status, the measure of fecundity status is defined for all women, regardless of their relationship status. However, married or cohabitating women are asked additional questions about fertility problems encountered by each member of the couple. Therefore, comparable to the infertility measure, a husband/cohabitating partner’s surgically sterile status classifies women as surgically sterile in the fecundity status measure (Chandra, Copen, and Stephen 2013). In other words, married women or cohabitating women could be classified as surgically sterile or having impaired fecundity solely based on the status of their husband/cohabitating partner. In contrast, the fecundity measurement of single or
non-cohabitating women is based only on their own status.
16
classification, and a 36-month threshold for impaired fecundity classification), some infertility services-based analyses choose to group impaired fecundity and infertility into a classification of women with “current fertility problems.” This allows analyses to capture any women who meet the criteria for the classification of impaired fecundity and/or infertile. Accordingly, the analysis for this thesis includes both the NSFG’s classifications for impaired fecundity as well as infertile.
Importantly, I exclude respondents who are categorized as surgically sterile from both measures, and dichotomize my variables to classify participants as either: a) having impaired fecundity (i.e., fecundity categories three through five) or fecund, and b). infertile or presumed fertile. For further clarification of the terminology for the NSFG measurements see Tables 1 and 2.
Race/Ethnicity. The NSFG includes a self-reported race variable that categorizes respondents as Black or African American, White, and Hispanic, or one of three additional categories that are labeled as “other race groups.” My analytic sample focuses on Black, White, and Hispanic respondents, which account for about 94 percent of the pooled NSFG female respondents who fit within my age restrictions (the three other race/ethnicity categories accounted for 749 respondents within the specified age range and were not part of my subpopulation when conducting these analyses).
Educational attainment. The NSFG provides a variable for educational attainment which classifies respondents based on the highest level of education attained. I dichotomize the
17
diploma, it has become the gateway for entry into the middle class, and its relationship to health benefits is distinctly greater than the marginal relationship between some college (or an
associate’s degree) and better health (Zajacova and Lawrence 2018).
Control Variables
Several factors contribute to women’s difficulty or inability to become pregnant, with age and contraception usage possibly being the most intuitive. The NSFG has multiple items on the questionnaire to record contraceptive usage, including current contraceptive status at the time of the interview, whether any method was used in the last three months prior to the interview, and whether any method was used in the last 12 months prior to the interview. The numerous categories for contraception are separated into “using contraception” and “not using
contraception,” and the latter are used in the formulation of the fecundity and infertility variables recode classifications to rule out contraception as the cause for not becoming pregnant. I include a handful of additional covariates to control for the impact they may have on impaired fecundity or infertility, as well as a variable for respondents’ mother’s education as a proxy to give context to the respondents’ beginning socioeconomic position in consideration to the challenges of higher educational attainment.
My control variables account for health and behavioral factors that may be affecting fecundity and infertility status. For instance, research has shown a substantial relationship between infecundity or infertility and both smoking (Practice Committee of the American
18
analysis. These control variables remain consistent with my theoretical framework as both smoking (Richards et al. 2011; Stubbs et al. 2017) and unhealthy BMI (Fowler-Brown et al. 2009; Roberts et al. 2007) have shown a correlation with stress, and a particular relationship with coping strategies for the non-White U.S. population (Mezut et al. 2013). Previous research also identifies age and age at menarche as key components of fecundity and infertility studies. And, the use of ART may have an influence on respondents’ fecundity and/or infertility. Thus, I additionally control for the age of the respondent, the respondent’s age at menarche, and the use of ART in the adjusted models for both fecundity status and infertility status. The covariates related to impaired fecundity and infertility include age, use of assisted reproductive technology (ART), menstrual history, smoking behavior, and body mass index (BMI), and the rationale for each is described in the subsequent paragraphs.
Age. The NSFG offers a variable indicating respondents’ age at the time of the screener, as well as a variable specifying respondents’ age at the time of the interview. For this study, age will be defined as respondents’ age at the time of the interview.
19
Menstrual history. The literature surrounding human reproduction identifies the age at menarche (i.e., first menstruation) as an important component in fecundity and fertility studies. As a measure of sexual maturity indicating women’s transition into their fertile period, menarche is used as a valid indicator of women’s reproductive capacity (Coall et al. 2016). While fertility is the direct measure of the number of live births women have, women’s ability to conceive and have a live birth (i.e., fecundity) is unable to be measured directly. Hence, fecundity is estimated from the components of reproduction. Age at menarche is a significant component to include because women are typically not considered fecund at menarche due to the absence of ovulation during the post-menarche menstrual cycles. There is high variability with regard to the time until the onset of regular ovulatory cycles, but once started, the percentage of fertile cycles increases steadily with age from menarche (Metcalf et al. 1983). Generally, ovarian function increases rapidly in women with earlier menarche, and an earlier menarche is associated with a longer reproductive lifespan and a shorter time to pregnancy (Guldbransen et al. 2014; Komura et al. 1994), suggesting that those who mature earlier are more fecund (Coall et al. 2016).
Accordingly, I will include the NSFG’s measurement for age at menarche in my analysis. Smoking. Unfavorable fecundity and infertility statuses are among the documented negative health effects of smoking (Practice Committee of the American Society for
Reproductive Medicine 2018; Radin et al. 2014). Since 2011, the NSFG includes three variables to measure a respondent’s smoking habits and history: the age that the respondent first began smoking regularly, how often the respondent smoked cigarettes in the last 12 months, and
20
Body Mass Index (BMI). Literature on infecundity and infertility has found a relationship between BMI values outside of the healthy weight range and adverse fecundity and infertility statuses (Law, Maclehose and Longnecker 2007; McKinnon et al. 2016; Wise, Palmer and Rosenberg 2013). Thus, I will include BMI as a covariate.
Analytic Plan
I first present descriptive statistics for the two dependent variables, the key independent variables, and the control variables used for analysis. I show the distribution for all the variables used in my study, both overall and by educational attainment level and race/ethnicity. I then formally test my hypotheses using multivariate models to examine whether there are significant differences in impaired fecundity and infertility by educational attainment, again both for the overall population and by race/ethnicity.
Since my dependent variables (fecundity and infertility statuses) are measured
dichotomously, I use binomial logistic regression models to estimate the odds of a respondent being in one category versus the other (i.e., having impaired fecundity vs. fecund; infertile vs. presumed fertile). Hypothesis 1 is tested by examining educational differences in
infecundity/infertility. To examine Hypothesis 2 within the framework of John Henryism, I included interaction terms in my models to test the difference in levels of impaired
21 Results
Descriptive Results
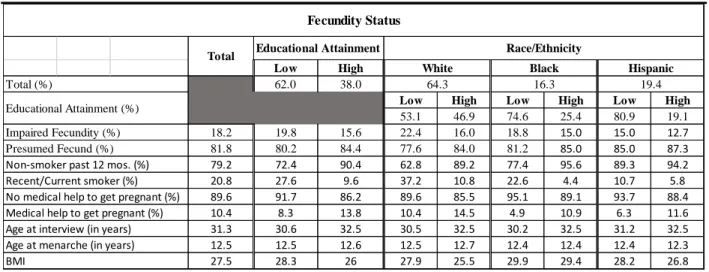
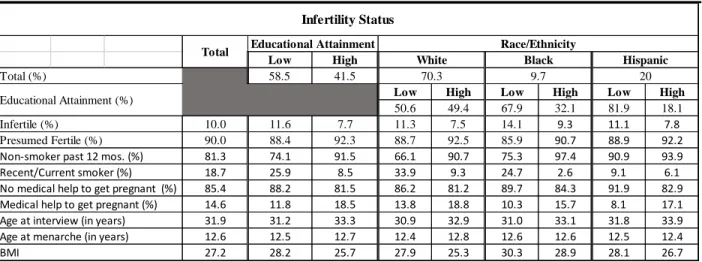
Tables 3 and 4 present descriptive statistics for all the variables used in the study, separating the analytic sample for fecundity status (Table 3) and infertility status (Table 4), due to the married/cohabitating restrictions associated with the infertility status’s sample. The dependent variables had a similar split with the majority of respondents not reporting “fertility problems.” Nonetheless, 18 percent were classified as having impaired fecundity and 10 percent of respondents were classified as infertile. About two-thirds of the fecundity status respondents were White (64.6 percent), followed by Hispanic with 19.4 percent and then Black (16 percent), whereas the restriction of marriage/cohabitation skewed the infertility sample to a substantially greater proportion of White respondents (i.e., White: 70 percent, Black: 10 percent, and
Hispanic: 20 percent). About 40 percent of respondents had a Bachelor’s Degree or higher (38.0 percent in full sample for fecundity status, and 41.5 percent in married/cohabitating infertility status sample), and the majority were nonsmokers (79.2 percent and 81.3 percent for fecundity status sample and infertility status sample, respectively) and had not used ART (89.8 percent and 85.4 percent for fecundity status sample and infertility status sample, respectively). In both samples, the mean age at interview was about 31 years old, and the mean BMI was about 27.
22
was also lower for those with higher education, but the differences were smaller. These crude results support Hypothesis 1 in that college-educated women would display more favorable infecundity/infertility rates than their less educated counterparts. They do not appear to support Hypothesis 2, that the magnitude of the health benefit associated with college education would be greater for White women than Black or Hispanic women.
Logistic Regression Results
Table 5 displays the results from the multivariate analysis of the relationships among educational attainment, race/ethnicity, and fecundity status. Model 1, which included both educational attainment and race/ethnicity, showed both were significantly associated with
fecundity status (net of each other). When race is held constant, women with at least a bachelor’s degree exhibited 31 percent lower odds of impaired fecundity (OR [P] = 0.69 [<.001]) in
comparison to those without a bachelor’s degree, which is consistent with expectations. At the same time, inconsistent with expectations, Black (OR [P] = 0.83 [.09]) and Hispanic (OR [P] = 0.64 [<.001]) women exhibited 17 percent and 36 percent lower odds of impaired fecundity than White women, respectively, net of the effect of educational attainment.
In Model 2, I included an interaction term for educational attainment and race/ethnicity to estimate the odds of impaired fecundity for highly educated Black and Hispanic women when compared to both highly educated White women as well as their less-educated,
23
fecundity were no longer different between lower educated Black women and lower educated White women after inclusion of the interaction terms and control variables. However, the lack of statistical significance for the race by education interaction terms indicate that the odds of
impaired fecundity for highly educated women does not vary by race/ethnicity.
It is not surprising that several of the covariates, selected for inclusion based on previous evidence, exhibited significant associations with impaired fecundity in expected directions. All but age at menarche had a strong statistically significant association with the odds of impaired fecundity. Increased age (OR [P] = 1.06 [<.001]) and BMI (OR [P] = 1.05 [<.001]), use of ART (OR [P] = 6.42 [<.001]), and smoking behavior (OR [P] = 1.44 [<.001]) were all associated with increased odds of impaired fecundity. Additionally, higher educational attainment for the
respondent’s mother’s (OR [P] = 0.85 [<.001]) was associated with lower odds of impaired fecundity.
In Model 3, the covariates were removed to focus on the effect of the educational attainment by race interaction terms. The main effect of educational attainment exhibited
essentially no change from the previous models (OR [P] = 0.66 [.001]). Similarly, there was very little change for the racial/ethnic variables as well: Black women’s odds of impaired fecundity decreased from Model 2, resulting in a p-value that was once again significant (OR[P] = 0.80 [.07]) and Hispanic women’s odds remained consistent (OR [P] = 0.61 [<.001]). Although both groups were trending towards greater odds of impaired fecundity, the lack of statistical
24
them but with the covariates. The values for educational attainment, race/ethnicity all the covariates were similar to their values from Model 2.
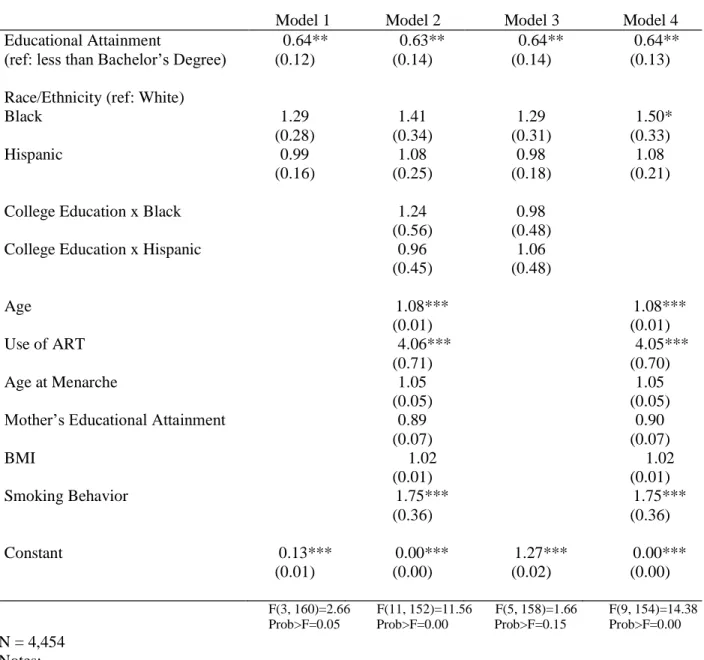
In Table 6, I display estimates of infertility among married and cohabitating respondents who are not surgically sterile. Models 1-4 of Table 6 were structured the same as those used for impaired fecundity. Model 1 showed that educational attainment was significantly associated with infertility status, when race is held constant. Women with at least a bachelor’s degree (OR [P] = 0.64 [.02]) were 36 percent less likely to be categorized as infertile in comparison to those without a bachelor’s degree. There were no significant differences in infertility status by
race/ethnicity, net of educational attainment.
I introduced interaction terms for educational attainment and race/ethnicity as well as control variables into Model 2 to examine the odds of infertility among highly educated women in each racial/ethnic category. While the odds ratios of infertility for both highly educated (OR [P] = 1.24 [.63]) and lower educated (OR [P] = 1.41 [.15]) Black women appear substantial, neither of the two results were statistically significant in Model 2. Similarly, the odds ratios for Hispanic women of both educational levels did not significantly differ statistically from the reference group in Model 2. Nonetheless, similar to impaired fecundity, the lack of statistical significance indicates that the odds of infertility for this sample of highly educated women does not vary by race/ethnicity.
In Model 3, when the covariates were removed to focus on the interaction terms for educational attainment and race/ethnicity, both the educational attainment variable (OR [P] = 0.64 [.04]) and the respective race/ethnicity variables of Black (OR [P] = 1.29 [.29]) and
25
educated women from all three groups have lower odds of infertility compared with lower educated women.
Again, I ran Model 4 without the interaction terms but with the covariates because the interactions terms did not show to be significant. The values for the key independent variables and all the covariates essentially mirrored their values from Model 2, with the exception of the Black variable which increased enough to have a p-value that was statistically significant (OR[P] = 1.50 [.07]). This suggests that Black women in general may have higher odds of infertility than White women.
Due to the exceedingly high odds ART use had with both impaired fecundity and infertility, I ran sensitivity analyses in which that variable was left out of the models that
included covariates (Models 2 and 4). The omission of ART had very little impact on the models. For impaired fecundity, the odds for most of the variables in Model 2 remained the same, with a slight decrease in statistical significance for the educational attainment variable. Moreover, the p-value for the Black variable shifted to become statistically significant. In Model 4, the shift to significance for the Black variable was the only difference from the original Model 4 (that included ART). For infertility, the omission of ART had little effect as well. Omitting ART from Model 2 resulted in BMI having a statistically significant odds ratio with regards to infertility, and the statistical significance of smoking behavior and educational attainment each decreased slightly. For Model 4, the omission of ART also resulted in BMI becoming statistically
26 Discussion
This study aimed to improve our understanding of the relationship between higher educational attainment and reproductive capability patterns of Black, Hispanic, and White
women in the United States. Thus, two research questions were created to assess whether college education affected the aforementioned racial/ethnic groups’ statuses of impaired fecundity and infertility during the window for childbearing. Specifically, did the impaired fecundity and infertility rates for college-educated women in the United States differ from lower-educated women? Then, did impaired fecundity and infertility rates differ within each of the racial/ethnic groups by educational attainment? The theoretical framing of John Henryism facilitated the generation of the two research hypotheses that I tested with logistic regression models using data from the NSFG.
The first hypothesis was that highly educated women would exhibit more favorable fecundity and/or infertility statuses than their less educated peers. For both dependent variables, across all models, respondents with a college degree or higher had significantly more favorable infecundity/infertility rates than less-educated respondents, even after controlling for race and covariates in the models. These findings support Hypothesis 1, as well as the vast body of literature that identifies an education-health gradient that has been displayed across a variety of health outcomes. It was not surprising that the findings showed impaired fecundity and infertility rates were lower for college educated women.
27
magnitude of the infecundity/infertility differences between high and low educational
attainments would be lower for Black and Hispanic women than White women. Hypothesis 2 was tested by the inclusion of interaction terms in Models 2 and 3 for both dependent variables. The interaction of educational attainment and race/ethnicity did not significantly affect the odds of impaired fecundity or infertility for highly educated Black or Hispanic women. Therefore, the health benefit associated with a college education, displayed by more favorable odds of being classified fecund/fertile in all models, does not differ by race/ethnicity. These findings do not support the John Henryism-framed Hypothesis 2; the magnitude of health benefits associated with college education appear similar for Black, Hispanic, and White women.
The lower odds of impaired fecundity for Black and Hispanic women, in comparison with White women, displayed in Table 5 was somewhat surprising. The findings were less surprising for Hispanic women because the previous studies of fertility problems had inconsistent results for Hispanic women; while they may have had less favorable rates for infertility than White women they may have had more favorable rates of impaired fecundity, or vice versa. On the other hand, Black women typically displayed less favorable rates for impaired fecundity and infertility than White women (Bitler and Schmidt 2006; Chandra, Copen, and Stephen 2013).
A possible explanation for this difference between my results and those from previous research is likely related to differences in sample inclusion criteria across studies. Whether it is a decision to restrict the age range, limit to only nulliparous women, or only include
28
used for the infertility status variable. When restricted to married/cohabitating women, my study too found Black women had statistically significant higher odds of infertility (OR [P] = 1.50 [.07]) than White women. However, there is a significant racial/ethnic disparity of union formation in the U.S.: Black women are much less likely than White women to be married or cohabitating (White et al. 2006). For example, the make-up of the infertility status variable (White: 70 percent; Black: 10 percent; Hispanic: 20 percent), displays the substantial disparity in married/cohabitating women between racial/ethnic groups in the sample (both for infertility and fecundity statuses). For this reason, I included all respondents eligible for the impaired fecundity measure. When considering the precision of the dependent variables, selection into the sample is critical. For instance, since the residual category for both dependent variables is a presumption (of fecundity or fertility) when respondents did not meet other category criteria, the difference in married/cohabitating respondents may be related to the disparity in women who have
deliberately attempted to become pregnant and therefore would actually know if they are experiencing difficulty, and thus report it in a survey.
Another possible explanation is associated with Black and Hispanic women averaging an age at first birth that was about three years younger than White women in a study using NSFG (Martinez, Daniels, and Febo-Vazquez 2018). Since age is an important factor in “fertility problems,” the possibility of lower educated Black and Hispanic women entering motherhood years earlier (on average) than White women could offset factors associated with other
racial/ethnic health disparities.
29
through medical examinations. The imprecision of fecundity leads to the second challenge: It would be understandable for respondents to have an unknown fecundity status if they have not actively tried to become pregnant (save the knowledge of a previous sterilization procedure or sterile diagnosis for them or their partner). For instance, a single woman who does not use contraception, has not become pregnant, yet has not met the 36-month threshold necessary for the status of impaired fecundity, would be classified as fecund.
Second, becoming pregnant involves the contribution of another person (i.e., spouse, partner, or donor). Therefore, without prior knowledge of sterilization of either the responding woman or the participating man, a level of uncertainty will exist as to which party is contributing to the impaired fecundity or infertility being experienced. Further research, perhaps applying help-seeking theory, would be of value.
Third, the limitation of cross-sectional data for this study is its inability to capture changes as they unfold across the life course. Thus, the patterns I find, while important, cannot take into account how women’s infecundity/infertility statuses develop over the reproductive period. Nor can the data express how these patterns differentiate across racial/ethnic groups over time. Further research on fecundity and infertility statuses would be served well by longitudinal data that is able to provide a glimpse of how infecundity/infertility patterns develop and change over the life course. Using longitudinal data with an age-sensitive health outcome like
30
Arline Geronimus’ weathering hypothesis3. If Black and Hispanic women are experiencing earlier onset of bodily deterioration than White women, then longitudinal data would allow us to observe their accelerated health declines when comparing the levels of infecundity/infertility at different ages.
In addition to longitudinal data, research on fecundity and infertility statuses would benefit from data that uses a medical examination of both respondents and their
partners/husbands to make status classifications. Ideally, this data collection would occur in large survey studies like NFSG where nationally representative samples are the aim. There are
understandable barriers to implementing such expensive and invasive data collection into a large survey-based study. However, collecting the data from fertility service medical centers is
susceptible to significant selection bias because there are substantial disparities in the populations who utilize such services; in other words, they are self-selected and not
representative of the general population. Continued efforts by policymakers to make fertility services more affordable and accessible to various subpopulations will help lessen the current disparities, but that still may not be the best data option because they may not address the non-economic barriers to ART.
3 The “weathering hypothesis” posits that Black and Hispanic women’s health declines more
31 Conclusion
32 APPENDIX 1 Table 1. Measurement of Fecundity Status
Surgically Sterile, contraceptive*
Respondent or her husband/partner is incapable of having a(nother) baby because of a sterilizing operation that was done, at least in part, for contraceptive reasons
Surgically Sterile, non-contraceptive*
Respondent or her husband/partner is incapable of having a(nother) baby because of a sterilizing operation that was done
Non-surgically Sterile Respondent reports that it is impossible for her to have a(nother) baby or for her husband/partner to father a(nother) baby for reasons other than surgical sterilization
Subfecund Respondent reports that it is difficult for her, and/or her husband/partner to conceive or deliver a(nother) baby; or a medical doctor advised her never to become pregnant
Long interval without conception
For at least 36 months, the respondent and her current husband/partner were sexually active each month, did not use contraception, and did not become pregnant
Fecund Residual category which includes all women who are not classified in any of the other fecundity status categories
33 Table 2. Measurement of Infertility Status
Infertile During at least the previous 12 months, the respondent and her current
husband/partner were continuously married/cohabitating, were sexually active each month, did not use contraception, and did not become pregnant. (The infertile
classification is based on neither the respondent nor her current husband/cohabitating partner being classified as surgically sterile)
Surgically Sterile*
Respondent or her current husband /cohabitating partner had an unreversed sterilizing operation
Presumed Fertile
Married or cohabitating women (and the current husband/cohabitating partner) who are neither classified as infertile or surgically sterile
Omitted Women who are not married or cohabitating Note: The status of infertility is highlighted in yellow.
34
Table 3. Fecundity Status♦:Weighted Descriptive Statistics of Variables Included in Analysis
N=8,849
♦Surgically sterile respondents are omitted from the analytic sample.
Low High
62.0 38.0
Low High Low High Low High
53.1 46.9 74.6 25.4 80.9 19.1 18.2 19.8 15.6 22.4 16.0 18.8 15.0 15.0 12.7 81.8 80.2 84.4 77.6 84.0 81.2 85.0 85.0 87.3 79.2 72.4 90.4 62.8 89.2 77.4 95.6 89.3 94.2 20.8 27.6 9.6 37.2 10.8 22.6 4.4 10.7 5.8 89.6 91.7 86.2 89.6 85.5 95.1 89.1 93.7 88.4 10.4 8.3 13.8 10.4 14.5 4.9 10.9 6.3 11.6 31.3 30.6 32.5 30.5 32.5 30.2 32.5 31.2 32.5 12.5 12.5 12.6 12.5 12.7 12.4 12.4 12.4 12.3 27.5 28.3 26 27.9 25.5 29.9 29.4 28.2 26.8
Fecundity Status
64.3 16.3 19.4
Educational Attainment
Educational Attainment (%) Total (%)
No medical help to get pregnant (%)
Age at interview (in years) Age at menarche (in years) BMI
Impaired Fecundity (%) Presumed Fecund (%) Non-smoker past 12 mos. (%) Recent/Current smoker (%)
Medical help to get pregnant (%)
Total Race/Ethnicity
35
Table 4. Infertility Status*♦:Weighted Descriptive Statistics of Variables Included in Analysis
N=4,454
*Infertility status includes only married or cohabitating respondents.
♦Surgically sterile respondents are omitted from the analytic sample.
Low High
58.5 41.5
Low High Low High Low High
50.6 49.4 67.9 32.1 81.9 18.1
10.0 11.6 7.7 11.3 7.5 14.1 9.3 11.1 7.8
90.0 88.4 92.3 88.7 92.5 85.9 90.7 88.9 92.2 81.3 74.1 91.5 66.1 90.7 75.3 97.4 90.9 93.9
18.7 25.9 8.5 33.9 9.3 24.7 2.6 9.1 6.1
85.4 88.2 81.5 86.2 81.2 89.7 84.3 91.9 82.9 14.6 11.8 18.5 13.8 18.8 10.3 15.7 8.1 17.1 31.9 31.2 33.3 30.9 32.9 31.0 33.1 31.8 33.9 12.6 12.5 12.7 12.4 12.8 12.6 12.6 12.5 12.4 27.2 28.2 25.7 27.9 25.3 30.3 28.9 28.1 26.7
White Black Hispanic Total
No medical help to get pregnant (%)
Age at interview (in years) Educational Attainment (%)
Age at menarche (in years) BMI
Infertile (%) Presumed Fertile (%) Non-smoker past 12 mos. (%) Recent/Current smoker (%)
Medical help to get pregnant (%)
70.3 9.7 20
Infertility Status
Educational Attainment Race/Ethnicity
36
Table 5. Logistic Regression (Odds Ratios) of Impaired Fecundity: U.S. Women, Aged 22-44, 2011-17 Model 1 Model 2 Model 3 Model 4
Educational Attainment 0.69*** 0.67*** 0.66*** 0.69*** (ref: less than Bachelor’s Degree) (0.07) (0.09) (0.08) (0.07) Race/Ethnicity (ref: White)
Black 0.83*
(0.09)
0.89 0.80* 0.92 (0.12)
0.62*** (0.13) (0.10)
Hispanic 0.64*** 0.59*** 0.61***
(0.07) (0.08) (0.08) (0.08)
College Education x Black 1.14 1.15 (0.28) (0.27) College Education x Hispanic 1.20 1.25
(0.34) (0.32)
Age 1.06*** 1.06***
(0.01) (0.01)
Use of ART 6.42*** 6.42***
(0.81) (0.81)
Age at Menarche 0.96 0.96
(0.03) (0.03) Mother’s Educational Attainment 0.85*** 0.85***
(0.04) (0.04)
BMI 1.05*** 1.05***
(0.01) (0.01)
Smoking Behavior 1.44*** 1.44***
(0.14) (0.14)
Constant 0.28**
(0.02) 0.02*** (0.01) 0.29*** (0.02) 0.02*** (0.01)
F(3, 160)=8.71 F(11, 152)=38.87 F(5, 158)=5.34 F(9, 154)=48.03
Prob>F=0.00 Prob>F=0.00 Prob>F=0.00 Prob>F=0.00
N = 8,849 Notes: ♦
Surgically sterile respondents are omitted from the analytic sample.
37
Table 6. Logistic Regression (Odds Ratios) of Infertility Status†♦: U.S. Women, Aged 22-44, 2011-17 Model 1 Model 2 Model 3 Model 4 Educational Attainment 0.64** 0.63** 0.64** 0.64** (ref: less than Bachelor’s Degree) (0.12) (0.14) (0.14) (0.13) Race/Ethnicity (ref: White)
Black 1.29 1.41 1.29 1.50*
(0.28) (0.34) (0.31) (0.33)
Hispanic 0.99 1.08 0.98 1.08
(0.16) (0.25) (0.18) (0.21)
College Education x Black 1.24 0.98
(0.56) (0.48)
College Education x Hispanic 0.96 1.06
(0.45) (0.48)
Age 1.08*** 1.08***
(0.01) (0.01)
Use of ART 4.06*** 4.05***
(0.71) (0.70)
Age at Menarche 1.05 1.05
(0.05) (0.05)
Mother’s Educational Attainment 0.89 0.90
(0.07) (0.07)
BMI 1.02 1.02
(0.01) (0.01)
Smoking Behavior 1.75*** 1.75***
(0.36) (0.36)
Constant 0.13*** 0.00*** 1.27*** 0.00***
(0.01) (0.00) (0.02) (0.00)
F(3, 160)=2.66 F(11, 152)=11.56 F(5, 158)=1.66 F(9, 154)=14.38
Prob>F=0.05 Prob>F=0.00 Prob>F=0.15 Prob>F=0.00
N = 4,454 Notes: †
Infertility status includes only married or cohabitating respondents. ♦
Surgically sterile respondents are omitted from the analytic sample.
38
Race/Ethnicity
APPENDIX 2
Figure 1. Conceptual Model of the Association between Educational Attainment and Fecundity/Infertility Status in U.S. Women, 22-44 years of age
39 REFERENCES
Alvarez, Sylvia. 2015. “Do some addictions interfere with fertility?” Fertility and Sterility 103(1):22-26.
Amin, V., and Behrman, J.R. 2014. “Do more-schooled women have fewer children and delay childbearing? Evidence from a sample of US twins.” Journal of Population Economics 27(1):1-31.
Anders, Jake. 2012. “The Link between Household Income, University Applications and University Attendance.” Fiscal Studies: The Journal of Applied Public Econ. 33(2):185-210.
Aneshensel, Carol S. 1992. “Social Stress: Theory and Research.” Annual Review of Sociology 18:15-38.
Angley, Meghan, Carla Clark, Renata Howland, Hannah Searing, Wendy Wilcox, and Sang Hee Won. 2016. “Severe Maternal Morbidity in New York City, 2008–2012.” New York City Department of Health and Mental Hygiene. New York, NY.
ASMR - Ethics Committee of the American Society for Reproductive Medicine. 2015. “Disparities in access to effective treatment for infertility in the United States: an Ethics Committee opinion.” Fertility and Sterility 104(5):1104-1110.
Augood, C. K. Duckitt and A.A. Templeton. 1998. “Smoking and female infertility: a systematic review and meta-analysis.” Human Reproduction 133(6):1532-1539.
Bell, Ann V. 2010. “Beyond (financial) accessibility: inequalities within the medicalisation of infertility.” Sociology of Health & Illness 32(4):631-646.
Belsky, Daniel, Avshalom Caspi, Harvey Cohen, William E. Kraus, Sandhya Ramrakha, Richie Poulton, and Terrie E. Moffitt. 2017. “Impact of early personal-history characteristics on the Pace of Aging: implications for clinical trials of therapies to slow aging and extend
healthspan.” Aging 16(4):644-651.
Bitler, Marianne and Lucie Schmidt. 2006. “Health Disparities and Infertility: Impacts of State-level Insurance Mandates.” Fertility and Sterility 85:858–65.
Braveman, P. A., Cubbin, C., Egerter, S., Williams, D. R., & Pamuk, E. 2010. “Socioeconomic disparities in health in the United States: What the patterns tell us.” American Journal of Public Health, 100(Suppl. 1), S186–S196.
40
Chen, E., G. E. Miller, G. H. Brody, and M. K. Lei. 2015. “Neighborhood poverty, college attendance, and diverging profiles of substance use and allostatic load in rural African American youth.” Clinical Psychological Science 3:675–685.
Chen, R. and S.P. Morgan. 1991. "Recent Trends in the Timing of First Births in the United States." Demography 28:513-33.
Coall, D.A., M. Tickner, L.S. McAllister, and P. Sheppard. 2016. “Developmental influences on fertility decisions by women: an evolutionary perspective.” Philosophical Transactions of the Royal Society B 371:1-11.
Dressler, William W., Kathryn S. Oths, and Clarence C. Gravlee. 2015. “Race and Ethnicity in Public Health Research: Models to Explain Health Disparities.” Annual Review of
Anthropology 34:231-252.
Elo, Irma T. 2009. “Social Class Differentials in Health and Mortality: Patterns and Explanations in Comparative Perspective.” Annual Review of Sociology 35: 553-572.
Farmer, Melissa M. and Kenneth F. Ferraro. 2005. “Are Racial Disparities in Health Conditional on Socioeconomic Status?” Social Science andMedicine. 60:191–204.
Gaydosh, Lauren; Schorpp, Kristen M.; Chen, Edith; Miller, Gregory E.; & Harris, Kathleen Mullan. 2018. “College completion predicts lower depression but higher metabolic syndrome among disadvantaged minorities in young adulthood.” Proceedings of the National Academy of Sciences 115(1):109-114.
Geronimus, Arline T. 1992. “The Weathering Hypothesis and the Health of African-American Women and Infants: Evidence and Speculations.” Ethnicity and Disease 2(2):207-221. Greil, Arthur L., Julia McQuillan, Karina M. Shreffler, Katherine M. Johnson, and Kathleen S.
Slauson-Blevins. 2011. “Race-Ethnicity and Medical Services for Infertility: Stratified Reproduction in a Population based Sample of U.S. Women.” Journal of Health and Social Behavior 52(4):493–509.
Greil, Arthur L., Kathleen S. Slauson-Blevins, and Julia McQuillan. 2011. "The Social Construction of Infertility." Sociology Compass 5:736-46.
Guendelman, Sylvia and Laura Stachel. 2011. “Infertility Status and Infertility Treatment: Racial and Ethnic Disparities” Pp. 93-117 in Reducing Racial/Ethnic Disparities in Reproductive and Perinatal Outcomes Boston, MA: Springer.
41
Hardaway, C. R., and V.C. McLoyd. 2009. Escaping poverty and securing middle class status: How race and socioeconomic status shape mobility prospects for African Americans during the transition to adulthood. Journal of Youth and Adolescence 38:242–256. Hoyert, Donna L. 2007. “Maternal mortality and related concepts.” National Center for Health
Statistics. Vital Health Statistics 3(33):1-13.
Hummer, Robert A., D.A. Powers, G.S. Pullum, G.L. Gossman, and W.P. Frisbie. 2007. “Paradox Found (Again): Infant Mortality among the Mexican-Origin Population in the United States.” Demography 44: 441-447.
Hummer, Robert A. and Joseph T. Lariscy. 2011. “Educational Attainment and Adult Mortality,” in International Handbook of Adult Mortality, ed. Richard G. Rogers and Eileen M. Crimmins. New York: Springer.
Inhorn, Marcia C., Rosario Ceballo, and Robert Nachtigall. 2009. “Marginalized, Invisible, and Unwanted: American Minority Struggles with Infertility and Assisted Conception.” Pp 181–97 in Marginalized Reproduction: Ethnicity, Infertility, and Reproductive
Technologies, edited by L. Culley, N. Hudson, and F. van Rooij. London: Earthscan. Jackson, J. S., K.M. Knight, and J.A. Rafferty. 2010. “Race and unhealthy behaviors: Chronic
stress, the HPA axis, and physical and mental health disparities over the life course.” American Journal of Public Health 100:933–939.
Jain, T. 2006. “Socioeconomic and racial disparities among infertility patients seeking care.” Fertility and Sterility 85(4):876–81.
James, S. A., D. S. Strogatz, S. B. Wing, and D. L. Ramsey. 1987. “Socioeconomic status, John Henryism, and hypertension in blacks and whites.” American Journal of Epidemiology 126:664–673.
James, Sherman A. 1994. John Henryism and the Health of African-Americans. Culture, Medicine and Psychiatry. 18:163-182.
Johnson, S. E., J.A. Richeson, and E.J. Finkel. 2011. “Middle class and marginal?
Socioeconomic status, stigma, and self-regulation at an elite university.” Journal of Personality and Social Psychology 100:838–852.
Komura H., Akira Miyake, Chu-Fung Chen, Osamu Tanizawa, and Hiromichi Yoshikawa. 1992. “Relationship of age at menarche and subsequent fertility.” European Journal of
Obstetrics and Gynecology 44(3):201–203.
Kuntz, Benjamin, and Thomas Lampert. 2013. “Educational Differences in Smoking among Adolescents in Germany: What is the Role of Parental and Adolescent Education Levels and Intergenerational Educational Mobility?” International Journal of Environmental Research and Public Health 10(7):3015-3032.
42
Link, Bruce G. and Jo Phelan. 1995. “Social Conditions as Fundamental Causes of Disease.” Journal of Health and Social Behavior Extra Issue: 80-94.
Martin, J., B. Hamilton, M. OSterman, A. Driscoll, and T. Mathews. 2017. “Births: Final Data for 2015. National vital statistics reports: From the Centers for Disease Control and Prevention.” National Center for Health Statistics, National Vital Statistics System 66 (1):1-70.
Martinez, Gladys M., Kimberly Daniels, and Isaedmarie Febo-Vazquez. 2018. “Fertility of Men and Women Aged 15–44 in the United States: National Survey of Family Growth, 2011– 2015.” National Health Statistics Reports No. 113. Hyattsville, MD: National Center for Health Statistics.
Mathews, T. J.; Brady E. Hamilton. 2009. “Delayed Childbearing: More Women Are Having Their First Child Later in Life.” National Centers for Health Statistics Data Brief No. 21. Accessed July 5, 2018
http://www.cdc.gov.libproxy.lib.unc.edu/nchs/data/databriefs/db21.pdf
McEwen, Bruce S., and Eliot Stellar. 1993. “Stress and the Individual: Mechanisms Leading to Disease.” Archives of Internal Medicine 153(18):2093-2101.
McKinnon, Craig J., Elizabeth E. Hatch, Kenneth J. Rothman, Ellen M. Mikklelsen, Amelia K. Wesselink, Kristen A. Hahn, and Lauren A. Wise. 2016. “Body mass index, physical activity and fecundability in a North American preconception cohort study.” Fertility and Sterility 106(2):451-459.
Metcalf, M.G., D.S. Skidmore, G.F. Lowry, and J.A. Mackenzie. 1983. “Incidence of ovulation in the years after the menarche.” Journal of Endocrinology 97(2):213–219.
Meyer, Ilan H., Sharon Schwartz, and David M. Frost. 2008. “Social patterning of stress and coping: Does disadvantaged social status confer more stress and fewer coping resources?” Social Science & Medicine 67(3):368-379.
Mezuk, Briana, Cleopatra M. Abdou, Darreell Hudson, Kiarri N. Kershaw, Jane A. Rafferty, Hedwig Lee, and James S. Jackson. 2013. “‘White Box’ Epidemiology and the Social Neuroscience of the Health Behaviors: The Environmental Affordances Model.” Society and Mental Health 3(2):79–95.
Miller, Gregory E., Tianyi Yu, Edith Chen, and Gene H. Brody. 2015. “Self-control forecasts better psychosocial outcomes but faster epigenetic aging in low-SES youth.” Proceedings of the National Academy of Sciences 112(33):10325-10330.