PEDESTRIAN VELOCITY OBSTACLES:
PEDESTRIAN SIMULATION THROUGH REASONING IN VELOCITY SPACE
Sean Curtis
A dissertation submitted to the faculty of the University of North Carolina at Chapel Hill in partial fulfillment of the requirements for the degree of Doctor of Philosophy in the
Department of Computer Science.
Chapel Hill 2013
Approved by:
Dinesh Manocha
Ming Lin
Jur van den Berg
Ron Alterovitz
©2013 Sean Curtis
ABSTRACT
SEAN CURTIS: Pedestrian Velocity Obstacles: Pedestrian Simulation through Reasoning in Velocity Space
(Under the direction of Dinesh Manocha)
We live in a populous world. Furthermore, as social animals, we participate in activities which
draw us together into shared spaces – office buildings, city sidewalks, parks, events (e.g., religious,
sporting, or political), etc. Models that can predict how crowds of humans behave in such settings
would be valuable in allowing us to analyze the designs for novel environments and anticipate issues
with space utility and safety. They would also better enable robots to safely work in a common
environment with humans. Furthermore, credible simulation of crowds of humans would allow
us to populate virtual worlds, helping to increase the immersive properties of virtual reality or
entertainment applications.
We propose a new model for pedestrian crowd simulation: Pedestrian Velocity Obstacles
(PedVO). PedVO is based on Optimal Reciprocal Collision Avoidance (ORCA), a local navigation
algorithm for computing optimal feasible velocities which simultaneously avoid collisions while still
allowing the agents to progress toward their individual goals. PedVO extends ORCA by introducing
new models of pedestrian behavior and relationships in conjunction with a modified geometric
optimization planning technique to efficiently simulate agents with improved human-like behaviors.
PedVO introduces asymmetric relationships between agents through two complementary
tech-niques: Composite Agents and Right of Way. The former exploits the underlying collision avoidance
mechanism to encode abstract factors and the latter modifies the optimization algorithm’s constraint
definition to enforce asymmetric coordination. PedVO further changes the optimization algorithm
to more fully encode the agent’s knowledge of its environment, allowing the agent to make more
intelligent decisions, leading to a better utilization of space and improved flow. PedVO incorporates a
new model, which works in conjunction with the local planning algorithm, to introduce a ubiquitous
also provide a physically-plausible, interactive model for simulating walking motion to support the
computed agent trajectories. We evaluate these techniques by simulating various scenarios, such as
pedestrian experiments and a challenging real-world scenario: simulating the performance of the
ACKNOWLEDGEMENTS
While I have always striven for an idealized goal – that the work in this dissertation is the product
solely of my industry, creativity, and intellect – the simple reality is that this work would not have
been possible without the invaluable assistance of many people.
First, I would never have reached this finish line without the unflagging support of my research
adviser, Dinesh Manocha. His constant support and belief in me helped me push through the
intellectual droughts and brought me back from industry after I believed I was done. His grand
vision introduced me to the domain of pedestrian dynamics and helped me wend my way through
this unfamiliar terrain.
I must also acknowledge my friend and committee member, Jur van den Berg. So much of
this work is built on his sterling work in robotics and motion planning. His seed made all of my
accomplishments possible. His excitement for research and science made him a ready participant in
brainstorming and “what-if” conversations.
I’m grateful for my committee, Ming Lin, Ron Alterovitz, and Gary Bishop, for their gracious
patience and insightful feedback. Their oversight has given me the opportunity to further refine and
polish.
The meat of this work, the details which made the grand ideas work, are largely due to my good
friends and respected colleagues in GAMMA, some who have served as co-authors and some who
have helped me “behind the scenes”, as it were, in focusing my ideas and refining my presentation.
Without the intellectual contributions of Stephen Guy, Yeron´eeHengchin Yeh, Jamie Snape, Abhinav Golas, David Wilkie, Sujeong Kim, Nikunj Raghuvanshi (who lent his likeness to the visualization
of virtual pilgrims), Ravish Mehra, and Rahul Narain much of this work would never have come to
fruition.
It has been often said, that obtaining a Ph.D. is a difficult journey. Mine was made smoother and
Brandenburg, Peter Lincoln, Ryan Schubert, Luv Kohli, David Feng (who also appears in the crowd
visualizations), Sachin Patil, and too many more to mention.
Finally, I am immensely grateful to the funding sources that allowed me to pursue this research
over the years: ARO Contracts: DAAD19-02-1-0390, W911NF-10-1-0506, and W911NF-04-1-0088;
NSF awards: 0400134, 0404088, 0429583, 0917040, 0904990, 100057, 1000579, 1117127, 1117129,
and 1142382; DARPA/RDECOM Contract N61339-04-C-0043; corporate sponsorship from Intel,
TABLE OF CONTENTS
LIST OF TABLES . . . xiv
LIST OF FIGURES . . . xv
1 Introduction . . . 1
1.1 Pedestrian Dynamics . . . 3
1.1.1 The Ideal Model . . . 4
1.1.2 Challenges . . . 6
1.2 Crowd Simulation . . . 8
1.2.1 Velocity Obstacles . . . 11
1.3 Thesis Statement . . . 15
1.4 Main Results . . . 15
1.4.1 Organization . . . 23
2 Crowd Simulation . . . 24
2.1 Commercial Crowd Simulation . . . 24
2.2 Pedestrian Models . . . 25
2.2.1 Macroscopic Models. . . 26
2.2.2 Microscopic Models . . . 28
2.2.2.1 Cellular Automata . . . 29
2.2.2.2 Social-Force Models . . . 31
2.2.2.3 Rule-based . . . 38
2.2.2.4 Vision-based . . . 40
2.2.2.5 Velocity Obstacle . . . 40
2.4 Why Velocity Obstacles? . . . 47
3 Composite Agents . . . 52
3.1 Introduction. . . 52
3.2 Related Work . . . 53
3.3 Composite Agents . . . 54
3.3.1 Definitions and Background . . . 54
3.3.2 Composite Agents Formulation . . . 55
3.3.3 Influence of Composite Agents . . . 56
3.4 Modeling Intangible Factors . . . 57
3.4.1 Aggression . . . 57
3.4.2 Social Priority . . . 59
3.4.3 Authority . . . 60
3.4.4 Protection and Guidance Behavior . . . 62
3.5 Implementation . . . 63
3.6 Results . . . 65
3.7 Conclusions and Future Work . . . 69
4 Right of Way . . . 70
4.1 Introduction. . . 70
4.2 Related Work . . . 72
4.2.1 Crowd Simulation . . . 73
4.2.2 Behavior Modeling . . . 74
4.3 Pedestrian Models . . . 74
4.3.1 Notation . . . 75
4.3.2 Social Forces . . . 75
4.3.3 Social Forces with Explicit Collision Prediction . . . 76
4.3.4 Optimal Reciprocal Collision Avoidance . . . 77
4.4.1 Applying Right of Way . . . 79
4.4.2 Social Forces . . . 80
4.4.3 Social Forces with Explicit Collision Prediction . . . 82
4.4.4 Velocity Obstacles . . . 84
4.5 Analysis and Results . . . 84
4.5.1 Right of Way Experiments . . . 85
4.5.1.1 Experiment 1 . . . 87
4.5.1.2 Experiment 2 . . . 88
4.5.1.3 Experiment 3 . . . 89
4.5.1.4 Experiment 4 . . . 89
4.5.2 Narrow Passages . . . 90
4.5.3 The Tawaf . . . 92
4.5.4 Comparison with Composite Agents . . . 95
4.6 Summary and Limitations . . . 97
4.6.1 Summary . . . 97
4.6.2 Limitation . . . 98
5 Wayportals . . . 99
5.1 Introduction. . . 99
5.2 Related Work . . . 100
5.3 Local Navigation and Line-Segment Goals . . . 102
5.3.1 Velocity Obstacles . . . 102
5.3.2 Goal Space to Velocity Space . . . 103
5.4 Velocity Segment . . . 104
5.4.1 Segment-based Optimization . . . 105
5.4.2 Velocity Bias . . . 107
5.4.3 Segment-Arc Error . . . 107
5.4.5 Arc Expansion . . . 109
5.5 Global Navigation . . . 111
5.5.1 Waypoints and Way Portals . . . 111
5.5.2 Path Planning . . . 112
5.5.3 Navigation Mesh . . . 113
5.6 Results . . . 114
5.7 Conclusions and Future Work . . . 118
6 Adherence to the Fundamental Diagram . . . 120
6.1 Introduction. . . 120
6.2 Related Work . . . 123
6.3 Models of Crowd Simulation . . . 124
6.4 Density-dependent Behavior . . . 126
6.4.1 Fundamental Diagram Intention Filter . . . 126
6.5 Results . . . 130
6.5.1 Adherence to the Fundamental Diagram . . . 131
6.5.1.1 One-dimensional Fundamental Diagram . . . 131
6.5.1.2 Two-dimensional, Uni-directional Flow . . . 132
6.5.1.3 Two-dimensional, Bi-directional Flow . . . 133
6.5.1.4 Two-dimensional, Cross Flow . . . 134
6.5.2 Trajectory Smoothness . . . 134
6.5.3 Inter-agent Collisions . . . 136
6.6 Conclusion . . . 138
6.6.1 Limitations and Future Work . . . 139
7 Locomotion Synthesis for Crowds . . . 140
7.1 Introduction. . . 140
7.2 Related Work . . . 142
7.3.1 Gait Properties . . . 144
7.3.2 Notation . . . 146
7.3.3 Motion Warping . . . 147
7.4 Gait Transformation . . . 147
7.4.1 Offline processing . . . 148
7.4.2 Steady-state Gait . . . 150
7.4.3 Mid-stride acceleration . . . 152
7.4.4 Turning . . . 153
7.4.5 Inverse Kinematics Solver . . . 155
7.5 Results and Analysis . . . 155
7.5.1 Artist Interaction . . . 156
7.5.2 Dynamic Correctness . . . 156
7.5.3 Performance . . . 160
7.5.4 Limitations . . . 160
7.6 Conclusion . . . 160
7.6.1 Future work . . . 161
8 Modeling the Tawaf . . . 162
8.1 Introduction. . . 162
8.2 Related Work . . . 164
8.2.1 Crowd Simulation . . . 165
8.2.2 Behavior Modeling . . . 165
8.2.3 Tawaf Simulation . . . 166
8.3 Modeling Crowd Behaviors . . . 167
8.3.1 Agent-based Simulations. . . 167
8.3.2 The Behavior Finite State Machine . . . 168
8.4 Pedestrian Modeling . . . 169
8.5.1 The Rite . . . 173
8.5.2 Population Characteristics . . . 174
8.5.3 The Tawaf FSM . . . 175
8.6 Results . . . 178
8.6.1 Limitations . . . 182
8.6.2 Conclusion . . . 182
9 Conclusion . . . 184
9.1 Summary of Results . . . 185
9.2 Limitations . . . 188
9.3 Future Work . . . 191
A Default Value for Gait Functions . . . 193
LIST OF TABLES
3.1 Computation and memory cost of proxy agents . . . 68
5.1 Computation cost of wayportals over waypoints . . . 117
5.2 Consistency of simulation over varying time step sizes . . . 117
6.1 Impact of FDIF on trajectory smoothness . . . 136
6.2 Impact of FDIF on simulation collision rate. . . 138
7.1 The motion channels and their corresponding warp types . . . 149
7.2 The warp function constraints for steady-state gait . . . 150
7.3 Foot flexion function constraints . . . 151
LIST OF FIGURES
1.1 Photos from the Jamarat Bridge and Love Parade . . . 2
1.2 Architecture of a pedestrian simulator . . . 8
1.3 Illustration of predictive responses . . . 12
1.4 An agent and an obstacle . . . 12
1.5 Inadmissible velocities due to an obstacle . . . 12
1.6 Truncated VO cone . . . 13
1.7 Feasibility tests on the VO . . . 13
1.8 Optimizing with the VO . . . 13
1.9 VO for moving obstacles . . . 13
1.10 Architecture of a velocity obstacle tactical module . . . 14
1.11 Illustration of main contributions . . . 15
2.1 Illustration of repulsive forces . . . 37
2.2 Error in velocity prediction . . . 41
2.3 The union of multiple velocity obstacles . . . 41
2.4 Illustration of ORCA constraint computation . . . 44
2.5 Comparison of multi-agent responses in social forces and velocity obstacles . . . 50
3.1 The effect of a composite agent on its neighbor . . . 57
3.2 The aggression proxy agent . . . 59
3.3 The priority proxy agent . . . 60
3.4 The authority proxy agent . . . 61
3.5 The protection and guidance proxy agents . . . 63
3.6 The set of Reciprocal Velocity Obstacles acting on agentA. . . 64
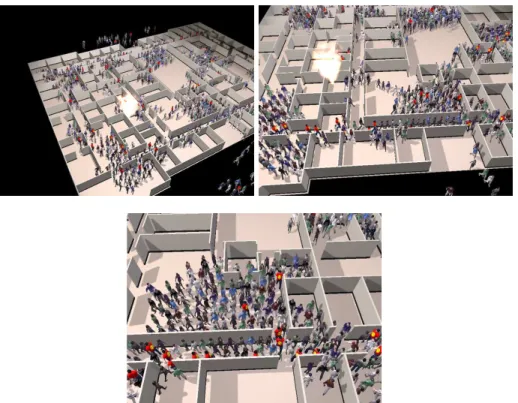
3.7 Rendering of emergency evacuation using aggressive proxy agents . . . 66
3.8 Rendering of subway station using priority proxy agents . . . 67
4.1 Repulsive social forces which cancel . . . 81
4.2 Illustration of experiments for evaluating right of way . . . 85
4.3 Impact of right of way on experiment 1 . . . 87
4.4 Impact of right of way on experiment 2 . . . 88
4.5 Impact of right of way on experiment 3 . . . 89
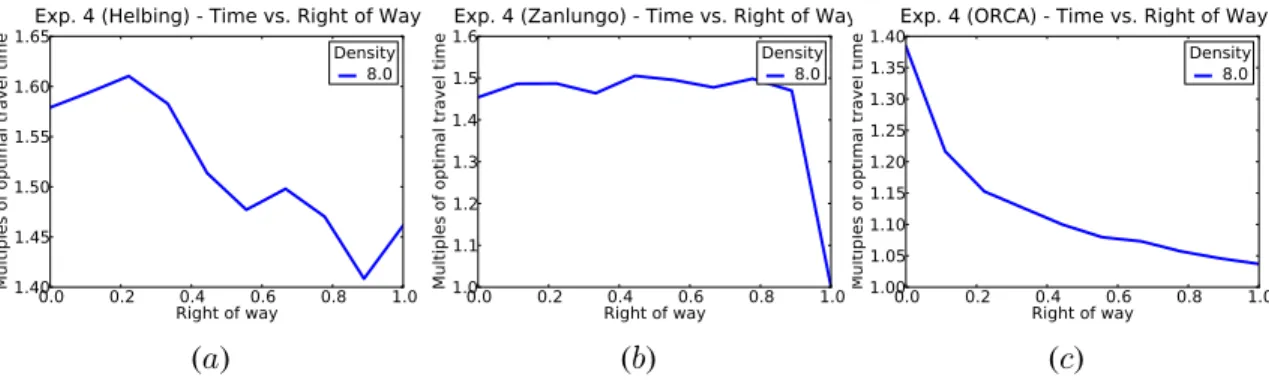
4.6 Impact of right of way on experiment 4 . . . 90
4.7 Agents in a bottleneck . . . 91
4.8 Impact of right of way on flow through bottlenecks . . . 92
4.9 The layout of the Mataf floor in the Al-Masjid al Har¯am . . . 93
4.10 Photograph of pilgrims performing the Tawaf . . . 94
4.11 Black Stone queuewithoutright of way . . . 94
4.12 Black Stone queuewithright of way . . . 95
5.1 Optimizing linear ORCA constraints with respect to a velocity arc . . . 104
5.2 Results for using wayportals in the 16-block experiment. . . 114
5.3 Results for using wayportals in the infinity experiment . . . 115
5.4 Results for using wayportals in the dungeon experiment . . . 115
5.5 Results for using wayportals in the castle experiment . . . 116
5.6 Consistency of collision rates at varying time steps . . . 118
6.1 Diagram of system using Intention Filter . . . 122
6.2 Plot of the “fundamental diagram” in pedestrian dynamics . . . 127
6.3 Illustration of fundamental diagram experiments . . . 131
6.4 Simulation results for 1D experiment . . . 132
6.5 Simulation results for uni-directional flow experiment . . . 133
6.6 Illustration of FDIF on trajectory smoothness . . . 137
7.1 Illustration of the walking gait cycle . . . 144
7.3 Illustration of gait generation system . . . 148
7.4 Transformation of straight-line motion into turning motion . . . 154
7.5 Interface for editing gait functions . . . 156
7.6 Analysis of the minimum coefficient of friction . . . 158
7.7 Analysis of the zero-moment point . . . 159
8.1 System for simulating the Tawaf . . . 168
8.2 The layout of the Mataf area in the Al-Masjid al Har¯am . . . 173
8.3 Approximation of pedestrians using disks . . . 175
8.4 The finite state machine for performing the Tawaf . . . 176
8.5 Density of virtual pilgrims . . . 179
8.6 Speeds of virtual pilgrims. . . 179
8.7 Measured mean speeds of real pilgrims . . . 180
CHAPTER 1: INTRODUCTION
On January 12, 2006, 345 pilgrims were killed and hundreds more injured in Makkah. The
deaths occurred during performance of the “stoning of the devil,” one of the rituals which make up
the Hajj. Pilgrims pass by three pillars. As they pass by, they throw seven pebbles at each of the
three pillars. Ideally, pilgrims perform the rite near noon on the last day of the Hajj. This led to an
estimated 700,000 pilgrims trying to perform the ritual simultaneously which set the conditions for
the deaths and injuries. This was not the first such occurrence. There have been an additional six
such occurrences dating back to 1990. (Fatah, 2006). Figure 1.1(a) shows the scale of the crowds
involved in the performance of this ritual.
The Love Parade was born at the end of the Cold War in Berlin in 1989. It began as a combination
celebration-demonstration of the principles of Friede, Freude, and Eierkuchen (peace, joy, and pancakes) set to European techno-music. Through the 1990s, the celebration grew from 150
participants to more than one million participants in 1997 (Love Parade history, n.d.). However, on
July 24, 2010, during the Love Parade held in Duisburg, Germany, 21 people were trampled and
a further 500 people injured (Love Parade, 2010). Congestion built up on a ramp that served as
the only entrance and exit to the grounds which eventually led to pressure waves in the crowd (see
Figure 1.1(b)). The pressure waves caused some participants to fall and others to become asphyxiated
due the to compression of their torsos (Love Parade, 2010)
In both of these recent examples, tragedy arose when the actions of thousands of pedestrians
produced dangerous, unpredicted behavior. It was only in retrospect, in analyzing the available
data, that the relationship between the environment’s design and the potential for danger were fully
recognized. In the case of the Hajj pilgrims, pilgrims flowed towards the area containing the three
pillars from multiple directions. The intersection of contrary flows of pedestrians led to irregular
patterns of motion in the crowd, which, in turn, led to the deaths (Helbing et al., 2007). At the Love
(a) (b)
Figure 1.1: Photographs illustrating the scale of the crowds in the Jamarat Bridge and Love Parade disasters. (a) One of the pedestrian walkways approaching the newly constructed Jamarat bridge. (b) The crowd near the tunnel at which the tragedy occurred.
grounds coupled with inadequate recognition of the crowd’s state by the festival’s organizers and
safety officers (Love Parade, 2010).
The gatherings in which these tragedies occurred are not unique. As our world grows increasingly
more populous, the frequency at which large groups of people gather is likely to increase.Post hoc
analysis of past tragedies, such as these, afford us the ability to learn from our mistakes. However,
would it not be preferable to take a more pro-active approach during the planning of such large-scale
events? Can we answer the question, “How will pedestrians react to this space” before the tragedy?
If so, danger to the participants could be anticipated and mitigated before a single ticket is sold.
This type of simulation can also benefit applications which need to be able to track pedestrians
automatically, e.g., security and robotics (Breitenstein et al., 2010; Ess et al., 2009). In security
applications, it may be necessary to track a suspicious individual through a crowd. It would be
impractical for humans to perform this tracking manually and we must ultimately rely on computer
algorithms to do so. Similarly, robots are becoming more ubiquitous and we look towards a future
which includes assistive robots. For robots and humans to safely interact in a shared space, the robots
need to be able to anticipate human behavior so they can respond appropriately to eliminate risk to
the humans. An accurate model of pedestrian behavior can serve as a reliable basis for tracking and
prediction, making tracking applications more robust.
In visual applications, such as virtual reality, interactive games, or entertainment, it is important
virtual ghost town. Adding realistic or plausible crowds to these applications would improve the
application’s believability and immersive quality.
All of these problems have something in common; they all rely on models of pedestrian
move-ment to make predictions. It seems reasonable that if we can model pedestrians at a level of fidelity
that allows us to accurately and reliably predict pedestrian behaviors in complex environments and
scenarios, then the principles learned and techniques derived will naturally benefit all applications
which require predictive models of pedestrian motion.
The ultimate goal of work such as ours is a pedestrian simulator that can produce accurate
behaviors of crowds of pedestrians in complex, realistic scenarios without requiring extensive domain
expertise. The work in this dissertation is simply one step in the direction towards this ultimate goal.
1.1 Pedestrian Dynamics
[The ship’s] crew of four were ill at ease knowing that they had been brought together not
of their own volition or by simple coincidence, but by some curious principle of physics
as if relationships between people were susceptible to the same laws that governed the
relationships between atoms and molecules.
Douglas Adams, The Hitchhiker’s Guide to the Galaxy
Pedestrian dynamics is the study of the way that pedestrians interact in a shared space. Its
goal is to divine the underlying “laws” which govern how humans think and act in crowds and
to successfully model them in simulation. It encompasses such diverse topics as biomechanics,
psychology, physiology, and sociology. The product of this field is a model by which we can reliably
predict how crowds of real people will behave in a theoretical environment.
Pedestrian dynamics includes more than the properties of individual pedestrians. Generally,
we can assume that, in a crowd of strangers, pedestrians perform independent analysis of their
environment and make uncoordinated decisions. And yet, the aggregate result of a large group of
individuals makinglocaldecisions is aglobalcrowd behavior. The crowd as a whole can be thought of as an entity with its own properties and behaviors. Pedestrian dynamics studies the aggregate
1.1.1 The Ideal Model
Before examining particular models of crowd behavior, we would like to introduce the notion of
a hypothetical “ideal” crowd model. We will also discuss the challenges inherent in creating such a
model. Later, as we discuss particular models, we will compare them with this theoretical ideal.
We will describe the ideal crowd model with respect to three properties: efficiency, robustness,
and accuracy.
Efficiency: The efficiency of a crowd model refers to the cost of evaluation – how much compute time is required to produce one second of simulated results? Generally, we can say that no algorithm
is ever too efficient. Even applications which are not designed for interactive operation would benefit
from the most efficient algorithms possible.
Faster algorithms provide faster results. Faster results empower planners and architects during
the design phase; fast results allow designers to evaluate multiple, incremental iterations of a design.
Furthermore, the ability to run more iterations in a fixed amount of time can lead to more robust
simulation results; for a fixed environment, multiple simulations, with randomly perturbed parameters,
can be computed and the results combined to create a more complete picture of the characteristics of
the designed space.
In addition, efficient algorithms imply efficient power usage. In this day of mobile computing,
power-efficient algorithms admit the possibility of performing simulations on mobile devices at
arbitrary times and locations. If the algorithm is efficient enough, crowd management experts could
use crowd simulation techniques on mobile devices to perform local predictions to assess local crowd
conditions interactively.
The efficiency of a pedestrian model is a property of the computation model. The most typical
computation model is that of aninitial value problem. Given an initial system state and rules for how the state changes with respect to time, we iteratively apply those rules to determine what the
system’s state is at some later time. Each iteration advances the simulation by a discrete step in
time. If small time steps are used, many simulation steps must be computed to reach the target time.
Conversely, using large time steps leads to fewer iterations, however, arbitrarily large time steps can
It is clear, that the overall efficiency of the model is dependent on the cost of computing a single
time step and the number of time steps taken. We refer to the former as a model’scostand the latter as itsstability.
Cost is the computational time taken to evaluate a single simulation step. How much
computa-tional time, per agent, must be performed to update the agent’s simulation state. We measure
this in seconds and smaller numbers are better.
Stability is the simulation model’s ability to take large time steps and still produce accurate
results. Not all models can take arbitrarily-sized time steps due to the mathematical properties
of the formulation. For some models, it is necessary to take small time steps in order to produce
reliable and consistent behavior. Other models may admit larger time steps. We measure stability
as the largest time step that produces reliable, consistent results. We measure this quantity in
seconds and larger numbers are better.
We define efficiency, a unit-less numerical value, as stability / cost. There is no maximum value
for efficiency. The ideal model has “maximum” efficiency in the sense that it makes full, optimal use
of existing hardware. Algorithms approach the ideal efficiency by reducing the computational time
of a single simulation step (cost), increasing the size of a valid time step (stability) or, ideally, both.
Robustness: The ideal pedestrian model should capture those elements of human thought and behavior which define the basis of how humans interact with each other and their environments in a
shared space. The parameters of the model represent a pedestrian. As such, these parameters should
not depend on the environment or the conditions of the simulation. These parameters should only
change because the pedestrian is different (e.g., old vs. young, American vs. Chinese, etc.). Arobust
simulator should allow us to define a single space of parameter values for modeling a particular
population and those parameter values should be equally applicable across arbitrary scenarios.
The danger of changing simulation parameters across scenarios, for what should be the same
population, is that we are no longer evaluating the population, but we are evaluating our expectations
for the crowd. When tuning simulation parameters, how do we know we have the “right” parameters?
Because we determine the behavior to be reasonable. We are no longer determining what the
population would do, we are merely determining if our simulation paradigm can conform to what we
It needs to be emphasized, that this in no way requires particular pedestrian parameters to be
fixed during the duration of a simulation. For example, it is reasonable to simulate pedestrians
growing tired. As a pedestrian grows increasingly tired, we can assume the pedestrians walking
speed decreases. This behavior is consistent with the idea of a robust crowd model as long as
transformations of the simulation properties arises from a well-principled and testable models and
not by human “parameter tuning.”
Accuracy: The final, and most vital property, is the simulator’s accuracy. Accuracy is a relative quantity. It must be accurate to the level required by a particular application domain. For example, in
creating crowds for movies, plausibility and the ability to control the crowd to support a narrative
agenda are more important than strict “realism.” However, in performing safety analysis, the model
must produce behaviors that are consistent with those observed in real humans. One of the challenges
in creating an ideal simulator is determining and quantifying the required level of accuracy. The
usefulness of the simulator is wholly dependent on it exhibiting sufficient accuracy. High efficiency
and robustness avail nothing, if the behavior is not credible. The ideal simulator would be able
to capture, with perfect fidelity, human behavior and that, modulo the visualization, would be
indistinguishable from corresponding trajectories and behaviors observed in a similar pedestrian
crowd.
1.1.2 Challenges
There are some significant challenges in creating an ideal pedestrian model and crowd simulator.
• There is no ground truth. In many other simulation domains, the phenomena being simulated
are governed by well-defined mathematical equations (e.g. fluid dynamics, rigid-body
dynam-ics, etc.) There are no such equations for pedestrian dynamics. Because of this, evaluating the
accuracy of a crowd model becomes problematic.
Typically, validation is performed empirically, using both qualitative and quantitative
techniques. Qualitatively, it has been observed that crowds of pedestrians exhibit certain
emergent behaviors(Still, 2000). These behaviors arise, not because of explicit coordination between pedestrians, but as the result of each pedestrian pursuing independent goals with
swirling, etc. Generally, the presence of these types of emergent behaviors is necessary1for a
crowd model to be considered plausible.
In the absence of a mathematical ground truth, quantitative validation is performed by
comparing measurable properties of the crowd. Such properties include flow, density, speed,
etc. It is unclear what a “complete” set of such metrics should include. Furthermore, we do not
know how they change based on varying circumstances. This approach allows us to validate
against particular data, but may not necessarily validate the ability of the model to extrapolate
beyond the sampled data.
• Crowds of humans manifest a great deal of variability. Even in a simple case where two
pedestrians perform the same task over and over, there is inevitable variation in the trajectories
of the pedestrians. Accordingly, “correct” behavior is not a single result, but a space of results.
This limits our ability to determine if a simulation result is “close enough” to real-world data
to consider it to be plausible. As we collect more real-world data we can expand the definition
of “realistic,” but collecting such data is logistically challenging.
• The individuals which make up a crowd vary with respect to each other. Beyond the obviously
differing physical properties (such as height and weight), there are also invisible physiological
and psychological differences which cause two pedestrians to respond to the same conditions in
different ways. These individual variations contribute to the aforementioned crowd variability.
It is unclear to what degree accounting for such variations is necessary. More study is required
to understand what role such variations play; under some circumstances they may be negligible,
and in others, they may dominate the resultant behaviors.
The ultimate goal is to devise an algorithm which implicity models the “rules” that govern
human interactions as if, as Douglas Adams wrote, ”...relationships between people were susceptible
to the same laws that governed the relationships between atoms and molecules.” (Adams, 1900) In
achieving this goal, we enable designers, architects, city planners, emergency personnel, etc. to better
understand and anticipate how crowds of people will behave in arbitrary spaces, leading to safer
buildings and events.
1
Cognitive
S
G
Strategic
S
G
Tactical Kinematic
Behavioral
Physiological
Goal Preferred
Velocity
Velocity
Environment
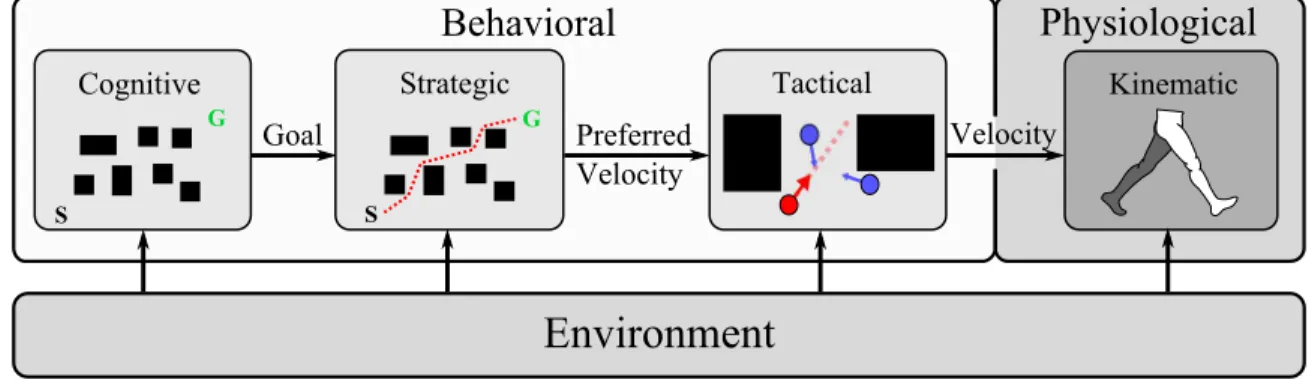
Figure 1.2: The architecture of a typical pedestrian simulator. Objectives are defined in the cognitive module and provided to the strategic module. Plans are formulated in the strategic module and generate preferred velocities for the agent at every time step. The tactical model transforms the preferred velocity to a viable instantaneous velocity. Finally, the instantaneous velocity is mapped to kinematic motion on virtual humans. All tasks are performed with respect to the simulation environment.
1.2 Crowd Simulation
A typical system2for simulating crowds of pedestrians is sub-divided into hierarchical layers .
Each layer corresponds to solving a different problem. Figure 1.2 illustrates a common architecture.
The four modules shown correspond to four aspects of crowd simulation:
1. Deciding where each pedestrian wants to go – his objective.
2. Determining the plan for reaching the objective, producing apreferred velocityat each time step.
3. Tactically adapting the plan to accommodate for unplanned, dynamic obstacles by modifying
the preferred velocity.
4. Computing the body movement consistent with a person moving the tactically computed
adapted velocity.
Each of these problems exists at an inherent time scale. Selecting an objective exists at the
largest time scale. It could be a single objective that would require hours to achieve, or a sequence of
related objectives – buying a train ticket, walking to the platform, entering the train, waiting, exiting
the train, walking home, etc. The strategic module computes a plan to achieve the objective, such as a
2(e.g., (Bandini et al., 2011; Helbing and Moln´ar, 1995; Chraibi et al., 2010; Ondˇrej et al., 2010; Reynolds, 1999; Shao
path through a train station. The path is composed of various “legs” and turning points. The duration
of each leg is only a portion of the overall plan, so they exist in a medium time scale (relative to time
scale of selecting an objective). There may be obstacles to the exact execution of the strategic plan
– dynamic obstacles, such as other people, may require small changes to the path. These changes
are purely local, spatially and temporally, and only impact a small time frame, seconds at most.
A pedestrian looks seconds ahead and determines if his intended immediate path is feasible, and
modifies local trajectory slightly if he decides it is not. These small modifications only serve as a
local refinement of the medium-scale plan – but the medium-scale and large-scale details remain
unchanged (the pedestrian will still turn at the next corner, and is still proceeding towards the same
objective). The fact that these problems exist at such different temporal scales allows us to apply a
hierarchical, or compositional approach to crowd simulation. Finally, the physiological mechanism
that produces walking motion happens at the finest time scales – typically milliseconds or smaller.
This is the motion that is consistent with the instantaneous velocities provided by the tactical module.
The end result of this simulator is a crowd of pedestrians, walking through a shared space.
The first layer, deciding where each pedestrian wants to go, his objective, belongs to the domain
of high-level behavior. For simple scenarios, such as evacuation scenarios, it is generally assumed
that the pedestrians head for the nearest exit. In a complex scenario, such as a shopping district, a
pedestrian could walk from store to store, entering some and bypassing others. These decisions rely
on abstract thought, a sense of cause and effect, and world knowledge. The selection of goals in
such a sequence can be determined in a number of ways. For example, one can use a data-driven
approach, such as in the redesign of the London Bridge Station; passenger surveys were performed
and then the observed distribution of apparent and reported objectives were used to define objectives
for the simulated agents stochastically (Hutton, 2012). This layer is evaluated infrequently. In many
circumstances, agents may only have a single objective for the entire simulation duration.
The second layer, finding a path to the objective (or goal), is more a mechanical task. Knowing
the ultimate goal, a pedestrian plots out a path in his mind which allows him to reach that goal. For
any given start and goal positions, there is typically not a unique path. It is generally accepted that
pedestrians seek to achieve the path with the lowest “cost.” This cost can refer to distance, travel
time, etc. However, it has been shown that perceived cost is not necessarily the same as actual
motion planning literature, this problem is called “global planning” (LaValle, 2006). To devise a
path from a start to a goal position in an arbitrary environment,globalknowledge is required. A straight-line path may be impossible and, due to various obstructions in the environment, the most
optimal path may temporarily lead away from the goal position. Only by having global knowledge
can this type of path be computed. As with the previous layer, this layer is also evaluated infrequently.
A path only needs to be generated when the ultimate goal changes, or the environment changes in
a way to change the cost of the planned path, rendering the planned path invalid. For a valid path,
some point on the path can be used as animmediategoal for an agent – the point toward which the agent should strive at that time step. For details on global planning algorithms, see Section 5.2.
The third layer, adapting the plan based on local conditions, is typically the core of the pedestrian
model. This planning level is also referred to as “local navigation” or “steering.” The pedestrian
model has a single purpose, given a desired velocity, it computes an actual velocity by considering
local conditions (including static and dynamic obstacles). In contrast to the global-planning layer,
the pedestrian model uses very limited domain knowledge of the environment to compute a feasible
velocity (only nearby agents and obstacles) and the velocity may only be valid for a single simulation
time step. The computation is performed at each time step. How this velocity is computed is the
essence of the model and there is a great deal of variation in solving this problem. See Section 2.2
for details on these types of algorithms.
The fourth layer, computing motion for a human figure, can be an optional layer. Its existence
depends on the application domain. For example, visual applications like virtual reality, interactive
games, or entertainment would generally require it, but flow analysis of a new architectural design
may not. Whether required or not, the simulation of the physical form fits naturally into a pedestrian
simulation paradigm. The motion generation happens the most frequently. Typically, visualization
occurs at 30-60 Hz whereas the simulation could compute velocities at a lower frequency (e.g.,
10-20 Hz). The motion should be physically accurate and consistent with the trajectory the pedestrian
is traveling.
These layers of abstraction communicate at their interfaces. The output of one layer serves as
the input to the next layer down. Typically, the first layer produces a goal position to be used by
the second layer. But it could also provide additional information, such as a deadline by which that
immediate goals are drawn. These immediate goals serve as the basis for a time-dependent function
ofpreferred velocityfor each agent – it is a velocity vector pointing to a point on the path with a magnitude equal to the agent’s preferred walking speed. This preferred velocity serves as an input
to the local navigation algorithm. The third layer provides instantaneous velocity to the final layer,
providing sufficient information for the motion generation to update the virtual human’s skeleton.
The majority of research in pedestrian simulation has primarily focused on the tactical module,
or the local navigation algorithms (see Chapter 2). This component is what is normally referred
to as a “pedestrian model.” Experiments treat the cognitive and strategic layers as black boxes
(typically simplified by suitable assumptions). While there are many types of pedestrian models (see
Section 2.2 for details), this work builds upon the principles of a particular class of local navigation
algorithms: velocity obstacles (VO). To understand the contribution of this work, it is necessary
to have a basic understanding of the VO technique. In the next chapter, we discuss the details of
VO-based models in more detail. But for now, it is sufficient to provide an intuition in how the
VO-based algorithms work.
1.2.1 Velocity Obstacles
Now that we begin to discuss algorithms, it is important to make an important distinction. For the
sake of clarity, we have selected the following arbitrary nomenclature. When we refer to real human
pedestrians, we will simply refer to them as pedestrians. When we discuss simulated pedestrians, we
will refer to them as agents. Ultimately, the goal is for the agents to exhibit the same behaviors as
pedestrians.
The space which the agent and obstacles share is typically calledworkspace. In this space, an obstacle is a region which limits the position or configuration that an agent can occupy; the agent
cannot physically intersect or “collide with” the obstacle. Avelocity obstacleis similar in that it is a region which limits the agent, but it is defined invelocity spaceand it is the set of all velocities that will lead to an eventual collision between the agent and a corresponding workspace obstacle.
Velocity-obstacle-based algorithms inherently perform velocity-based prediction to prevent
collisions. A virtual pedestrian does not simply react to other pedestrians based on their position; it
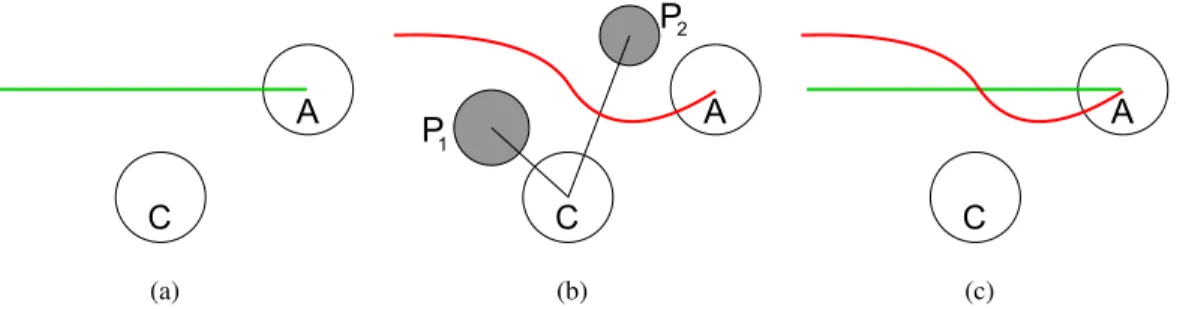
predicts future potential collisions and acts to avoid them. Figure 1.3 illustrates the importance of
(a) (b) (c)
Figure 1.3: Examples of agent interaction between an active agent (the bottom agent) and an obstacle agent (the top agent). (a) The obstacle agent is standing in the active agent’s path. The active agent must respond by adjusting velocity. (b) The obstacle agent is currently in the active agent’s path, but its velocity will move it out of the way. No change to velocity is necessary. (c) The obstacle agent is
notcurrently in the active agent’s path, but its velocity will move it into collision. The active agent must adjust its velocity.
its velocity to avoid contact. If it were to only use relative position, it would mistakenly seek to avoid
the obstacle agent in Figure 1.3(b) and fail to adjust for the obstacle agent in Figure 1.3(c). Velocity
obstacles inherently encode this predictive approach.
Typically, agents are represented as disks in a
two-dimensional (2D) plane. This simplified agent and the obstacles
exist in a common workspace.
Figure 1.4: A simple agent and an obstacle in a shared space.
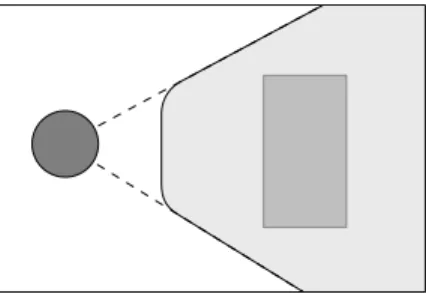
The velocity obstacle (VO) is a cone-like region emanating
from the agent towards the obstacle. The cone is slightly wider
than the physical obstacle because of the agent’s width. If the
agent takes any velocity in this cone and holds it indefinitely, it
will inevitably collide with the obstacle.
VO
The imminence of collision is not the same for all velocities
in the cone; some of those velocities must be maintained for an
exceptionally long duration of time before collision can occur.
Typically, we limit ourselves to examining the velocities that will
lead to a collision within a fixed amount of time. This “truncates”
the cone. The exact contour of the truncation front depends on
the shapes of the agent and the obstacle.
Figure 1.6: Considering only im-minent collisions truncates the cone.
The VO can be used to determine if a velocity is “safe” or
feasible. If a velocity lies inside the VO, then we know that a
collisioncanoccur within the time window. If it lies outside the VO, a collision is not possible.
Figure 1.7: Velocities can be de-fined as “safe” based on the VO.
Pedestrians typically have apreferredvelocity – the velocity they would take in the absence of obstacles. The preferred velocity
is tested against the VO. If it is safe, the agent can take that
velocity. If it is not, the “best” safe velocity should be selected.
The definition of “best” can be arbitrary. One possibility is to
select the velocity that is “closest” to the preferred velocity (based
on Euclidian distance in velocity space).
best "safe" velocity
Figure 1.8: Selecting the “best” safe velocity.
Accounting for a moving obstacle is quite simple. Given
the velocity it is traveling, one simply translates the VO by the
obstacle’s velocity. In fact, the VO can be thought of as the space
ofrelative velocities that lead to collision. When the obstacle is stationary, the relative velocity is the agent’s velocity. By translating the VO, we are factoring out the obstacle’s velocity,
and re-defining the VO in terms of the agent’s absolute velocity.
Figure 1.9: The translated VO for the moving obstacle.
This is the basic velocity obstacle formulation (Fiorini and Shiller, 1998). In fact, similar
Tactical
Compute VOs Optimize Preferred
Velocity
Velocity
Environment
Figure 1.10: The architecture of a velocity obstacle tactical module. The environment, including nearby agents and obstacles, is used to define velocity obstacles. The preferred velocity and the velocity obstacles are used in an optimization algorithm to compute the final, feasible velocity.
(Miller and Everett, 1903; Grant, 1907). The VO algorithm allows for efficient planning around
predictableobstacles.
To apply these techniques to simulating pedestrians, we need to account forresponsiveobstacles, i.e., other pedestrians. These obstacles will not blindly proceed with their previous velocity; they will
respond to the pedestrians around them. There are various ways to handle this, and they are detailed
in Section 2.2.2.5.
With this intuition for velocity obstacles, we can revisit Figure 1.2 and examine the tactical black
box in more detail. Figure 1.10 shows the inside of the velocity obstacle tactical module. It computes
a feasible velocity by computing velocity obstacles from the nearby obstacles (dynamic and static) in
the environment. Next, an optimization algorithm finds the best feasible velocity with respect to the
velocity obstacles.
A velocity-obstacle-based model has several desirable traits. First, the model accounts for current
positions and velocities of the virtual pedestrians. It computes a collision-free velocity by anticipating
future behaviors instead of just current state. Intuitively, this seems consistent with what human
pedestrians do3. Second, it exhibits high efficiency; the algorithm itself is computationally efficient
and has been shown to be quite stable (van den Berg et al., 2009). Third, it offers good theoretical
guarantees for collision-free trajectories (van den Berg et al., 2009). Versions of this model have
even been used to model crowds (Van den Berg et al., 2008; Pettr´e et al., 2009a; Guy et al., 2010a).
It serves an excellent starting point for pedestrian modeling.
3
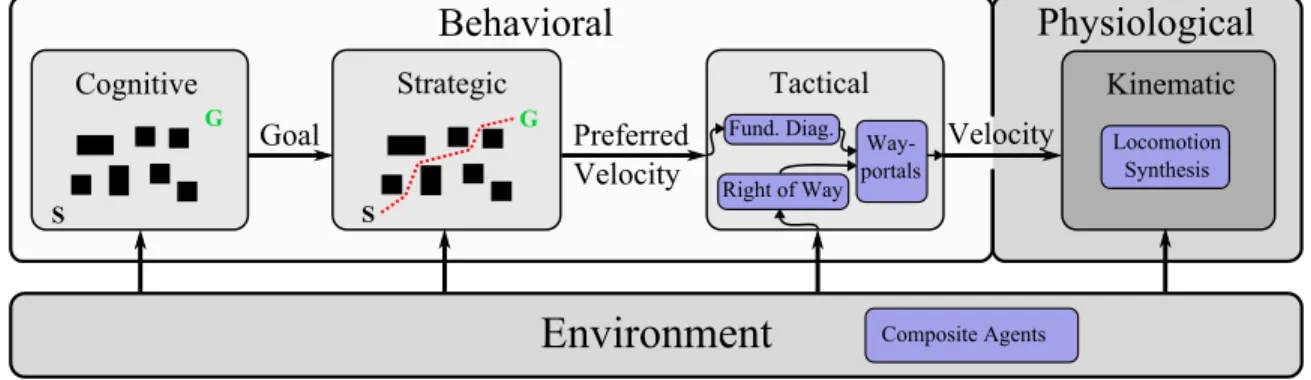
Cognitive
S
G
Strategic
S
G
Tactical
Fund. Diag. Right of Way
Way-portals
Kinematic
Locomotion Synthesis
Composite Agents
Behavioral
Physiological
Goal Preferred
Velocity
Velocity
Environment
Figure 1.11: The main contributions of this dissertation are shown highlighted blue. The basic pedestrian simulation model is extended in the following ways: Composite Agents introducesproxy agentsinto the environment to generate implicit asymmetric behaviors. Right of Way modifies the definition of velocity obstacles to introduce explicit asymmetric behaviors. Wayportals modify the optimization function which accounts for greater semantic knowledge of the environment to improve space utilization and flow. The “Fund. Diag.” work acts as a filter to the optimization function to reproduce human density-dependent behavior. Finally, the locomotion synthesis simulates the human body in creating locomotion consistent with the simulated agent trajectories.
1.3 Thesis Statement
Our thesis statement is as follows:
Velocity-obstacle-based models, informed by observed human behavior and biomechanical principles, can serve as an accurate and efficient basis for efficient pedestrian simulation.
1.4 Main Results
The modern velocity-obstacle formulations were originally intended for robots (Fiorini and
Shiller, 1998; Van den Berg et al., 2008; van den Berg et al., 2009). We will show through the
remainder of this work that the original formulation produces behaviors that are, in some important
ways, inconsistent with observable human behaviors. The main result of this dissertation is a new
pedestrian model, the Pedestrian Velocity Obstacle (PedVO) based on reciprocal velocity obstacles,
which exploits the computational benefits of efficient velocity-space computations and generates
agent behaviors which are at least as accurate as other pedestrian models. With respect to the
theoretical ideal pedestrian simulator, we maintain the high efficiency of the underlying velocity
obstacle formulation, but improve the accuracy of the behavior and give evidence that suggests the
to the pedestrian dynamics literature and compare the results produced with a fixed set of population
parameters against multiple pedestrian datasets.
The specific contributions are summarized in Figure 1.11. We have modified the basic pedestrian
simulator shown in Figure 1.2 to illustrate how our novel contributions fit into pedestrian simulators
and how they relate. To summarize:
• Composite Agents (Chapter 3) creates asymmetric inter-agent behaviors akin to those observed
in pedestriansimplicitlyby introducing new entities into the environment:proxy agents.
• Right of Way (Chapter 4) provides a mechanism forexplicit, asymmetric inter-agent rela-tionships by redefining how the velocity obstacles are defined to redirect and reapportion the
collision avoidance effort.
• Wayportals (Chapter 5) improve the agents’ use of space by improving the agent’s semantic
knowledge of its environment and optimizing its velocity with respect to a larger space of
viable velocities producing more efficient, human-like flow.
• The “Fund. Diag.” filter (Chapter 6) pre-processes the preferred velocity prior to optimization.
The component acts like a filter, transforming the preferred velocity into a new preferred
velocity which reproduces a ubiquitous human behavior: density-dependent speed.
• Locomotion synthesis (Chapter 7) simulates the pedestrians at a biomechanical level. Given
the trajectory produced by the tactical model, it synthesizes walking motion consistent with
the instantaneous velocities by continuously transforming a sample motion, preserving the
character of the sample motion while creating motion physically consistent with the center of
mass’s trajectory.
• (Not pictured) Finally, we apply our techniques to simulating a complex and challenging
real-world scenario: the performance of the Tawaf (Chapter 8).
Taken together, these elements form the Pedestrian Velocity Obstacle model. In more detail, the
contributions are:
Asymmetric RelationshipsThe ORCA algorithm assumes a very particular basis for inter-agent relationships: perfect reciprocity. The underlying philosophy of ORCA is that there is a minimum
inevitable collision. The burden of changing the relative velocity isevenlydivided between the two agents in such a way as to guarantee no collision within a specified time window. As a protocol
for multiple identical robots to traverse a shared space, it is quite suitable; the acceleration, and the
concomitant torque and energy cost, is evenly shared between the robots. However, as a model of
pedestrian interactions, it can be too limiting.
Human interactions span a much larger space than is covered by perfect reciprocity. As two
pedestrians move through a shared space, multiple factors can contribute to how they respond to
each other. Issues beyond mere physical collision come into play. For example, if one pedestrian
seems aggressive, the other pedestrian may give him more clearance. Alternatively, social norms can
play a deciding role; it is considered “normal” to allow people exiting a subway train access to the
doorway before those waiting to board the train enter (a similar behavior happens at elevators). In
these cases, the pedestrians are taking actions which exceed the minimum effort to avoid physical
collision. To successfully model humans in such circumstances, we must be able to model these types
of relationships. We provide two complementary techniques for modeling asymmetric relationships:
Composite AgentsandRight of Way.
Composite Agents exploit the fundamental behavior of ORCA – collision avoidance – to model
abstract factors which affect how agents relate to each other. Abstract factors, such as aggression,
priority, and authority are modeled as physical entities calledproxy agents, orproxies, for short. Proxies are connected to agents to impart additional characteristics. These additional characteristics
are implicit in the proxy. Other agents merely see the proxy as another agent to avoid. Depending
on the state of the proxy, and how that proxy’s state updates, then the act of avoiding the proxy
is analogous to the response to an agent with the corresponding characteristic. For example, an
aggressive pedestrian is better able to push through a crowd than a passive pedestrian. This progress
can be attributed to multiple sources including, but not limited to, other pedestrians recognizing the
aggression and actively seeking to avoid it, or because the aggressive pedestrian physically pushes
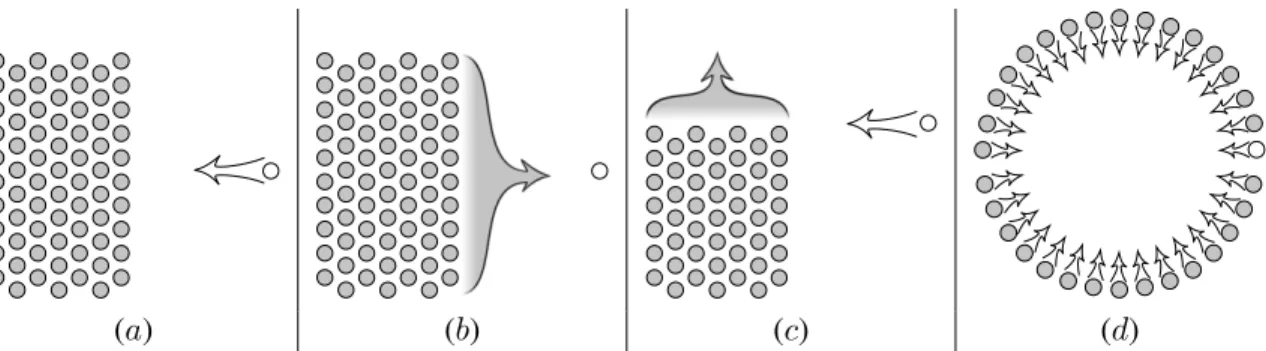
other pedestrians out of the way. Anaggressionproxy models the effect of this aggressive tendency. It lies in front of its composite agent and causes other agents to clear that region, creating a void that
the composite agent can comfortably move into. Thus, the composite agent with the aggression proxy
We also show that this same principle can be applied to other, complex abstract interactions. The
priorityproxy allows us to recreate the aforementioned subway train scenario. Agents with priority (those disembarking from the subway) use priority proxies to reserve passage through the doorway,
forcing the entering agents to wait. However, if there is room for the agents to enter around the proxy,
then agents can exit and enter the train at the same time – just as in real life.
Theauthorityproxy is used to model the ability of a line of policemen to control are large mob. A small group of police can only control a much larger crowd because the crowd fears and/or respects
the police authority. It is this authority that allows them to maintain the integrity of their lines and
to hold their relationships against a press of people. From a purely physical perspective, the larger
mob would have no difficulty overpowering the police. The authority proxy creates a bridge between
adjacent police, effectively creating a dynamic wall that individual pedestrians are loathe to break.
We show that such a system can be designed simply – agents in the simulation do not need to
be explicitly aware of the presence of proxy agents. Furthermore, the proxies themselves typically
employ inexpensive update functions. So, the computational cost of adding proxy agents is the
increased agent count in neighbor calculation and the cost of updating the proxies (frequently cheaper
than updating the “base” simulation agents).
Right of Way is a complementary technique. It is based on the “right of way” concept from
vehicular traffic. Right of way is the set of rules which determines when one vehicle must yield
to another. However, unlike Composite Agents, Right of Way changes the underlying collision
avoidance algorithm. This is the first modification to ORCA which will eventually transform it into
PedVO.
We introduce a new agent property calledpriorityand the relative priority between two agents determines which agent, if any, has right of way. Right of way is used to modify the formulation of
the velocity obstacle constraints. As the right of way of one agent over another increases, the other
agent bears an increasing burden to avoid collision. More particularly, the collision it is obliged to
avoid is based on the assumption that the agent with right of way is going to more directly pursue its
preferred velocity. Thus, as right of way improves to 100%, the agent with right of way will be fully
able to pursue its preferred velocity, relying on its neighbors to avoid it. The inclusion of right of
collision avoidance algorithm, adding right of way does not appreciably increase the computational
cost of the pedestrian model.
The principle of right of way is not unique to velocity obstacles. So, we show how the same idea
can be applied to two other pedestrian models. We illustrate the efficacy of the model in a set of four
abstract experiments and then show its practical application in pedestrian dynamics. We show that
the introduction of right of way alleviates common simulation artifacts which leads to artificially low
flow rates through bottlenecks. By introducing priority to agents near a portal, the agents are able to
more realistically flow through the bottleneck. We also applied right of way in the simulation of the
Tawaf. Pilgrims queue up along the south east face of the Kaabah, the large, cubical structure in the
center of the mosque, to wait their chance to kiss the Black Stone on the eastern corner. Empirical
observations of the Tawaf show that this queue is able to preserve is integrity even at incredibly high
densities. However, in simulation, the flow of the remaining crowd significantly disrupts the queue.
The inclusion of right of way corrects this problem.
If one agent has right of way over another agent, then the burden for avoiding collision is no
longer distributed evenly. The agent with lower priority must yield to the agent with right of way.
Similarly, it must yield so that the agent with right of way is better able to achieve its current goal.
This technique enables an agent to push through a crowd, or hold its place while a crowd moves
around them. It can be combined with Composite Agents to make the proxies more effective.
Wayportalsencode additional, beneficial domain knowledge, communicated from the strategic to the tactical layer. A pedestrian model’s role in crowd simulation is to transform a “preferred
velocity” into a feasible velocity (although they may be one and the same if the preferred velocity
is already “safe”). The preferred velocity represents the velocity that each agent would take in
the absence of dynamic obstacles. Typically, this is the result of global planning algorithms that
analyze the full environment, finding a path through arbitrarily complex static obstacles. At any
given instance in the simulation, the agent computes its preferred velocity towards an intermediate
goal. This is the most common paradigm for multi-agent navigation.
However, this practice can easily lead to undesirable and implausible behaviors. When multiple
agents all attempt to pass through a portal (e.g., a door way, or intersection of hallways), they can
end up fighting each other to pass through a particular point – the intermediate goal derived from
happen to share a common intermediate goalpoint; this is a very common occurrence. The agents have no semantic knowledge of the space around the goal point. The agents only understand that
they need to reach the given goal point. So, the agents vie for an incredibly limited resource – the
single point – unable to recognize that the region immediately surrounding the single point is equally
acceptable as an intermediate goal.
Wayportals are a novel, formal representation of this semantic knowledge. We change the
intermediate goals from points to line segments, which correspond to the width of the portal that
needs to be crossed. The line segment represents an entire space of viable intermediate goals, all
equally viable with respect to reaching the agent’s ultimate goal. A change in the goal representation
implies a change in preferred velocity representation. The original preferred velocity was the single
velocity toward the original goal point, at the preferred speed. The new preferred velocity is an arc of
velocities – all velocities of the preferred speed which span the wayportal line segment.
This new preferred velocity formulation requires a new optimization function – this is the second
change to the underlying ORCA algorithm. It is no longer sufficient to test a single preferred
velocity against the velocity obstacles. An entire space of velocities must be efficiently tested and,
if necessary, a best alternative must be found. We provide an efficient convex approximation of
this optimization problem which increases the per-agent cost by only 0.7µsper time step (a 10% increase in computational cost). By increasing the space of preferred velocity, each agent has greater
flexibility in responding to local, dynamic obstacles in order to achieve its long-term goal. We show
that the introduction of wayportals improves the flow of agents through a space, by reducing artificial
contention for doorways and giving the agents greater knowledge of its environment.
Adherence to the Fundamental Diagram introduces a previously missing human behavior. Traffic engineers have long observed a particular behavior in crowds of pedestrians; as crowds
get denser, pedestrians slow down (Weidmann, 1993). This phenomenon has been named the
“fundamental diagram.” Through many experiments, this phenomenon has been observed in all types
of circumstances and across various populations. While the origins of this are not fully understood,
it is clear that it includes aspects of the biomechanical walking mechanism and psychological and
cultural elements. However, it can easily be shown, that agents which use ORCA as their underlying
navigation model do not exhibit this distinctly human behavior. The formulation of ORCA is only
not in collision, then ORCA requires no change to agent velocity, even if the two agents are adjacent
and moving at arbitrarily high speeds. Agents which fail to exhibit behavior consistent with the
so-called fundamental diagram, produce misleading and skewed results. In dense scenarios, agents
will flow at far too high a rate, leading to unrealistically low evacuation times. To produce credible
pedestrian simulations, the agents must respect the fundamental diagram.
We have multiple contributions in this domain. First, we show that many pedestrian models,
including ORCA, fail to produce the fundamental diagram. This is a common artifact of collision
avoidance algorithms. Second, we present a local behavioral model, based on a novel hypothesis
of the origins of the fundamental diagram. Finally, we show how the application of this new model
introduces a similar density-dependent behavior as that observed in pedestrians.
In our initial analysis, we reproduced several experimental pedestrian data sets for two models:
ORCA and a representative social force model. For each pedestrian data set, we computed the
observed fundamental diagram and compared it with the behavior exhibited in the corresponding
simulation. Across all data sets, the simulated agents exhibited largely density-insensitive behaviors.
To introduce this sensitivity, we revisited the fundamental diagram. We base our model on
a hypothesis of the origins of the behavior: there is a relationship between the perceived space
available to a pedestrian and the speed the pedestrian will comfortably travel. Our model incorporates
well-understood biomechanical principles and simple insights into psychology to modify the agent
behavior. The biomechanical principles relate walking speed with stride length and how they both
relate to energy efficiency. For a given stride length, there is an energy efficient speed to travel and
the converse is also true, for a given walking speed, there is a natural stride length for maximum
energy efficiency. In other words, as the stride length decreases, the speed naturally drops. The
second component is psychological. It is a simple model on how much space a pedestrianfeelsis necessary to take a stride of a particular length. We combine these two elements into a function
that maps available space to comfortable speed, and then modify the preferred velocity to limit its
magnitude to the comfortable speed before it is provided to the collision avoidance algorithm.
We show that the inclusion of this model significantly changes the behavior of the agents. We
were able to meaningfully reproduce the density-sensitive behavior of the pedestrians in all of the
experimental data sets. Furthermore, in one case, where we had the same experiment conducted with
directly mapped to the differences in populations. Finally, we showed that the model improved the
smoothness of the trajectories of the social force model.
Locomotion Synthesis for Interactive Crowdsgenerates walking motion for three-dimensional crowd visualization using human-like models. We model pedestrians as simple disks. The simulation
produces trajectories for these simple disks. It is certainly reasonable and practical to qualitatively
assess the simulation results by watching the movement of disks on the plane. Such visualizations
can be revealing. However, we, as humans, are accustomed to observing and analyzing humans.
Being able to visualize the simulation results with human-like visual representations can provide
additional insight and understanding. Furthermore, there are applications of crowd simulation, such
as virtual reality (VR), games, and entertainment, in which human representations are necessary.
We propose a lightweight, efficient method for generating walking motion for human simulacra
following the crowd trajectories. Our method is data driven. Given a single sample of walking
motion, it smoothly transforms the motion to construct an on-the-fly motion sequence which is true
to the agent’s trajectory while maintaining plausible contact with the ground.
The input motion is transformed according to biomechanical principles underlying the human
walking gait. The dominant properties of a gait are the large-scale, low-frequency phenomena (e.g.,
stride length, stride frequency, the pelvis rising and lowering, etc.) How these properties change with
respect to walking speed has been extensively studied (Inman et al., 1981). Based on these studies,
we produce gait functions – functions which approximate the continuous changes to these properties
with respect to speed and then, at run time, transform the motion so that it exhibits the appropriate
properties at that speed. By transforming the data, we preserve all of the unique, high-frequency
signal and asymmetries in the input motion. This is critical to preserving the particularly human
character of motion capture data. We also perform additional analysis to show that the default gait
functions are physically correct in that they preserve important dynamical properties.
Finally, we show that the algorithm is well-suited to interactive applications; we are able to
update the motion of 800 agents on commodity hardware in less than 4 ms total – an average,
per-agent cost of 5µs.
Modeling the Tawaf In order to test the PedVO model, we sought to model a challenging, complex scenario: the performance of the Tawaf. The Tawaf is one aspect of the Hajj, a pillar of
relatively small space. This scenario involves exceptionally high density, a heterogeneous population,
and spatially and temporally varied behaviors. We describe the system responsible for the simulation
of the Tawaf and provide the simulation results. We show, that, in many interesting ways, the
simulated results correlated well with the limited empirical evidence of actual pilgrims.
1.4.1 Organization
The balance of this dissertation is organized in the following manner. In Chapter 2 we describe
the properties and parameters of a crowd simulator, detailing many different pedestrian models.
Chapter 3 introduces the idea of asymmetric agent relationships and presents the details of Composite
Agents. Chapter 4 presents the Right of Way formulation and discusses how it can be combined
with Composite Agents. We present Wayportals in Chapter 5. The fundamental diagram is discussed
in Chapter 6. Chapter 7 contains the interactive locomotion model and provides illustrations of the
model in action. In Chapter 8, we put the principles to work in a challenging application domain: the
performance of the Tawaf. Finally, we summarize this work and its limitations and discuss directions
CHAPTER 2: CROWD SIMULATION
In Chapter 1, we showed that a full pedestrian simulation system is comprised of many
compo-nents. In this chapter, we primarily focus on the state of the art of a single component – pedestrian
models – because PedVO is, fundamentally, a pedestrian model. We defer the detailed discussion of
the other components of a crowd simulation system to later chapters as appropriate (the cognitive
module is discussed in Chapter 8, global planners in Chapter 5, and locomotion synthesis in
Chap-ter 7). We also introduce the basic notation that we will use throughout this dissertation. In addition
to the pedestrian models, we also provide a brief survey of commercial crowd simulation systems
and the current state of data-driven validation. Finally, having examined many different pedestrian
and motion planning models, we discuss the answer to the question: “Why base a pedestrian model
on velocity obstacles?”
2.1 Commercial Crowd Simulation
Before we delve into the various, low-level pedestrian models, it is worth making note of
a number of commercial crowd simulation packages. Even as researchers seek to improve the
underlying pedestrian models, companies are applying those techniques in robust systems to address
real-world crowd problems to the best of the model’s ability.
The entertainment industry has a vested interest in crowd simulation. Visual effects have
extended the ability for movie makers to tell increasingly elaborate stories. Whole worlds have
been created from nothing. As such, there has been intense development of crowd simulation and
visualization tools for the purpose of film making. The primary focus of these tools is, first, to be
directable – the artists need to control the timing and outcome of the simulation to tell a story – and,
second, to ultimately create photo-realistic visualizations of the members of the crowd (which may
consist of arbitrary entities ranging from robots to centaurs). One such tool is Massive, created in