rsos.royalsocietypublishing.org
Research
Cite this article:Browne MG, Franz JR 2017
Does dynamic stability govern propulsive force generation in human walking?R. Soc. open sci.
4: 171673.
http://dx.doi.org/10.1098/rsos.171673
Received: 19 October 2017 Accepted: 26 October 2017
Subject Category:
Biology (whole organism)
Subject Areas:
biomechanics
Keywords:
variability, push-off, balance, walking speed, biofeedback, ageing
Author for correspondence:
Jason R. Franz
e-mail:[email protected]
Electronic supplementary material is available online at https://dx.doi.org/10.6084/m9. figshare.c.3933139.
Does dynamic stability
govern propulsive force
generation in human
walking?
Michael G. Browne and Jason R. Franz
Joint Department of Biomedical Engineering, University of North Carolina at Chapel Hill and North Carolina State University, Chapel Hill, NC, USA
JRF,0000-0001-9523-9708
Before succumbing to slower speeds, older adults may walk with a diminished push-off to prioritize stability over mobility. However, direct evidence for trade-offs between push-off intensity and balance control in human walking, independent of changes in speed, has remained elusive. As a critical first step, we conducted two experiments to investigate: (i) the independent effects of walking speed and propulsive force (FP) generation on dynamic stability in young adults, and
(ii) the extent to which young adults prioritize dynamic stability in selecting their preferred combination of walking speed andFPgeneration. Subjects walked on a force-measuring
treadmill across a range of speeds as well as at constant speeds while modulating their FP according to a visual
biofeedback paradigm based on real-time force measurements. In contrast to improvements when walking slower, walking with a diminished push-off worsened dynamic stability by up to 32%. Rather, we find that young adults adopt anFPat their
preferred walking speed that maximizes dynamic stability. One implication of these findings is that the onset of a diminished push-off in old age may independently contribute to poorer balance control and precipitate slower walking speeds.
1. Introduction
Older adults are at a high risk of falls, and most of these falls occur during locomotor activities such as walking [1–4]. Older adults may thus opt to walk slower to improve their resilience to unexpected balance challenges and mitigate their risk of falls. Indeed, preferred walking speed decreases on average by 16% per decade after age 60 [5,6]. However, prior to eliciting slower preferred speeds, advanced age is associated with a precipitous reduction in propulsive forces (i.e. the anterior component of the ground reaction force vector, FP) exerted during the
push-off phase of walking [7]. This biomechanical change is most often
2
rsos
.ro
yalsociet
ypublishing
.or
g
R.
Soc
.open
sc
i.
4
:1
716
73
...
ascribed to sarcopenia and leg muscle weakness (though see Franz [8]), and may itself precipitate slower speeds; indeed, humans regulate walking speed by modulating propulsive forces during push-off [8,9]. As an alternative, or perhaps complementary explanation, Winteret al. [10] originally proposed that many of the hallmark biomechanical features of elderly gait, including reductions in propulsive force generation during push-off, reflect the adoption of a safer, more stable pattern of movement [10]. Accordingly, older adults may walk with smaller propulsive forces, even prior to walking slower, to prioritize stability over mobility. However, direct evidence for trade-offs between propulsive force generation and walking balance control, independent of changes in walking speed, has remained elusive.
There is no consensus in the literature as to which metrics best describe the integrity of walking balance control. However, local dynamic stability quantified via maximum divergence exponents can provide unique insight, distinguishes between older and young adults and correlates with age-related falls risk [11–13]. Here, we use balance as a general term describing the resilience to falling and operationally define dynamic stability as a specific metric of balance. The cumulative insights from Dingwell & Marin [12] and Kang & Dingwell [13] suggest that by walking slower, both young and older adults can improve their local dynamic stability [12,13]. Moreover, their subjects did so while successfully accommodating an increase in kinematic variability—another frequently employed metric of walking balance control that is known to increase with slower speeds [14]. These results are not unequivocal, however. Indeed, some studies suggest that speed has no effect on dynamic stability [15] or that results may vary depending on calculation method [16]. Though, when faced with cognitive or physical balance challenges, older adults do prefer to reduce their walking speed [17]. Thus, despite some conflicting reports, we posit that it is reasonably well conceived that older adults may ultimately walk slower to mitigate their risk of falls. Ultimately, there may be a complex interdependence between dynamic stability and simultaneous age-associated biomechanical changes also thought to precipitate slower speeds.
Also preceding and perhaps contributing to slower walking speeds in old age, the single most common biomechanical change in elderly gait is up to 20% reduction in propulsive forces exerted during push-off compared to young adults walking at the same speed [7]. Underlying these smaller propulsive forces is an 11–35% reduction in mechanical power generated by the propulsive plantarflexor (i.e. ankle extensor) muscles [18,19]. Appropriate ankle power generation is critical in walking, at once contributing to leg swing and centre of mass (CoM) acceleration [20]. Moreover, we consider FP and ankle power
generation inextricably linked; peak ankle power is a significant contributor to peakFP[21] and walking
with smaller FP systematically decreases peak ankle power [22]. Although commonly implicated,
sarcopenia and muscle weakness alone cannot explain these biomechanical changes associated with ageing; after accounting for declines in muscle-force generating capacity, between 48 and 75% of the variance in ankle power and thus propulsive force generation is left unexplained [23]. In addition, the appropriate modulation of ankle power has also been shown to be important for stabilizing computational models of walking, thereby alluding to a potentially important relation between push-off intensity and balance control [24].
Do older adults change their gait biomechanics, prior to walking slower, to mitigate the risk of falls? In their seminal paper, Winteret al. [10] alluded to the presence of trade-offs between propulsive force generation during push-off and walking balance control [10]. Specifically, those authors suggested that ‘a normal push-off. . .is a thrust from the ankle, which acts upward and forward, and is destabilizing. The elderly. . . appear to have recognized this fact and are reducing that potential for instability.’ The presence of this trade-off in human locomotion has yet to be experimentally validated, but could manifest in two ways. First, and most consistent with the context provided by Winteret al. [10], walking at a given speed with smaller propulsive forces could improve dynamic stability. Second, the freely selected magnitude of propulsive force generation while walking at a preferred speed could maximize dynamic stability. As a critical first step, we sought to investigate the presence of this trade-off in young adults, and thus, the role of dynamic stability in governing propulsive force generation during walking in the absence of age-associated gait changes.
3
rsos
.ro
yalsociet
ypublishing
.or
g
R.
Soc
.open
sc
i.
4
:1
716
73
...
also analysed step kinematics and metrics of gait variability in each test of our hypotheses, given their complement to measures of dynamic stability within the broader context of walking balance control.
2. Methods
2.1. Subjects
We present data from healthy young adult subjects that participated in two different but complementary experiments which we refer to as experiment 1 and experiment 2, both outlined in detailed below; 12 subjects participated in experiment 1 (mean±s.d., age: 26.2±3.1 years, height: 1.75±0.09 m, mass: 71.6±8.8 kg, six males/six females) and 10 subjects participated in experiment 2 (age: 24.8±5.4 years, height: 1.78±0.08 m, mass: 73.2±7.6 kg, five males, five females). All subjects provided written, informed consent according to the University of North Carolina Institutional Review Board.
2.2. Visual biofeedback paradigm
Experiment 1 and experiment 2 both used a novel visual biofeedback paradigm based on real-time force measurements from a dual-belt force measuring treadmill (Bertec, Corp., Columbus, OH, USA) (figure 1c). Specifically, for trials involving this biofeedback paradigm, a custom Matlab (Mathworks, Natick, MA, USA) script continuously computed the average bilateral peak horizontal (i.e. propulsive,
FP) force during push-off from each set of four consecutive steps and projected a visual representation
of those values as dots in real time to a screen positioned in front of the treadmill (figure 1c). To ensure the visual feedback was as intuitive as possible, we described to each subject the timing of push-off and explained thatFPrepresented the force on the ground acting to accelerate their body forward with
each step. Subjects were then encouraged to match their instantaneous FP to target values displayed
as horizontal lines and prescribed according to the experimental protocols outlined below. For all trials involving visual biofeedback, we normalized the scaling of each subject’s feedback data on the projected display so all target values were evenly distributed over the ordinate range.
2.3. Experiment 1 protocol
We reanalysed data available from a previously published protocol outlined in detail elsewhere [22]. To summarize briefly, subjects first walked normally on the force-sensing treadmill for 1 min each at five different speeds (0.9, 1.0, 1.1, 1.2 and 1.3 m s−1), in randomized order. We extracted each subject’s bilateral
peakFPfrom each walking speed, which were subsequently used as target values for visual biofeedback
trials. Subjects then completed a 5 min exploratory walking session in which they became familiar with the biofeedback environment. Finally, subjects walked at 1.3 m s−1for 1 min each while matching their
instantaneousFPto the mean values extracted from all five walking speeds.
2.4. Experiment 2 protocol
A photo cell timing system first assessed subjects’ preferred overground walking speed from the average of three times taken to traverse the middle 2 m of a 10 m walkway when asked to walk at a normal, comfortable speed (1.27±0.14 m s−1) (Brower Timing, Draper, UT, USA). Subjects then walked at their
preferred overground speed normally and while matching a randomized series of biofeedback targets on the force-sensing treadmill. Specifically, subjects walked while matching their instantaneous FP to
values representing the mean value and±10% and±20% of the mean value extracted from the normal walking trial.
2.5. Data collection and analysis
4
rsos
.ro
yalsociet
ypublishing
.or
g
R.
Soc
.open
sc
i.
4
:1
716
73
...
real-time propulsive force analysis target real-time values
pref +10% +20%
–10%
–20%
(b) experiment 2
14 16 18 20 22 24 26
main effect, p< 0.001
walking speed (m s–1)
0.9 1.0 1.1 1.2 1.3
peak propulsive force (% body weight)
12 14 16 18 20
1.3
(a) experiment 1
22
main effect, ps < 0.001
(c) design
normal walking biofeedback (1.3 m s–1)
peak propulsive force (% body weight)
*
*
*
* * normal walking biofeedback (preferred speed)
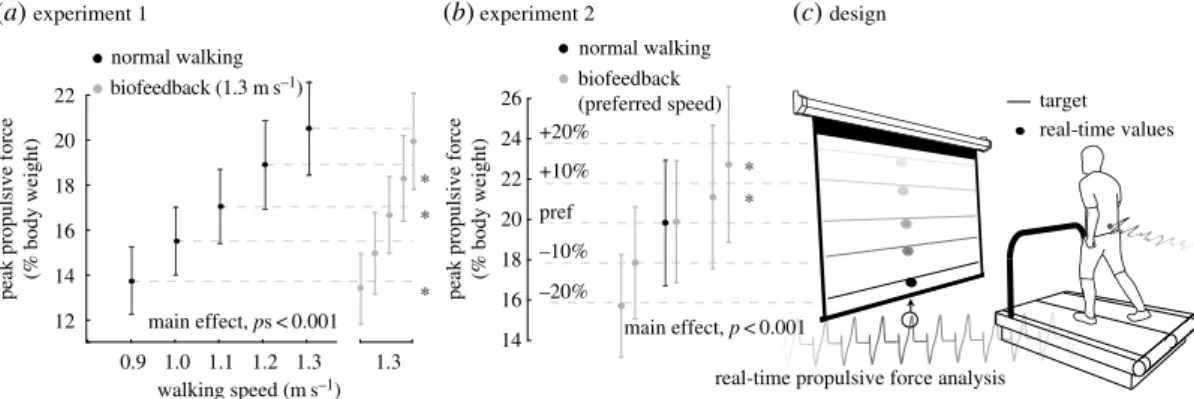
Figure 1.Group mean (standard deviation) peak propulsive force values (a) when walking across a range of speeds and at 1.3 m s−1with
biofeedback of propulsive force targets extracted from slower speeds and (b) walking at preferred speed with propulsive forces±10% and±20% larger than preferred. (c) Experimental design using visual biofeedback of real-time propulsive force values calculated from a dual-belt, force-measuring treadmill to decouple the effects of walking speed and propulsive force generation on metrics of dynamic balance control. Asterisks represent significant (p<0.05) difference from prescribed values.
positions relative to the sacral marker [25], which we then used to calculate time series of step widths and lengths as follows. We calculated step width using the average mediolateral distance between heel marker positions during midstance prior to heel rise (i.e. 12–25% of the gait cycle) across successive steps. Accordingly, we derived step width variability as the standard deviation of the step width time series. We calculated step length using the relative anterior–posterior positions of successive heel markers at 20% of the gait cycle plus the treadmill belt translation over each step. Step length variability was the corresponding standard deviation of those step length time series.
We used the filtered, three-dimensional sacrum trajectory components as a surrogate for subjects’ CoM, from which we calculated two kinematically derived metrics of walking balance control— variability and local dynamic stability. Time series of sacrum position can exhibit non-stationarity arising from subjects’ average position changing over the course of a walking trial. This non-stationarity can influence metrics of movement variability but may also contain relevant information about walking balance that we chose not to disregard. Thus, we calculated CoM variability in the anterior–posterior, mediolateral and vertical directions using the standard deviation of both: (i) the sacrum position time series, and (ii) the sacrum velocity time series, the latter being less affected by changes in average CoM position.
Finally, we used time series of sacrum position and velocity components to calculate maximum divergence (Lyapunov) exponents. These exponents, which quantify the sensitivity of CoM motion to small, naturally occurring perturbations arising from internal (e.g. neuromuscular noise) and external (e.g. biofeedback) factors, served as our metric of local dynamic stability. To do this, we first reconstructed state spaces,S(t), from the original data in the anterior–posterior (x), mediolateral (y) and vertical (z) directions and their time-delayed copies according to the following equations
qanterior–posterior(t)=[x,x˙], (2.1)
qmediolateral(t)=[y,y˙], (2.2)
qvertical(t)=[z,z˙], (2.3)
q3D(t)=[x,y,z,x˙,y˙,˙z] (2.4)
and S(t)=[q(t),q(t+τ),q(t+2τ),q(t+3τ),q(t+4τ),q(t+5τ)], (2.5)
where ‘3D’ in equation (2.4) refers to a composite metric assembled from the anterior–posterior, mediolateral and vertical components. For each of these four state space reconstructions for each subject, we calculated the average maximum exponential rates of divergence of pairs of initially neighbouring trajectories using procedures outlined in detail previously [13,26,27]. Consistent with our prior work [28], we used one-quarter of subjects’ average stride time as the embedding delay,τ, for all conditions [29], and determined the corresponding embedding dimension (dE=5) using a 10% criterion in a false
nearest neighbours analysis [30]. After time normalizing the divergence curves to account for differences in stride period, we calculated each subject’s short-term (λs, 0–1 stride) divergence exponents, where
5
rsos
.ro
yalsociet
ypublishing
.or
g
R.
Soc
.open
sc
i.
4
:1
716
73
...
also analyse long-term divergence exponents (e.g. 1–10 strides), as we and others have found these to be largely insensitive to between-group or between-condition effects during treadmill walking [13,28]. Indeed, walking on a treadmill at a constant speed requires that subjects’ movements remain loosely bounded over the course of many strides. Note that throughout the Results and Discussion, better dynamic stability refers to smaller values ofλs.
2.6. Statistical analysis
The paired-sample t-tests performed on subjects’ average peak propulsive force first determined the success of subjects reachingFPbiofeedback targets. We then performed separate statistical analyses on
the following outcome measures collected in experiments 1 and 2: step length and width, step length and width variabilities, and the three-dimensional variabilities and short-term local divergence exponents (i.e. dynamic stability) derived from sacrum marker trajectories. For experiment 1, a two-way repeated-measures analysis of variance (ANOVA) tested for significant main effects of and interactions between condition (i.e. normal walking versus biofeedback) and speed-matched targets (i.e. 0.9–1.3 m s−1). When a significant interaction was found, Fisher’s LSD post hoccomparisons elucidated the speed-matched targets at which differences emerged. For experiment 2, paired-samples t-tests tested for effects of biofeedback alone on each outcome measure by comparing normal walking to walking with the biofeedback target representingFPduring normal walking. Then, a one-way repeated-measures ANOVA
tested for a significant main effect of FP (i.e. 0, ±10%, ±20%) on each outcome measure. When a
significant main effect was found, planned Fisher’s LSDpost hoccomparisons were focused to elucidate significant differences from normal walking (with and without biofeedback).
3. Results
Subjects successfully and systematically modulated their FP in accordance with all prescribed
biofeedback targets presented in both experiments 1 and 2 (figure 1a,b). In addition, biofeedback itself (i.e. normal walking versus walking with targets representing normal walking) had only small discernible effects on our outcome measures;post hoccomparisons revealed that the use of biofeedback itself significantly increased only mediolateral sacrum position variability in both experiments and anterior–posterior sacrum position variability only in experiment 2 (p<0.02) (figure 4).
3.1. Experiment 1: the independent effects of walking speed and propulsive force
Walking slower and walking with smallerFPelicited very different and direction-dependent effects on
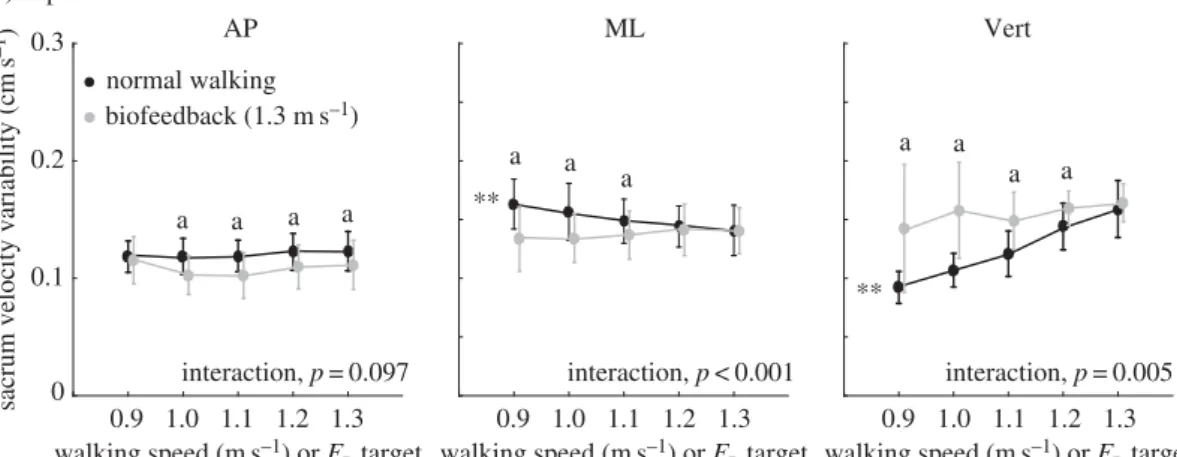
short-term local divergence exponents and gait variability. Walking slower decreased local divergence exponents by an average of up to 8% in the mediolateral direction (p=0.005) and 21% in the vertical direction (p<0.001) across the range of speeds tested (figure 2a). This improved stability was accompanied by significant increases in mediolateral sacrum variability (position: p<0.001, velocity:
p<0.001) (figures3aand4a) yet significant decreases in vertical sacrum variability (velocity:p<0.001) (figure 4a). Finally, walking slower had no significant effect on step width or step width variability, but did elicit progressively shorter and more variable step lengths (step length:p<0.001; step length variability: p<0.001) (table 1). In contrast with walking slower, and despite exerting identical FP
during push-off, walking at 1.3 m s−1 while independently reducing FP using biofeedback elicited
significant deficits in dynamic stability. Specifically, walking with smallerFPincreased short-term local
divergence exponents by an average of up to 13, 32 and 12%, in the anterior–posterior, mediolateral and vertical directions, respectively, and up to 30% for the three-dimensional metric (figure 2a) (pairwise,
ps<0.023). Moreover, significant interactions revealed that these effects differed significantly from those due to walking slower (ps<0.003). These stability deficits were accompanied by a significant decrease in mediolateral sacrum variability (position: p<0.001), an effect that also differed significantly from walking slower (interaction, p<0.001) (figure 3a). Finally, similar to walking slower, walking with reduced FP also elicited progressively shorter and more variable step lengths (step length: p<0.001;
step length variability:p=0.006) (table 1).
3.2. Experiment 2: the preferred combination of walking speed and propulsive force
Deviating from the FP subjects exerted when walking normally at their preferred speed negatively
6
rsos
.ro
yalsociet
ypublishing
.or
g
R.
Soc
.open
sc
i.
4
:1
716
73
... 0 0.2 0.4 0.6 0.8 1.0 AP ML Vert 3Dshort-term exponent (
l
S
, 0 to 1 strides)
pref +10 +20 –10 –20 pref +10 +20 –10 –20 pref +10 +20 –10 –20 pref +10 +20 –10 –20 ( a
) experiment 1
(
b
) experiment 2
0 0.2 0.4 0.6 0.8 1.0 1.2 AP ML Vert 3D 0.9 1.0 1.1 1.2 1.3 0.9 1.0 1.1 1.2 1.3 0.9 1.0 1.1 1.2 1.3
short-term exponent (
l
S
, 0 to 1 strides)
0.9 1.0 1.1 1.2 1.3 b,c b b,c c b,c b b,c
** normal walking biofeedback (1.3 m
s –1) interaction, p = 0.003 a a a
** ** interaction,
p < 0.001 a a a ** ** interaction, p < 0.001 a a a a ** interaction, p < 0.001 a a a b,c c
normal walking biofeedback (preferred speed)
main effect, p = 0.015 main effect, p = 0.001 main effect, p = 0.002 main effect, p = 0.001
walking speed (m
s
–1) or
FP
target
walking speed (m
s
–1
) or
FP
target
walking speed (m
s
–1
) or
FP
target
walking speed (m
7
rsos
.ro
yalsociet
ypublishing
.or
g
R.
Soc
.open
sc
i.
4
:1
716
73
...
AP ML Vert
0 2 4 6 8
sacrum position variability (cm) interaction, p= 0.646 interaction, p= 0.127
0 2 4 6 8
sacrum position variability (cm)
AP ML Vert
main effect, p=0.737
0.9 1.0 1.1 1.2 1.3 0.9 1.0 1.1 1.2 1.3 0.9 1.0 1.1 1.2 1.3
pref +10 +20 –10
–20 –20 –10 pref +10 +20 –20 –10 pref +10 +20
(a) experiment 1
(b) experiment 2
main effect, p<0.001
b,c c
b,c c
main effect, p<0.001
c b,c
b,c
interaction, p< 0.001
**
** a
a a a
normal walking
biofeedback (1.3 m s–1)
normal walking
biofeedback (preferred speed)
walking speed (m s–1) or F
P target walking speed (m s–1) or FP target walking speed (m s–1) or FP target
FP target FP target FP target
Figure 3.Group mean (standard deviation) anterior–posterior (AP), mediolateral (ML) and vertical (Vert) sacrum position variability
for (a) systematic changes in walking speed and propulsive force targets extracted from slower speeds, and (b) walking at preferred speed with propulsive forces smaller or larger than preferred. Double asterisks represent significant (p<0.05) main effects of speed or propulsive force. ‘a’ Significant (p<0.05) pairwise difference at matched propulsive forces, ‘b’ significantly (p<0.05) different from normal walking with biofeedback and ‘c’ significantly (p<0.05) different from normal walking without biofeedback.
smaller than preferred FP increased short-term local divergence exponents in all directions. Here,
walking with 20% larger than preferredFPalso increased short-term local divergence exponents, by 8%
in the anterior–posterior direction (p=0.017) and by 14% for the three-dimensional metric (p=0.041). By contrast, all components of sacrum variability decreased monotonically with smallerFP across the
range of biofeedback targets presented (figures3band4b). Finally, like the short-term local divergence exponents, we identified a local minimum also in step width and step length variability at subjects’ preferred combination of walking speed andFP(table 1). For example, walking with 20% larger (smaller)
than preferredFPincreased step width by 20% (9%) and step length variability by 71% (26%) (pairwise,
ps<0.01).
4. Discussion
Humans modulate their walking speed using propulsive forces generated during push-off. Accordingly, slower preferred speeds in old age are accompanied and preceded by smaller peakFPduring push-off
compared to young adults, and both may represent an effort to mitigate instability and risk of falls. Indeed, Winteret al.[10] suggested in their seminal paper that older adults may reduce their push-off intensity prior to walking slower to alleviate the potential for instability [10]. However, although highly intuitive, direct evidence for trade-offs betweenFPgeneration and walking balance control, independent
8
rsos
.ro
yalsociet
ypublishing
.or
g
R.
Soc
.open
sc
i.
4
:1
716
73
...
0 0.1 0.2 0.3
sacrum velocity variability (cm
s
–1
)
FP target
pref +10 +20 –10
–20
FP target
pref +10 +20 –10
–20
FP target
pref +10 +20 –10
–20 0
0.1 0.2 0.3
0.9 1.0 1.1 1.2 1.3 0.9 1.0 1.1 1.2 1.3 0.9 1.0 1.1 1.2 1.3
sacrum velocity variability (cm
s
–1
)
main effect, p< 0.001
b
b,c c b
main effect, p= 0.002
b,c b,c
main effect, p< 0.001
b,c
b,c
interaction, p< 0.001
**
a a
a
interaction, p= 0.005
**
a a
a a
interaction, p= 0.097
a a a a
AP ML Vert
AP ML Vert
(a) experiment 1
(b) experiment 2
walking speed (m s–1) or F
P target
walking speed (m s–1) or F
P target walking speed (m s–1) or FP target
normal walking
biofeedback (1.3 m s–1)
normal walking
biofeedback (preferred speed)
Figure 4.Group mean (standard deviation) anterior–posterior (AP), mediolateral (ML) and vertical (Vert) sacrum velocity variability
for (a) systematic changes in walking speed and propulsive force targets extracted from slower speeds, and (b) walking at preferred speed with propulsive forces smaller or larger than preferred. Double asterisks represent significant (p<0.05) main effects of speed or propulsive force. ‘a’ Significant (p<0.05) pairwise difference at matched propulsive forces, ‘b’ significantly (p<0.05) different from normal walking with biofeedback and ‘c’ significantly (p<0.05) different from normal walking without biofeedback.
that walking slower and walking with smallerFPelicit very different effects on local dynamic stability,
at least in young adults. Although some prior studies differ in their conclusions [15], consistent with works of Dingwell & Marin [12] and that of Kang & Dingwell [13], we found here that walking slower improved dynamic stability despite increasing movement variability [12–14]. However, contrary to our first hypothesis, walking with smaller FP reduced dynamic stability compared to walking normally.
Rather, more consistent with our second hypothesis, our findings suggest that young adults adopt a push-off intensity at their preferred walking speed that maximizes dynamic stability. Cumulatively, and as we elaborate in more detail below, our findings allude to unfavourable consequences of reduced propulsive force generation on dynamic stability that may ultimately precipitate walking slower.
4.1. Independent effects of walking speed and
F
P
on dynamic balance control
Motivated most directly by the contextual premise of Winteret al. [10], we first hypothesized that walking slower or with smallerFPwould improve dynamic stability. More precisely, in this study, we found that
walking slower, but not with smallerFP, improved dynamic stability. Walking slower decreased
9
rsos
.ro
yalsociet
ypublishing
.or
g
R.
Soc
.open
sc
i.
4
:1
716
73
...
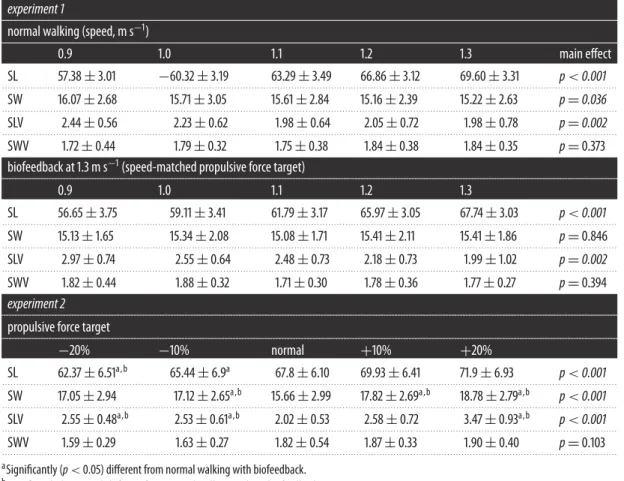
Table 1.Mean±s.d. step kinematics (centimetres). SL, step length; SW, step width; SLV, step length variability; SWV, step width
variability.
experiment 1
normal walking (speed, m s−1)
0.9 1.0 1.1 1.2 1.3 main effect
SL 57.38±3.01 −60.32±3.19 63.29±3.49 66.86±3.12 69.60±3.31 p<0.001
. . . .
SW 16.07±2.68 15.71±3.05 15.61±2.84 15.16±2.39 15.22±2.63 p=0.036
. . . .
SLV 2.44±0.56 2.23±0.62 1.98±0.64 2.05±0.72 1.98±0.78 p=0.002
. . . .
SWV 1.72±0.44 1.79±0.32 1.75±0.38 1.84±0.38 1.84±0.35 p=0.373
biofeedback at 1.3 m s−1(speed-matched propulsive force target)
. . . .
0.9 1.0 1.1 1.2 1.3
SL 56.65±3.75 59.11±3.41 61.79±3.17 65.97±3.05 67.74±3.03 p<0.001
. . . .
SW 15.13±1.65 15.34±2.08 15.08±1.71 15.41±2.11 15.41±1.86 p=0.846
. . . .
SLV 2.97±0.74 2.55±0.64 2.48±0.73 2.18±0.73 1.99±1.02 p=0.002
. . . .
SWV 1.82±0.44 1.88±0.32 1.71±0.30 1.78±0.36 1.77±0.27 p=0.394
experiment 2
. . . . propulsive force target
. . . .
−20% −10% normal +10% +20%
SL 62.37±6.51a,b 65.44±6.9a 67.8±6.10 69.93±6.41 71.9±6.93 p<0.001
. . . . SW 17.05±2.94 17.12±2.65a,b 15.66±2.99 17.82±2.69a,b 18.78±2.79a,b p<0.001 . . . .
SLV 2.55±0.48a,b 2.53±0.61a,b 2.02±0.53 2.58±0.72 3.47±0.93a,b p<0.001
. . . .
SWV 1.59±0.29 1.63±0.27 1.82±0.54 1.87±0.33 1.90±0.40 p=0.103
. . . .
aSignificantly (p<0.05) different from normal walking with biofeedback.
bSignificantly (p<0.05) different from normal walking without biofeedback.
and with walking slower, walking with smallerFP reduced dynamic stability by up to 32%, with the
largest effects in the mediolateral direction.
Metrics of kinematic variability, quantifying the magnitude of step-to-step adjustments in walking, provide an important complement to measures of dynamic stability within the broader context of walking balance control. Too little or too much variability has been implicated as a marker of walking balance deficits and, although findings differ by study, both correlate with a history of falls [36]. Consistent with some previous work [12,14], walking slower increased movement variability—here, that of step length and mediolateral sacrum kinematics. The most likely interpretation is that walking slower brings a reduced requirement for strict step-to-step kinematic control to maintain dynamic stability. Walking with reducedFP had comparable effects on two variability outcome measures. The
first, mediolateral sacrum position variability, also increased with the use of biofeedback alone (i.e. biofeedback of normalFP) and may reflect the subject’s global position on the treadmill more than
step-to-step adjustments associated with balance control. The second, step length variability, may be related to larger step-to-step adjustments in propulsive force as subjects attempted to regulate their values to match the targets from slower speeds. Indeed, propulsive forces generated during push-off may govern walking speed via changes in step length. However, biofeedback alone had no appreciable effect on step length variability.
4.2. The stability maximization hypothesis
The second way in which trade-offs between propulsive force generation during push-off and walking balance control could manifest, informing our second hypothesis and the design of experiment 2, was that young adults could prefer a combination of walking speed and FP generation that maximizes
dynamic stability. Our results are consistent with this hypothesis; we found evidence of a local minimum in local divergence exponents at theFPsubjects normally exerted when walking at their preferred speed.
10
rsos
.ro
yalsociet
ypublishing
.or
g
R.
Soc
.open
sc
i.
4
:1
716
73
...
highly consistent with those in experiment 1. Experiment 2 added that walking with larger than preferred
FP, at least for increases of 20%, also reduced dynamic stability, specifically that in the anterior–posterior
direction. Thus, we interpret our results to suggest that young adults elect anFPat their preferred speed
that maximizes their local dynamic stability. This is not an entirely novel proposition; step-to-step ankle power control of robotic prostheses can improve walking balance performance [24,37]. Here, recall that push-off contributes to both leg swing and CoM acceleration [20], thus manipulating push-off intensity could have negative effects on stability by way of step-to-step disruptions to leg swing and/or CoM acceleration. Interestingly, dynamic stability does seem to be somewhat less susceptible to increasing push-off intensity; increasingFPby 10% had no effect on dynamic stability compared to normal walking.
One possible explanation is that increases in push-off intensity were simply dissipated by the swing leg with negligible impacts on CoM acceleration. We also discovered that changes in dynamic stability across conditions were direction-dependent; only that derived from anterior–posterior sacrum trajectories was susceptible to the 20% increase inFP. This may suggest a resilience to increased push-off intensity in the
mediolateral and vertical directions.
Young adults have a well-documented affinity for optimizing in their locomotor patterns [38–40]. For example, young adults adopt step frequencies [41] and step widths [33] that minimize metabolic costs. These studies have led to an energy minimization hypothesis governing human locomotion—that healthy individuals adopt locomotor patterns in walking that minimize metabolic energy consumption. Similarly, based on our current findings, we posit that stability maximization may also play a role in governing locomotor patterns, at least in young adults’ selection of their preferred push-off intensity. Ultimately, the locomotor pattern which optimizes push-off intensity and balance and that which optimizes metabolic energy expenditure may not be mutually exclusive. Indeed, the naturally emergent timing and magnitude of a propulsive push-off from the ankle plantarflexor muscles is known to contribute to economical walking [42]. Although we did not measure rates of oxygen consumption, doing so would be a valuable contribution to similar studies in the future.
4.3. Decoupling changes in kinematic variability versus dynamic stability
Increasing propulsive forces beyond their preferred magnitude in experiment 2 elicited fundamentally different changes in the relation between dynamic stability and movement variability compared to the disparate effects in these outcome measures reported for walking faster. When walking faster than preferred, humans exhibit less variability, despite poorer dynamic stability [13,14]. Thus, in this case, decreased dynamic stability is associated with more tightly regulated step-to-step kinematic patterns. By contrast, when our subjects walked with largerFPthan preferred, declines in dynamic stability were
accompanied by pervasiveincreasesin sacrum and step length variabilities. These results have interesting implications for interpreting changes in these two commonly used metrics of walking balance control. Specifically, our results suggest that changes in dynamic stability and those in kinematic variability in human walking need not always vary in opposite directions (i.e. dynamic stability increasing and kinematic variability decreasing or vice versa). There are at least two potentially related explanations for the increased variability that accompanied walking with larger than preferredFP. First, evidence
from the motor control literature has shown that executing tasks using larger muscle force magnitudes yields larger force fluctuations (i.e. increased variability) [43]. Further, Roos & Dingwell [44] used computational models to demonstrate that neuromuscular noise, a factor that increases with greater muscle activation, also increases kinematic variability [44]. Thus, at least in young adults, walking with largerFPmay increase kinematic variability via potentially interdependent changes in force production
and neuromuscular noise.
4.4. Step length changes
Our subjects systematically increased and decreased their step lengths, on average, to increase and decrease their push-off intensity viaFPtargets, respectively. Prior work has shown that, when walking
at a constant speed, modulating step length via a metronome elicits changes in short-term divergence exponents in young adults, with direction-dependent changes that are relatively consistent with our findings [45]. However, we suspect that our findings reveal novel insights into walking balance control that are unique to changes in propulsive force magnitude. Indeed, modulating step length using a metronome has altogether different effects on walking biomechanics compared to directly modulatingFP
[46]. For example, Martin & Marsh [47] found that increasing step length by 10% yielded a 12% increase in
11
rsos
.ro
yalsociet
ypublishing
.or
g
R.
Soc
.open
sc
i.
4
:1
716
73
...
–10 –5 0 5 10
–20 –10 0 10 20
experiment 2
adapted from Martin & Marsh [47] % change in step length
% change in propulsive force
Figure 5.Group mean per cent change in peak propulsive force versus per cent change in step length from experiment 2, plotted
against data adapted from Martin & Marsh [47]. We found that subjects increased (decreased) their step lengths by 6.6% (−8.0%) when targeting a 20% increase (decrease) inFP, compared with walking normally. Conversely, Martin & Marsh [47] found that their subjects increased (decreased)FPby only 12.2% (−13.0%) when directly increasing (decreasing) their step lengths by 10.2% (−7.9%). These results imply that, although both change simultaneously, modifying propulsive forces is not biomechanically equivalent to modifying step lengths. Accordingly, we interpret our findings to allude to direct effects of modulating push-off intensity and not solely a result of secondary changes in step length.
step length (figure 5). In addition, independently reducingFPat a constant walking speed elicits changes
in leg joint power generation that may differ from those elicited by changes to step length alone [22,48]. Thus, although further study is required to make definitive conclusions, we interpret our findings to allude to direct effects of modulating push-off intensity and not solely the result of secondary changes in step lengths.
4.5. Limitations
We acknowledge several limitations of this study. First, we describe the implications of our findings primarily in the context of their relevance to age-related gait changes, but have not yet included a cohort of older adults in our study design. Second, we did not test speeds faster than preferred and instead refer to other studies for these data. Third, we conclude that a reduction inFPduring walking at a fixed
preferred speed would not confer better dynamic stability. However, we cannot exclude the possibility that a diminished push-off, by way of reducing shear forces, may mitigate the risk of slipping. We do note that Winteret al. [10] indirectly described trade-offs between push-off intensity and walking balance control, not in the context of slips, but to explain biomechanical changes in elderly gait that occur also in controlled laboratory conditions where slips are highly unlikely. We also acknowledge that push-off intensity is often described as an upward and forward thrust from the ankle. While we admittedly only modulated forward propulsion via FP, we have shown thatFP modulation also systematically effects
trailing limb CoM work and ankle power generation during push-off [22]. In addition, we interpret changes in our outcome measures elicited through the use of biofeedback to directly reflect those due to modulatingFP. Indeed, subjects’ response to biofeedback alone, and thus the effects of making
12
rsos
.ro
yalsociet
ypublishing
.or
g
R.
Soc
.open
sc
i.
4
:1
716
73
...
functions well with smaller datasets (i.e. approx. 1 min) though loses some sensitivity for detecting differences from longer time series [49]. Lastly, there are numerous metrics for quantifying the integrity of balance control during walking. We elected to use dynamic stability and kinematic variability as our primary metrics, though Floquet multipliers [50] and margin of stability [51] may be valuable for follow-on analyses.
4.6. Implications for biomechanical changes in elderly gait
Older adults often walk slower than young adults. However, prior to preferring slower speeds, older adults walk with a diminished push-off—decreasedFP accompanied by reduced ankle moment and
power generation. Although the mechanisms governing the onset of these biomechanical changes and how they precipitate slower preferred speeds are poorly understood and probably multi-factorial, our present findings allude to a novel explanation that warrants further study. Here, we provide empirical evidence that walking at the same speed but with a diminished push-off systematically decreases dynamic stability. Perhaps, it should not be surprising then that age-related reductions in push-off intensity are regularly accompanied by considerable reductions in dynamic stability, all before older adults choose to walk slower [9]. For example, Kang & Dingwell [14] found that older adults averaged approximately 67% worse dynamic stability than young adults, despite walking at the same preferred speed. Taken together, one interpretation of these findings is that the onset of a diminished push-off in old age may independently contribute to poorer balance control in walking. Accordingly, based on our work and that of others, these negative effects on balance control may subsequently precipitate a decrease in the preferred walking speed of older adults in their effort to restore dynamic stability. Finally, increasing a diminished push-off is a common target for interventions aimed at improving walking performance and independence, both in older adults and in people with more acute gait disability. Our work suggests that evaluating the efficacy of these interventions should include the potentially complex effects on walking balance control.
Ethics. Permission to collect human subject data was granted to M.G.B. and J.R.F. from the University of North Carolina at Chapel Hill Institutional Review Board. All subjects provided written, informed consent prior to participating. Data accessibility.We have made all supporting data for the experiments presented in this study available in the electronic supplementary material file.
Authors’ contributions.M.G.B. and J.R.F. contributed equally to the: (i) conception and design, acquisition of data, analysis and interpretation of the data; (ii) drafting of the article and revising it critically for important intellectual content, and (iii) final approval of the version to be published.
Competing interests. We declare we have no competing interests.
Funding. This work was supported by grants from NIH (R01AG051748) and the University of North Carolina University Research Council awarded to J.R.F.
References
1. Tinetti ME, Speechley M, Ginter SF. 1988 Risk factors for falls among elderly persons living in the community.N. Engl. J. Med.319, 1701–1707. (doi:10.1056/NEJM1988122931 92604)
2. Gabr S, Al-Momani M, Al-Momani F, Alghadir A, Alharethy S. 2016 Factors related to gait and balance deficits in older adults.Clin. Interv. Aging11, 1043–1049. (doi:10.2147/CIA.S112282) 3. Graafmans W, Ooms ME, Hofstee HMA, Bezemer
PD, Bouter LM, Lips P. 1996 Falls in the elderly: a prospective study of risk factors and risk profiles.
Am. J. Epidemiol.143, 1129–1136. (doi:10.1093/ oxfordjournals.aje.a008690)
4. Steinweg KK. 1997 The changing approach to falls in the elderly.Am. Fam. Physician56, 1815–1823. 5. Abellan van Kan Get al.2009 Gait speed at usual
pace as a predictor of adverse outcomes in community-dwelling older people an International Academy on Nutrition and Aging (IANA) task force.
J. Nutr. Health Aging13, 881–889. (doi:10.1007/ s12603-009-0246-z)
6. Studenski Set al.2011 Gait speed and survival in older adults.JAMA305, 50–58. (doi:10.1001/jama. 2010.1923)
7. Franz JR, Kram R. 2013 Advanced age affects the individual leg mechanics of level, uphill, and downhill walking.J. Biomech.46, 535–540. (doi:10.1016/j.jbiomech.2012.09.032) 8. Franz JR. 2016 The age-associated reduction in
propulsive power generation in walking.Exerc. Sport Sci. Rev.44, 129–136. (doi:10.1249/JES. 0000000000000086)
9. Nilsson J, Thorstensson A. 1989 Ground reaction forces at different speeds of human walking and running.Acta Physiol. Scand.136, 217–227. (doi:10.1111/j.1748-1716.1989.tb08655.x) 10. Winter DA, Patla AE, Frank JS, Walt SE. 1990
Biomechanical walking pattern changes in the fit and healthy elderly.Phys. Ther.70, 340–347. (doi:10.1093/ptj/70.6.340)
11. Bhatt T, Espy D, Yang F, Pai Y-C. 2011 Dynamic gait stability, clinical correlates, and prognosis of falls among community-dwelling older adults.Arch.
Phys. Med. Rehabil.92, 799–805. (doi:10.1016/ j.apmr.2010.12.032)
12. Dingwell JB, Marin LC. 2006 Kinematic variability and local dynamic stability of upper body motions when walking at different speeds.J. Biomech.39, 444–452. (doi:10.1016/j.jbiomech.2004.12.014) 13. Kang HG, Dingwell JB. 2008 Effects of walking speed, strength and range of motion on gait stability in healthy older adults.J. Biomech.41, 2899–2905. (doi:10.1016/j.jbiomech.2008. 08.002)
14. Kang HG, Dingwell JB. 2008 Separating the effects of age and walking speed on gait variability.Gait Posture27, 572–577. (doi:10.1016/j.gaitpost. 2007.07.009)
15. Hak L, Houdijk H, Beek PH, van Dieën JH. 2013 Steps to take to enhance gait stability: the effect of stride frequency, stride length, and walking speed on local dynamic stability and margins of stability.PLoS ONE
8, e82842. (doi:10.1371/journal.pone.0082842) 16. Stenum J, Bruijn SM, Jensen BR. 2014 The effect of
13
rsos
.ro
yalsociet
ypublishing
.or
g
R.
Soc
.open
sc
i.
4
:1
716
73
...to calculation methods.J. Biomech.47, 3776–3779. (doi:10.1016/j.jbiomech.2014.09.020) 17. Freire Junior RC, Porto JM, Marques NR, Magnani
PE, de Abreu DCC. 2017 The effects of a simultaneous cognitive or motor task on the kinematics of walking in older fallers and non-fallers.Hum. Mov. Sci.51, 146–152. (doi:10.1016/j.humov.2016.12.004) 18. Franz JR, Kram R. 2014 Advanced age and the
mechanics of uphill walking: a joint-level, inverse dynamic analysis.Gait Posture39, 135–140. (doi:10.1016/j.gaitpost.2013.06.012) 19. DeVita P, Hortobagyi T. 2000 Age causes a
redistribution of joint torques and powers during gait.J. Appl. Physiol.(1985)88, 1804–1811. 20. Zelik KE, Adamczyk PG. 2016 A unified perspective
on ankle push-off in human walking.J. Exp. Biol.
219, 3676–3683. (doi:10.1242/jeb.140376) 21. Hsiao H, Knarr BA, Higginson JS, Binder-Macleod
SA. 2015 The relative contribution of ankle moment and trailing limb angle to propulsive force during gait.Hum. Mov. Sci.39, 212–221. (doi:10.1016/ j.humov.2014.11.008)
22. Browne MG, Franz JR. 2017 The independent effects of speed and propulsive force on joint power generation in walking.J. Biomech.55, 48–55. (doi:10.1016/j.jbiomech.2017.02.011)
23. Silder A, Heiderscheit B, Thelen DG. 2008 Active and passive contributions to joint kinetics during walking in older adults.J. Biomech.41, 1520–1527. (doi:10.1016/j.jbiomech.2008.02.016) 24. Kim M, Collins SH. 2013 Stabilization of a
three-dimensional limit cycle walking model through step-to-step ankle control.IEEE Int. Conf. Rehabil. Robot.2013, 6650437.
25. Zeni Jr JA, Richards JG, Higginson JS. 2008 Two simple methods for determining gait events during treadmill and overground walking using kinematic data.Gait Posture27, 710–714. (doi:10.1016/ j.gaitpost.2007.07.007)
26. Rosenstein MT, Collins JJ, De Luca CJ. 1993 A practical method for calculating largest Lyapunov exponents from small data sets.Physica D65, 117–134. (doi:10.1016/0167-2789(93)90009-P) 27. Toebes MJP, Hoozemans MJM, Furrer R, Dekker J,
van Dieën JH. 2012 Local dynamic stability and variability of gait are associated with fall history in elderly subjects.Gait Posture36, 527–531. (doi:10.1016/j.gaitpost.2012.05.016)
28. Franz JR, Francis CA, Allen MS, O’Connor SM, Thelen DG. 2014 Advanced age brings a greater reliance on
visual feedback to maintain balance during walking.Hum. Mov. Sci.40, 381–392. (doi:10.1016/ j.humov.2015.01.012)
29. Virgin LN. 2000Introduction to experimental nonlinear dynamics: a case study in mechanical vibration. Cambridge, UK: Cambridge University Press.
30. Kennel MB, Brown R, Abarbanel HD. 1992 Determining embedding dimension for phase-space reconstruction using a geometrical construction.Phys. Rev. A.45, 3403–3411. (doi:10.1103/PhysRevA.45.3403)
31. Bauby CE, Kuo AD. 2000 Active control of lateral balance in human walking.J. Biomech.33, 1433–1440. (doi:10.1016/S0021-9290(00)00 101-9)
32. Collins SH, Kuo AD. 2013 Two independent contributions to step variability during overground human walking.PLoS ONE8, e73597. (doi:10.1371/ journal.pone.0073597)
33. Donelan JM, Shipman DW, Kram R, Kuo AD. 2004 Mechanical and metabolic requirements for active lateral stabilization in human walking.J. Biomech.
37, 827–835. (doi:10.1016/j.jbiomech.2003. 06.002)
34. O’Connor SM, Kuo AD. 2009 Direction-dependent control of balance during walking and standing.
J. Neurophysiol.102, 1411–1419. (doi:10.1152/jn. 00131.2009)
35. O’Connor SM, Xu HZ, Kuo AD. 2012 Energetic cost of walking with increased step variability.Gait Posture
36, 102–107. (doi:10.1016/j.gaitpost.2012.01.014) 36. Francis CA, Franz JR, O’Connor SM, Thelen DG. 2015
Gait variability in healthy old adults is more affected by a visual perturbation than by a cognitive or narrow step placement demand.Gait Posture42, 380–385. (doi:10.1016/j.gaitpost.2015.07.006) 37. Kim M, Collins SH. 2015 Once-per-step control of
ankle-foot prosthesis push-off work reduces effort associated with balance during walking.
J. Neuroeng. Rehabil.12, 43. ( doi:10.1186/s12984-015-0027-3)
38. Selinger JC, O’Connor SM, Wong JD, Donelan JM. 2015 Humans can continuously optimize energetic cost during walking.Curr. Biol.25, 2452–2456. (doi:10.1016/j.cub.2015.08.016)
39. Bertram JE. 2005 Constrained optimization in human walking: cost minimization and gait plasticity.J. Exp. Biol.208, 979–991. (doi:10.1242/jeb.01498)
40. Latt MD, Menz HB, Fung VS, Lord SR. 2008 Walking speed, cadence and step length are selected to optimize the stability of head and pelvis accelerations.Exp. Brain Res.184, 201–209. (doi:10.1007/s00221-007-1094-x)
41. Umberger BR, Martin PE. 2007 Mechanical power and efficiency of level walking with different stride rates.J. Exp. Biol.210, 3255–3265.
(doi:10.1242/jeb.000950)
42. Zelik KE, Huang T-WP, Adamczyk PG, Kuo AD. 2014 The role of series ankle elasticity in bipedal walking.
J. Theor. Biol.346, 75–85. (doi:10.1016/j.jtbi.2013. 12.014)
43. Joshi MN, Keenan KG. 2016 Force fluctuations while pressing and moving against high- and low-friction touch screen surfaces.Exp. Brain. Res.234, 1893–1901. (doi:10.1007/s00221-016-4581-0) 44. Roos PE, Dingwell JB. 2010 Influence of simulated
neuromuscular noise on movement variability and fall risk in a 3D dynamic walking model.J. Biomech.
43, 2929–2935. (doi:10.1016/j.jbiomech.2010. 07.008)
45. McAndrew Young PM, Dingwell JB. 2012 Voluntarily changing step length or step width affects dynamic stability of human walking.Gait Posture35, 472–477. (doi:10.1016/j.gaitpost.2011.11.010) 46. Franz JR, Maletis M, Kram R. 2014 Real-time feedback enhances forward propulsion during walking in old adults.Clin. Biomech.29, 68–74. (doi:10.1016/j.clinbiomech.2013.10.018) 47. Martin PE, Marsh AP. 1992 Step length and
frequency effects on ground reaction forces during walking.J. Biomech.25, 1237–1239. (doi:10.1016/ 0021-9290(92)90081-B)
48. Krupenevich RL, Miller RM. 2017Lower extremity joint kinetics in young adults walking with varied step lengths. Boulder, CO: American Society of Biomechanics.
49. Cignetti F, Decker LM, Stergiou N. 2012 Sensitivity of the Wolf’s and Rosenstein’s algorithms to evaluate local dynamic stability from small gait data sets.
Ann. Biomed. Eng.40, 1122–1130. (doi:10.1007/ s10439-011-0474-3)
50. Hurmuzlu Y, Basdogan C. 1994 On the measurement of dynamic stability of human locomotion.
J. Biomech. Eng.116, 30–36. (doi:10.1115/1.289 5701)

![Figure 5. Group mean per cent change in peak propulsive force versus per cent change in step length from experiment 2, plotted against data adapted from Martin & Marsh [47]](https://thumb-us.123doks.com/thumbv2/123dok_us/8261526.2188715/11.782.209.576.68.427/figure-group-propulsive-experiment-plotted-adapted-martin-marsh.webp)
