A SIMPLE Pipeline for Mapping Point Mutations
1[OPEN]
Guy Wachsman,a Jennifer L. Modliszewski ,b Manuel Valdes,a and Philip N. Benfeya,c,2
a
Department of Biology, Duke University, Durham, North Carolina 27708 bUniversity of North Carolina, Chapel Hill, North Carolina 27599
cHoward Hughes Medical Institute, Duke University, Durham, North Carolina 27708
ORCID IDs: 0000-0002-0551-9333 (G.W.); 0000-0002-5219-5343 (J.L.M.); 0000-0002-7370-0871 (M.V.); 0000-0001-5302-758X (P.N.B.).
A forward genetic screen is one of the best methods for revealing the function of genes. In plants, this technique is highly
efficient, as it is relatively easy to grow and screen hundreds or thousands of individuals. The cost efficiency and ease of data
production afforded by next-generation sequencing have created new opportunities for rapid mapping of induced mutations. Current mapping tools are often not user friendly, are complicated, or require extensive preparation steps. To simplify the
process of mapping new mutations, we developed a pipeline that takes next-generation sequencing fastqfiles as input, calls on
several well-established and freely available genome-analysis tools, and outputs the most likely causal DNA changes. The
pipeline has been validated inArabidopsis thaliana(Arabidopsis) and can be readily applied to other species, with the possibility
of mapping either dominant or recessive mutations.
Identifying the genetic mutations and genes that underlie phenotypic changes is essential for under-standing a wide variety of biological processes. A for-ward genetic screen is one of the most powerful tools for searching for such mutations. Spontaneous and in-duced mutations have been used to identify genes underlying aberrant phenotypes for over 100 years (Morgan, 1910). In the common case, a mutagen is used to generate a few thousand random mutations in the genome by physical (radiation; Muller, 1927), chemical (ethyl methanesulfonate [EMS]; Koornneef et al., 1982), or biological (transposons; McClintock, 1950) agents followed by a screen for the desired phenotype caused by one of the mutations. Once a plant with the desired phenotype is isolated, the researcher must identify the causal mutation. This is done by testing for an associ-ation between known genetic markers and phenotype. A significant association indicates that the causal mu-tation is located in the vicinity of the genetic marker. The introduction of next-generation sequencing (NGS) for mapping purposes has proven to be very promising, as it is possible to quickly identify a small number of
potential causal single-nucleotide polymorphisms (SNPs). However, the currently available tools, such as SNPtrack (Leshchiner et al., 2012), SHOREmap (Schneeberger et al., 2009), and NGM (Austin et al., 2011), are either inoperable (SNPtrack) or require coding knowledge and/or significant preparation of the data prior to implementation (e.g. SHOREmap and NGM). Other tools, such as CloudMap (Minevich et al., 2012), are not very user friendly.
We have developed the SIMPLE tool (Simple Map-ping Pipeline), which operates on the input of the NGS fastqfiles generated from wild-type and mutant bulked DNA pools and produces tables and plots showing the most likely candidate genes and genomic locations. The tool can be easily downloaded and executed with no prior bioinformatics knowledge and requires only a few simple preparatory steps to initiate. Once the program runs, the user accesses a table with the most likely candidate genes andfigurefiles that mark the locations of these candidates. Our pipeline has several advan-tages in comparison with other mapping tools. First, the entire process is user friendly. It does not require any programming knowledge or NGS analysis skills. Second, it is all inclusive; besides a few initial simple steps such as downloading the fastqfiles and deter-mining the species, the user only needs to paste three lines into the terminal application to run the pro-gram. These steps are described in the READMEfile. Third, the program can accept as input any paired-end or single-paired-end fastq combination from the wild-type and mutant bulks. Fourth, this tool accepts, based on our experience, several types of segregating populations, such as M2 and M3 populations, and does not require any map cross or back cross (Abe et al., 2012; Fekih et al., 2013). The project is hosted on GitHub and is available for download at https:// github.com/wacguy/Simple.
1This work was supported by the National Institutes of Health
(grant no. R01-GM043778 to P.N.B.), the Howard Hughes Medical Institute, and the Gordon and Betty Moore Foundation (grant no. GBMF3405).
2Address correspondence to [email protected].
The author responsible for distribution of materials integral to the
findings presented in this article in accordance with the policy de-scribed in the Instructions for Authors (www.plantphysiol.org) is: Philip N. Benfey ([email protected]).
G.W. conceived the project, wrote the article, and performed most of the experiment; J.L.M. provided help with writing the codes and the article; M.V. performed one of the genetic screens; P.N.B. super-vised the project and the writing.
[OPEN]
Articles can be viewed without a subscription. www.plantphysiol.org/cgi/doi/10.1104/pp.17.00415
RESULTS
The Concept behind the Mapping Tool
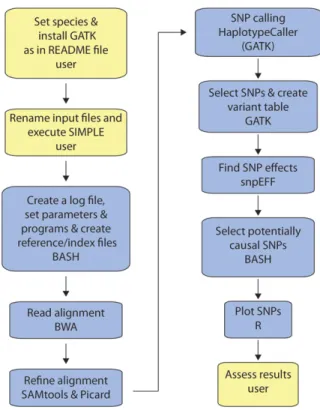
All methods that aim to map a causal DNA change implement a similar strategy. For bulk-segregant anal-ysis, a segregating population is divided into one bulk of individuals with a mutant phenotype and one bulk of individuals with a wild-type phenotype. DNA from each of the two bulked samples is sequenced by NGS. For recessive mutations, the basic principle is tofind the polymorphism (SNP or insertion-deletion) that has only non-reference reads (i.e. locations that differ from the reference genome) in the mutant bulk and an ap-proximately 1:2 mutant:wild type ratio of reads in the wild-type bulk (since the wild-type bulk is composed of +/2and +/+ individuals in a 2:1 ratio). For dominant mutations, the concept is similar, with the exception that the wild-type bulk is expected to be homozygous (+/+), whereas the mutant bulk is composed of mixed genotypes of mutant individuals (+/2and 2/2 in a 2:1 ratio). Our pipeline is based on a short BASH script that calls BWA (Li and Durbin, 2009), Samtools (Li et al., 2009), Picard (http://broadinstitute.github.io/picard), GATK (McKenna et al., 2010; DePristo et al., 2011; Van der Auwera et al., 2013), SnpEff (Cingolani et al., 2012), and R (R Core Team, 2013) in order to generate sev-eral variant call format files and three plots. The EMS.candidates.txt file lists all candidate genes, and the EMS.allSNPs.txt file contains the entire SNP/ insertion-deletion population found by the GATK HaplotypCaller tool. Generation of the candidate list is based on several criteria. First, and most importantly, the mutation must segregate in the correct (or nearly correct) ratio as described above. The GATK HaplotypCaller tool uses the PairHMM algorithm to create a matrix of haplotypes and their likelihoods based on the readfiles. This is used to determine the allele in each SNP location. For each potential SNP, the GATK HaplotypCaller then calculates the probability for each possible genotype (note that there might be more than two genotypes due to pooling of multiple individuals) and assigns the most likely one. There is no fixed allelic ratio that determines the output genotype, since it is also influenced by neighboring sequences. Additionally, we chose to focus on SNPs that are con-sistent with a specific set of criteria to identify the most likely causal mutation. Besides having the correct allelic frequency in each of the bulks, the SNP(s) has to affect a coding region with significant effect on the protein rather than synonymous mutations or changes in intergenic regions. Figure 1 shows aflow chart of the pipeline.
To test our pipeline, we sequenced 10 Arabidopsis populations that were generated in three independent EMS screens. We used four different population types: M2 (a segregating population generated by selfing a heterozygous plant from a mutagenized population), M3 (a segregating population generated by selfing a heterozygous M2 plant), back cross (an F2 segregating population generated by crossing a mutant plant with
the original parental line), and map cross (an F2 seg-regating population generated by crossing a mutant plant with another accession, such as Landsbergerecta [Ler]). Some of the mutants were sequenced more than once or in successive generations if they had more than one mapping population or if initial mapping failed (for details, see Table I).
The pipeline produces three relevantfiles for the user, EMS.candidates.txt, EMS.Rplot.loess1.pdf, and EMS. Rplot.loess3.pdf (file details below), to help identify the causal mutation. In most cases, the candidate list output
file (EMS.candidates.txtfiles) together with the position
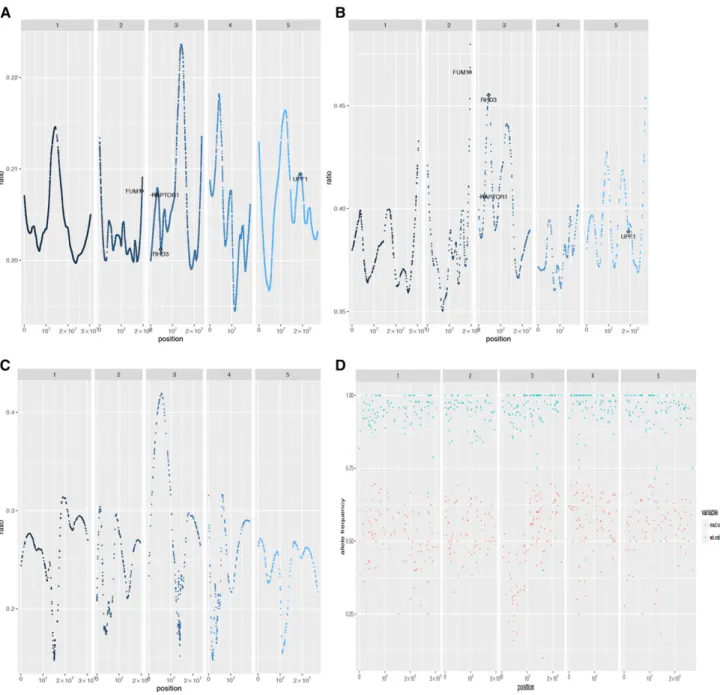
from the SNP-ratio plot were sufficient to identify the causal mutation (Fig. 2, A and B). In line M2-194, no genes were found in the candidate list, most likely due to an erroneous inclusion of wild-type seedlings in the mutant bulk (Fig. 2, C and D). Nevertheless, the program provides additional information to help identify strong candidates. For example, the plot indicates a linked locus near the top of chromosome 3 (Fig. 2C). Browsing the SNP population in this region identifies a premature stop codon inRHD3(AT3G13870). Indeed, this line has a short root and wavy root hair phenotype similar to the mapped M2-300/M3-300-4 line and to rhd3-1 (Wang et al., 1997, 2015). Supplemental File S1 lists all putative causal SNPs from line M2-194, with four (marked in boldface) that have allele frequencies that resemble contaminating wild-type plants in the mutant bulk.
Figure 1. The SIMPLE pipeline workflow. User-required actions are
Tabl e I. Mappi ng popula tions used to tes t the SIM PLE pipe line Column 1 denotes the line nu mber . Line No. Line a Gener ation Mapped Gene At_num Mutant/Wild-Ty p e Seedlings
There are two parameters that appear to strongly influence the success of the pipeline in identifying the causal mutation or, at least, a short list of potential SNPs. First, incorrect inclusion of wild-type plants in the mutant bulk leads to reference reads in the mutant fastqfile. As a result, the causal SNP and linked mu-tations are viewed as heterozygous. Therefore, it is es-sential that all individuals in the mutant bulk be phenotyped correctly. In cases where the phenotype is difficult to recognize, as often occurs with quantitative traits, it is recommended to work with smaller but high-confidence populations rather than include potentially
wild-type individuals in the mutant bulk. Alterna-tively, mutant plants can be tested based on the segre-gation of their offspring. A second critical parameter is sequencing depth. This is important because different genomic regions have variable coverage depth. Even when mean coverage appears to be sufficient, some regions may still have very few reads, which renders them almost impossible to genotype. We recommend a minimum of 303coverage.
We recommend working with an F2/M2 generation rather than an F3/M3 generation for two reasons. First, a segregating F3/M3 population generated from a
Figure 2. Example of the output plots.xaxis, Chromosomal location;yaxis, ratio variable (A–C; for details, see Eq. 1) and the
single F2/M2 heterozygous plant is homozygous for one-quarter of the loci as well as homozygous for the causal SNP, whereas an F2/M2 population is homo-zygous only for the causal mutation and the genetically linked region. Therefore, there is substantial information loss in the F3/M3 generation and mapping is heavily dependent on the segregation of the wild-type bulk. This bulk is less informative because the 2:1 wild type:mutant ratio in the binomial read distribution has a higher po-tential to vary from the expected values. In contrast, the mutant bulk is expected to have strictly no reference reads and a few dozen alternate reads. Another reason to use the F2/M2 generation is that the following generation goes through a second round of recombination, which generates chromosomal regions with more complex haplotypes, which are more difficult to interpret.
Input Files
The user provides the fastqfiles that are generated by an NGS platform such as Illumina 2000 and places them in the fastq folder. Each bulk (mutant or wild type) can have either a singlefile in the case of single-end sequencing or twofiles for paired-end sequenc-ing. All other dependencies, such as reference files and programs, are either present or downloaded as part of the pipeline. Java and R should be pre-installed. A short description of how to run the pipeline is pro-vided in the README.txtfile (Supplemental File S2); settings for the tools used are provided in Supplemental File S3. Users should only rely on the README file download from GitHub since the instructions might change due to modifications we keep introducing to the program for improvement purposes.
Output Files
The program generates more than 30files, although most of them are not necessary for nonprogrammers. There are four files that can help identify the causal mutation. The files EMS.Rplot.loess1.pdf and EMS. Rplot.loess3.pdf (similar to Fig. 2, A–C) show the chro-mosomal location of each SNP, plotted against a LOESS-fitted ratio variable and the most likely candidate SNP(s). This variable was generated using this equation:
ratio¼ wtref wtrefþwtalt2
mutref
mutrefþmutalt ð 1Þ
where, wtrefis the number of reads in the wild-type bulk that are called with the reference genome nucleotide,
wtaltis the number of reads in the wild-type bulk that are called with a non-reference genome nucleotide, mutrefis the number of reads in the mutant bulk that are called with the reference genome nucleotide, and, mutaltis the number of reads in the mutant bulk that are called with a non-reference genome nucleotide.
The ratio variable represents the allele frequency comparison between the two bulks. It should be around 0 for unlinked SNPs and approximately 0.66 for the causal mutation and genetically linked SNPs (Fig. 2, A– C). We removed all SNPs with a ratio lower than 0.1 (Fig. 2A; outputfile EMS.Rplot.loess1.pdf) and 0.3 (Fig. 2B; output file EMS.Rplot.loess3.pdf) and applied LOESS smoothing with degree = 2 and span = 0.3. It is important to note that changing the parameter can have a significant effect on the LOESS smoothing plot, as shown in Figure 2, A and B, and as a result, placing strong candidates outside a local peak. To avoid such cases, we decided to output two plots to ensure that at least one will place the candidate SNP(s) in a local peak. However, in more than 90% of the cases, the strongest candidate SNP was plotted in a correct position around the summit of a local peak in both plots. Finally, the program will print the wild-type allelic ratio of each bulk to the EMS.Rplot_allele.pdffile (Fig. 2D).
The strongest candidate genes are listed in EMS. candidates.txt (for an example, see Supplemental File S4). These candidates are selected based on the fol-lowing criteria. (1) The SNP should be homozygous for the alternate allele (namely, only reads that are differ-ent from the reference genome) in the mutant bulk and with an approximately 2:1 reference:alternate read ratio in the wild-type bulk. (2) The mutation should have a significant effect on the protein (e.g. splice ac-ceptor, splice donor, start lost, stop gained, or missense variant).
All SNPs with their locations, the change in the coding sequence, the effect on the protein, and the number of reads for each allele in each bulk are listed in EMS.allSNPs.txt (for an example, see Supplemental File S5). Thisfile is important in case the EMS.candidates.txt did not yield any candidate genes. For example, in some cases, the phenotype of the sampled mutants is difficult to distinguish from the wild type, such as the case when mapping quantitative traits or mutants with subtle phenotypes. In these scenarios, wild-type or heterozygous plants might be included in the mutant bulk and the causal SNP is interpreted as heterozygous for both bulks. In such cases, the user can manually browse the EMS.allSNPs.txt file to identify (1) SNPs
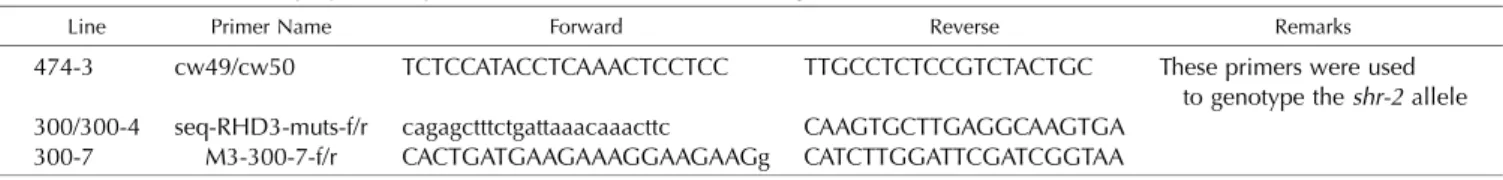
Table II.Primers used to amplify and sequence the male allele in F1 seedlings
Line Primer Name Forward Reverse Remarks
474-3 cw49/cw50 TCTCCATACCTCAAACTCCTCC TTGCCTCTCCGTCTACTGC These primers were used to genotype theshr-2allele 300/300-4 seq-RHD3-muts-f/r cagagctttctgattaaacaaacttc CAAGTGCTTGAGGCAAGTGA
that are nearly homozygous-alternate in the mutant bulk and approximately 2:1 reference:alternate allelic ratio in the wild-type bulk and (2) SNPs with a signif-icant effect on the coding region. Other output files, such as aligned reads (bamfiles) and potentially causal SNPs that originated from a nonreference nucleotide (a very improbable event), are in the archive folder.
DISCUSSION
Approximately half of the genes in the Arabidopsis genome have unknown functions (http://www. arabidopsis.org/portals/genAnnotation/genome_ snapshot.jsp), creating a large opportunity for discov-ering novel genes through relatively simple forward genetic screens. The introduction of NGS technologies offers new and rapid opportunities for identification of the genes affected by such screens. The main advantage of genome sequencing over traditional map-based cloning methods that use molecular markers, such as restriction fragment length polymorphisms, is that NGS provides single-nucleotide resolution. While pre-NGS methods could identify a genomic region, this had to be further mined for potential mutation(s) in candidate genes. By contrast, sequencing a mutagen-ized genome reveals the entire population of genetic changes. The causal mutation is then precisely identi-fied using bioinformatics/computational tools. An-other important benefit of using NGS for mapping is that a small population (a few dozen individuals) is usually sufficient for mapping. Since the mapping res-olution is as high as a single nucleotide, the importance of each recombinant for reducing the region of the causal mutation (chromosome walking) is reduced. In other words, the size of the region bounded by re-combination events in which the causal mutation lies is no longer critical, since the researcher can visualize each SNP, evaluate it, and choose the one that has the highest likelihood of being causal. Mapping by NGS is espe-cially fruitful when a large mapping population can be easily generated and screened, which is the case for many plant species as well as for nematodes, fruitflies, and yeast. We have developed an easy-to-use tool that allows mapping of single-nucleotide induced muta-tions, even by researchers who have very little experi-ence with bioinformatics tools. Our pipeline takes fastq files as input and identifies causal SNPs with no pre-processing steps required. The output tables and plots can be readily used to identify the most likely mutation. Even in the case where no candidate gene is present, the list of SNPs with their read calls in the mutant and wild-type bulks and their effect will frequently point to the correct gene. In theory, the SIMPLE pipeline can be used with any diploid species that has bulked mutant and wild-type mapping populations. The current pipeline should work with Arabidopsis, Oryza sativa (rice), Zea mays (corn), Solanum lycopersicum (tomato) Drosophila melanogaster(fruitfly),Caenorhabditis elegans, andDanio rerio(zebrafish), although it has only been
validated for Arabidopsis and rice. Notably, it is pos-sible to add any species with a sequenced genome (see READMEfile). The program runs on Mac OSX version 10.11.6 and Linux release 6.7 (GNOME 2.28.2) with Java 1.7 installed (see READMEfile for specification), which are commonly used platforms in many laboratories. The SIMPLE project is hosted on GitHub (https:// github.com/wacguy/Simple) and includes a quick-start READMEfile.
CONCLUSION
We describe the SIMPLE pipeline, a bioinformatics tool for identifying causal mutations in forward genetic screens. We tested SIMPLE on several different data sets and show that it can discover the region and causal SNP underlying a mutant phenotype. One important feature of SIMPLE is that it is user friendly and does not require a broad understanding of bioinformatic pro-cessing tools. We greatly minimized the software in-stallation and data preparation processes required by the end user, allowing quick and simple initiation of the pipeline. Additionally, the number of sampled indi-viduals can be reduced to a few dozen, which further shortens the analysis time. Lastly, the SIMPLE tool can be implemented for mapping causal mutations in any diploid organism with a sequenced genome. We believe that the SIMPLE pipeline can be of great use to many researchers who are interested in mapping their gene of interest.
MATERIALS AND METHODS
Growth Condition and Screening
Arabidopsis (Arabidopsis thaliana) seedlings were grown on Murashige and Skoog medium (Murashige and Skoog, 1962) containing 1% (w/v) Suc. EMS screen was performed according to Weigel and Glazebrook (2006). Lines 474-3, 300, 300-4, 300-7, 633, and 194 were screen according to Moreno-Risueno et al. (2010). Lines B381 and M381 were screened according to Liberman et al. (2015). Line EMS608 was screened using the GFP cortex marker (Brady et al., 2007). The GFP screens were performed using a Leica fluorescence stereo dissecting scope.
Sequencing
Paired-end or single-end libraries were prepared using NexteraXT or the KAPA Hyper-prep Kit according to the manufacturer’s instructions and sequenced on an Illumina 2000/2500 instrument with the high- or rapid-throughput mode at the Duke Center for Genomic and Computa-tional Biology.
Mutant Validation
Line 474-3 has a single ground tissue layer and a short root phenotype, similar to othershralleles (Helariutta et al., 2000). The phenotype of F1 offspring in a cross between 474-3 as a male donor andshr-2(Helariutta et al., 2000) has the phenotype of the parental lines, suggesting that line 474-3 is allelic toSHR.
previously (Liberman et al., 2015). Line 194 has the same phenotype as line 300-4 and therhd3-1allele as described above.
All F1 crosses were sequenced for the male donor allele (for primers, see Table II).
Accession Numbers
The data sets generated and/or analyzed during this study are available in the Short Read Archive repository with the accession number PRJNA353239 (https://www.ncbi.nlm.nih.gov/sra/?term=PRJNA353239).
Supplemental Data
The following supplemental materials are available.
Supplemental File S1.SNPs and putative causal mutations in line M2-194.
Supplemental File S2.Instructionfile for running the pipeline.
Supplemental File S3.Settings for tools used by SIMPLE.
Supplemental File S4.An example EMS.candidates.txtfile from line 633.
Supplemental File S5.An example EMS.allSNPs.txtfile from line 633.
ACKNOWLEDGMENTS
We thank members of the Benfey laboratory for comments on the article and helpful experimental suggestions, Carmen Wilson for technical assistance, as well as the Duke Center for Genomic and Computational Biology for preparing and sequencing the DNA libraries.
Received April 12, 2017; accepted May 23, 2017; published May 25, 2017.
LITERATURE CITED
Abe A, Kosugi S, Yoshida K, Natsume S, Takagi H, Kanzaki H, Matsumura H, Yoshida K, Mitsuoka C, Tamiru M, et al(2012) Genome sequencing reveals agronomically important loci in rice using MutMap. Nat Biotechnol30:174–178
Austin RS, Vidaurre D, Stamatiou G, Breit R, Provart NJ, Bonetta D, Zhang J, Fung P, Gong Y, Wang PW, et al(2011) Next-generation mapping of Arabidopsis genes. Plant J67:715–725
Brady SM, Orlando DA, Lee JY, Wang JY, Koch J, Dinneny JR, Mace D, Ohler U, Benfey PN(2007) A high-resolution root spatiotemporal map reveals dominant expression patterns. Science318:801–806
Breuer C, Stacey NJ, West CE, Zhao Y, Chory J, Tsukaya H, Azumi Y, Maxwell A, Roberts K, Sugimoto-Shirasu K (2007) BIN4, a novel component of the plant DNA topoisomerase VI complex, is required for endoreduplication in Arabidopsis. Plant Cell19:3655–3668
Cingolani P, Platts A, Wang L, Coon M, Nguyen T, Wang L, Land SJ, Lu X, Ruden DM(2012) A program for annotating and predicting the ef-fects of single nucleotide polymorphisms, SnpEff: SNPs in the genome of Drosophila melanogaster strain w1118; iso-2; iso-3. Fly (Austin)6:80–92 DePristo MA, Banks E, Poplin R, Garimella KV, Maguire JR, Hartl C, Philippakis AA, del Angel G, Rivas MA, Hanna M, et al(2011) A framework for variation discovery and genotyping using next-generation DNA sequencing data. Nat Genet43:491–498
Fekih R, Takagi H, Tamiru M, Abe A, Natsume S, Yaegashi H, Sharma S, Sharma S, Kanzaki H, Matsumura H, et al(2013) MutMap+: genetic map-ping and mutant identification without crossing in rice. PLoS ONE8:e68529 Helariutta Y, Fukaki H, Wysocka-Diller J, Nakajima K, Jung J, Sena G, Hauser MT, Benfey PN(2000) The SHORT-ROOT gene controls radial patterning of the Arabidopsis root through radial signaling. Cell101:555–567
Koornneef M, Dellaert LW, van der Veen JH(1982) EMS- and radiation-induced mutation frequencies at individual loci in Arabidopsis thaliana (L.) Heynh. Mutat Res93:109–123
Leshchiner I, Alexa K, Kelsey P, Adzhubei I, Austin-Tse CA, Cooney JD, Anderson H, King MJ, Stottmann RW, Garnaas MK, et al(2012) Mu-tation mapping and identification by whole-genome sequencing. Ge-nome Res22:1541–1548
Li H, Durbin R (2009) Fast and accurate short read alignment with Burrows-Wheeler transform. Bioinformatics25:1754–1760
Li H, Handsaker B, Wysoker A, Fennell T, Ruan J, Homer N, Marth G, Abecasis G, Durbin R(2009) The sequence alignment/map format and SAMtools. Bioinformatics25:2078–2079
Liberman LM, Sparks EE, Moreno-Risueno MA, Petricka JJ, Benfey PN (2015) MYB36 regulates the transition from proliferation to differen-tiation in the Arabidopsis root. Proc Natl Acad Sci USA112:12099– 12104
Liu D, Gong Q, Ma Y, Li P, Li J, Yang S, Yuan L, Yu Y, Pan D, Xu F, et al (2010) cpSecA, a thylakoid protein translocase subunit, is essential for photosynthetic development in Arabidopsis. J Exp Bot61:1655– 1669
McClintock B(1950) The origin and behavior of mutable loci in maize. Proc Natl Acad Sci USA36:344–355
McKenna A, Hanna M, Banks E, Sivachenko A, Cibulskis K, Kernytsky A, Garimella K, Altshuler D, Gabriel S, Daly M, et al(2010) The Ge-nome Analysis Toolkit: a MapReduce framework for analyzing next-generation DNA sequencing data. Genome Res20:1297–1303 Minevich G, Park DS, Blankenberg D, Poole RJ, Hobert O (2012)
CloudMap: a cloud-based pipeline for analysis of mutant genome se-quences. Genetics192:1249–1269
Moreno-Risueno MA, Van Norman JM, Moreno A, Zhang J, Ahnert SE, Benfey PN(2010) Oscillating gene expression determines com-petence for periodic Arabidopsis root branching. Science329:1306– 1311
Morgan TH(1910) Sex limited inheritance in Drosophila. Science32:120– 122
Muller HJ(1927) Artificial transmutation of the gene. Science66:84–87 Murashige T, Skoog F(1962) A revised medium for rapid growth and bio
assays with tobacco tissue cultures. Physiol Plant15:473–497 R Core Team(2013) R: A Language and Environment for Statistical
Com-puting. R Foundation for Statistical Computing, Vienna, Austria. https://www.R-project.org/.
Schneeberger K, Ossowski S, Lanz C, Juul T, Petersen AH, Nielsen KL, Jørgensen JE, Weigel D, Andersen SU(2009) SHOREmap: simulta-neous mapping and mutation identification by deep sequencing. Nat Methods6:550–551
Van der Auwera GA, Carneiro MO, Hartl C, Poplin R, del Angel G, Levy-Moonshine A, Jordan T, Shakir K, Roazen D, Thibault J, et al (2013) From FastQ data to high confidence variant calls: the Genome Analysis Toolkit best practices pipeline. Curr Protoc Bioinformatics43: 11.10.1–11.10.33
Wang H, Lockwood SK, Hoeltzel MF, Schiefelbein JW(1997) The ROOT HAIR DEFECTIVE3 gene encodes an evolutionarily conserved protein with GTP-binding motifs and is required for regulated cell enlargement in Arabidopsis. Genes Dev11:799–811
Wang J, Wang Y, Yang J, Ma C, Zhang Y, Ge T, Qi Z, Kang Y(2015) Arabidopsis ROOT HAIR DEFECTIVE3 is involved in nitrogen starvation-induced anthocyanin accumulation. J Integr Plant Biol57: 708–721
Weigel D, Glazebrook J(2006) EMS mutagenesis of Arabidopsis seed. CSH Protoc2006:pdb.prot4621