Multilevel analysis exploring the links between stress,
depression, and sleep problems among two-year college
students
Deshira D. Wallace, MSPHa, Marcella H. Boynton, PhDa,b, and Leslie A. Lytle, PhDa
aDepartment of Health Behavior, School of Global Public Health, University of North Carolina at
Chapel Hill, Chapel Hill, North Carolina, USA
bLineberger Comprehensive Cancer Center, University of North Carolina at Chapel Hill, Chapel
Hill, North Carolina, USA
Abstract
Objective—This study explored the association of stress and depression with a multidimensional sleep problems construct in a sample of 2-year college students.
Participants—The sample consisted of 440 students enrolled in 2-year study from Fall 2011 to Fall 2013.
Methods—Participants in an obesity prevention study completed surveys assessing sleep, stress, and depression at baseline, 4, 12, and 24 months. Multilevel models predicting sleep problems were conducted to distinguish episodic from chronic reports of stress and depression.
Results—Participants were primarily women (68%), white (73%), young adults (M age = 22.8), with an average of 8.4 hours of sleep per night. Neither stress nor depression was predictive of sleep quantity; however, they were predictive of sleep quality.
Conclusions—Results show that sleep quality rather than sleep quantity may be the greater health concern for young adults, suggesting that intervention programs targeting depression, stress management, and healthy sleep patterns are warranted.
Keywords
Depression; mental health; sleep problems; stress; young adults
A plethora of evidence affirms the importance of sufficient sleep quantity and quality as
critical determinants of health and well-being.1,2 Approximately 25% of US adults report
insufficient sleep or rest at least half of the time,3 and the US government recently added
sleep health as a Healthy People 2020 objective. Insufficient sleep is associated with
CONTACT Deshira D., Wallace [email protected] Department of Health Behavior, University of North Carolina at Chapel Hill, 302 Rosenau Hall 135 Dauer Drive CB7440, Chapel Hill, NC 27599, USA.
Conflict of interest disclosure
HHS Public Access
Author manuscript
J Am Coll Health
. Author manuscript; available in PMC 2017 April 01.Published in final edited form as:
J Am Coll Health. 2017 April ; 65(3): 187–196. doi:10.1080/07448481.2016.1269111.
A
uthor Man
uscr
ipt
A
uthor Man
uscr
ipt
A
uthor Man
uscr
ipt
A
uthor Man
uscr
numerous health conditions, including increased risk of heart disease, high blood pressure,
diabetes, and adverse mental health status.4–8 Evidence suggests that there is a correlation
between sleep quantity and body mass index (BMI); individuals who report fewer hours of
sleep are more likely to be overweight or obese.5,9 However, causality remains in question
due to the cross-sectional nature of the majority of these studies.10
Young adults appear to be particularly at risk for insufficient sleep with evidence indicating
that a large majority of college students garner less than 8 hours of sleep per night.11 In
2011, one-third of young adults reported insufficient sleep.3 Poor sleep quality is also a
salient health issue for college students12 with a recent report finding 70% of 4-year college
students reporting insufficient sleep.13 Young adults may be particularly vulnerable to both
external and intrinsic factors that may hinder both the quantity and quality of sleep.11
Excessive alcohol use, caffeine use, and use of electronic media before going to bed are all behaviors common in young adults that have been implicated in negatively influencing
sleep.14,15 Many young adults are living independently from their families for the first time
and are learning how to juggle time demands from school and work, developing
relationships, and taking on more responsibility.16 These new stressors may influence
overall sleep quantity as well as quality.11,17
Young adults are also vulnerable to negative affect and other emotional issues as they go through this important life stage transition, specifically depression and stress have repeatedly
been shown to have a strong correlation with both sleep quantity and quality.8,18–23 Based
on National Health Interview Surveys, reports of depressive symptoms among young adults
have been largely stable between 1998 and 2011.24 In 2011, 4% of young adults aged 18–24
years old, and 5% of 25-to 29-year olds reported two or more depressive symptoms in the
past month.24 However, examining young adults in a 2- and 4-year college context that same
year revealed that 30% of college students reported feeling so depressed it was “difficult to
function at some time in the past year” (p. 11).25 Risk factors for depression among young
adults include poverty, stressful life events, maltreatment, and family dysfunction.26 Studies
among college students have reported that sleep problems increased the risk of developing depressive symptoms, and that depressed students are more likely to report sleep problems
than nondepressed individuals.18
Stress has also been shown to be an important factor in predicting sleep quality.11 A study
by Lund et al11 conducted with 4-year college students found that 64% of their participants
reported that academic or emotional stress adversely affected their sleep. Stressors for college students tend to be ongoing stressors related to course-work, changes in the environment, and financial issues rather than single life-events such as job loss or
divorce.11,27,28 Lee et al29 and Yang et al30 concluded that high stress levels were associated
with sleep problems, including sleep quantity and quality, and depressive symptoms among college students.
There is still a great deal that is unknown about the associations between depression, stress, and sleep problems. Stress and depression have been found to be correlated for both
undergraduate and graduate students,30 and stress has been evaluated as both a predictor of
depressive symptomatology and as a predictor of sleep problems.11,30 Despite the typically
A
uthor Man
uscr
ipt
A
uthor Man
uscr
ipt
A
uthor Man
uscr
ipt
A
uthor Man
uscr
strong associations between stress and depression, they consistently emerge as two
independent constructs.31 The literature is mixed regarding the causal direction between
these affective factors and sleep, and there is evidence that the associations may be
bidirectional in nature.20,22 It is difficult to determine if stress and depression are
independently or conjointly predictive of sleep problems or if poor sleep patterns (including the quality and quantity of sleep) predict stress and/or depression.
Prior research has not adequately established whether the associations between stress, depression, and sleep are due to the impact of chronic stress and depression (feeling stressed or depressed over months or years) or episodic stress and depression (intermittently feeling stressed or depressed because of situational factors). The majority of research to date focuses on cross-sectional assessments of stress and depression or explores how stress or depression at one point of time affects concomitant or future health risks. To date, little attention has been paid to how occasional versus consistent stress and depression might uniquely influence health.
Finally, although 2-year college students represent 43% of the US undergraduate
population,32 the majority of past research examining sleep, depression, and stress has
almost exclusively studied 4-year college student populations. Specifically, although there is a small body of research literature examining the association between academic performance
and sleep33 and perceptions of sleep34 for community college students, there are currently
no published studies to date examining the associations between depression, stress, and sleep among 2-year college students. This is despite of young adults attending 2-year colleges perhaps being more vulnerable to stress and depression than their 4-year college student counterparts as they are more likely to be older, work while in school, be married,
and be parents.35,36 These additional affect and sleep-related risk factors may also make
2-year and community college students more vulnerable to both sleep problems and obesity.37
The purpose of this study is to examine the relations between stress and depression and sleep quantity and quality in a sample of 2-year college students who were surveyed four times over a 24-month period. We examine the differential impact of chronic depression and stress and episodic depression and stress on sleep quantity as well as on three domains of sleep quality: sleep deprivation (not getting enough sleep), sleep onset insomnia (having trouble falling asleep), and hypersomnia (having trouble staying awake). We hypothesize that higher levels of depression and stress negatively influence both sleep quantity and sleep quality.
Methods
Study design and measures
The data for this study were collected as part of a 2-year weight gain prevention intervention study with 2-year college students in the Twin Cities, Minnesota metro area: the Choosing
Healthy Options in College Environments and Settings (CHOICES) study.38 Three
community and technical colleges in the Twin Cities area agreed to participate in the study by allowing recruitment, measurement, and some intervention activities to occur on their campuses. Students were recruited using a variety of methods including email invitations and recruitment desks set up in their respective colleges. Eligibility criteria included: (a)
A
uthor Man
uscr
ipt
A
uthor Man
uscr
ipt
A
uthor Man
uscr
ipt
A
uthor Man
uscr
having a BMI between 20 and <35 (ie, eligible students were neither underweight nor above Class 1 obesity); (b) attending one of the three colleges; (c) planning to stay in the area for at least 2 years; and (d) agreeing to condition randomization. After meeting the inclusion criteria and consenting to participating, students (N = 441) completed baseline assessments
and were randomized to a control or intervention condition.38 Students randomized to the
intervention condition were invited to participate in a 24-month intervention that included a one-credit, semester-long course, and Web-based intervention components. Details on the intervention and the conceptual model that guided the development of the intervention are
described elsewhere.38 All intervention and evaluation protocols for the CHOICES study
were approved by the Institutional Review Board (IRB): Human Subjects Committee at the University of Minnesota.
All participants were invited to complete four survey assessments at baseline, 4 months (immediately following the course), 12 months, and 24 months. Students were compensated up to $350 for their participation in measurement activities across the 2 years. The
assessments occurred at participants’ schools by trained and certified evaluation staff from the research team. Anthropometric assessments including height and weight measures used to calculate BMI were collected by evaluation staff. Participants also completed paper-and-pencil surveys at each measurement period that included demographic measures such as gender, age, race/ethnicity, number of children living in the home, and employment status. Depression was assessed using the 10-item Center for Epidemiologic Studies Depression (CESD-10) scale. The CESD-10 is a validated self-report scale used to measure depressive
symptomatology in the general population.39,40 A score of 10 points or higher on the
CESD-10 is indicative of “significant” or “mild” depressive symptomatology.41 Cronbach’s
α for the CESD-10 in our sample indicated acceptable scale reliability (α = .78). Stress was
measured using a 4-item abbreviated version of Cohen’s Perceived Stress Scale (PSS),
which assessed current levels of experienced stress.42 This instrument has been used and
validated with other college student and adult populations,42–44 and Cronbach’s α for our
sample indicated acceptable scale reliability (α = .64). The bivariate association between
stress and depression in our sample at baseline was r = 0.65, indicating that the constructs are associated, but not multicollinear, in the sample.
The sleep problems measures were adapted from the Pittsburgh Sleep Quality Index (PSQI),
a valid and reliable assessment of self-reported sleep duration and sleep quality.*45–47
Average daily sleep quantity was assessed by asking individuals what time they usually “go to bed in the evening (turn out the lights in order to go to sleep)” and “get out of bed in the morning” for both the weekend and weekdays. The outcome of hours of sleep per night was calculated by averaging the weekend and weekday hour estimates, weighted by a value of 2 for the former and by 5 for the latter. In addition, participants were asked about the usual time they went to bed and woke up over the past month, as it was easier to conceptualize for
adolescents and young adults in past studies.48 Sleep quality was measured using three items
to estimate the frequency of individual sleep problems. Perceived sleep deprivation was assessed with the item “During the past 30 days, for about how many days have you felt you
*Because the purpose of this study was to assess whether depression and stress predict sleep quantity as well as specific sleep quality issues, the PSQI scale items were not collapsed into a composite score.
A
uthor Man
uscr
ipt
A
uthor Man
uscr
ipt
A
uthor Man
uscr
ipt
A
uthor Man
uscr
did not get enough rest or sleep?” Reponses were coded on a 6-point scale ranging from 0 nights to 28–30 nights. Sleep onset insomnia was coded as present if an individual indicated that on ≥3 nights per week, it took them “more than 30 minutes to fall asleep after lights out.” Hypersomnia was coded as present if an individual indicated that on ≥3 days per week, they had “trouble staying awake while driving, eating meals, in class or engaging in social activity.”
Analysis plan
Given the nonindependence of the repeated longitudinal measures, multilevel models (MLMs) were employed for the sleep models. Total hours of sleep and sleep deprivation were normally distributed. Therefore, SAS PROC MIXED using maximum likelihood estimation was used to model those outcomes. Sleep onset insomnia and hypersomnia outcomes were estimated using the SAS PROC GLIMMIX procedure employing empirical “sandwich” estimators and a binary distribution specified. The intercept was treated as a random effect in all models. At the between-person level (Level 2 or L2), all continuous person-level variables were grand-mean centered, and categorical variables were dummy-coded.
Per convention, at the within-person level (Level 1 or L1), person-mean centering was employed to parse the within- versus between-person effects of the time varying
predictors,49 which in the current study were employment status, BMI, depressive
symptoms, stress, and total sleep. To take depressive symptoms as an example, each person’s average CESD-10 score across the 2-year period was first computed; this variable served as a measure of chronic depressive symptomatology (L2 effect). Next, each person’s average CESD score across the 2-year period was subtracted from the depression score reported at each time point; this variable served as a measure of episodic depression (L1 effect) because it indicates whether a person’s CESD-10 score at a particular time point was higher or lower than the average CESD-10 score for the 2-year study period.
For each outcome, an intercept-only model was first computed. Then, within-person (L1) and between-person (L2) effects were tested together in separate individual effects models. Treatment condition, age, gender, and race were included in the final models as covariates, regardless of statistical significance; all other predictors were only retained if significant in the final, combined effects model. Average hours of sleep per night was tested as a possible predictor in the three sleep quality models in order to account for the possible impact of sleep quantity on sleep quality.
Results
Sample
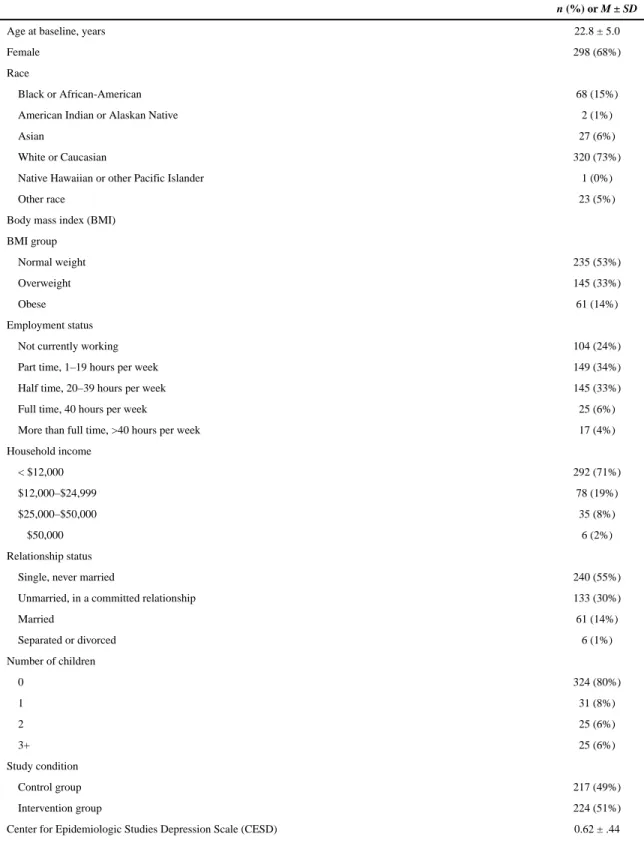
Table 1 presents baseline demographic characteristics of the study participants. Average age was 22.8 years, with 73% of participants identified as white or Caucasian, and 15% black or African-American. More than half (53%) of the sample was at a healthy weight at baseline (BMI ≤ 25). Approximately 24% of participants were not currently working, and 34% were working part-time while enrolled in a 2-year college. At baseline, 71% of participants made
A
uthor Man
uscr
ipt
A
uthor Man
uscr
ipt
A
uthor Man
uscr
ipt
A
uthor Man
uscr
less than $12,000 year, about half (55%) were single and never married, and 80% had no children.
At baseline, the average CESD-10 score for depression was 0.62 (SD = 0.44), and perceived stress was 2.35 (SD = 0.66). The average hours of sleep per night reported was 8.4 (SD = 1.2), and the average sleep deprivation score was 1.8 (SD = 1.1), indicating an average of 1– 6 nights of sleep deprivation per month. Further, 29% of students reported three or more nights per week experiencing sleep onset insomnia, and approximately 8% of students reported three or more days of hypersomnia (ie, daytime sleepiness).
Multilevel model results
Table 2 presents the multilevel modeling results for self-reported hours of sleep and sleep deprivation in the past 30 days. The final model examining predictors of sleep quantity (ie, hours of sleep per night) shows that after adjusting for other covariates, the only significant
predictors in the model were age (b = −0.04, p < .0001) and work status (bL1 = −0.14, p < .
0001; bL2 = −0.16, p < .01) Participants who were older reported fewer hours of sleep, and
individuals whose number of work hours increased during the 2-year study exhibited a corresponding decrease in sleep duration (L1 effects). In addition, participants who on average worked more hours across the study period reported significantly less sleep than participants who on average worked less (L2 effect).
For the analysis examining sleep deprivation, the final model shows that age (b = −0.02, p
< .05), race (b = 0.22, p < .05), episodic and chronic depressive symptoms (bL1 = 0.47, p < .
0001; bL2 = 0.81, p < .0001), and sleep quantity (bL1 = −0.21, p < .0001; bL2 = −0.24, p < .
0001) were all significant predictors. Specifically, being older and identified as white or Caucasian were associated with more frequent sleep deprivation. Both the L1 and L2 effects for depressive symptoms were significantly predictive of sleep deprivation, suggesting that both episodic and chronic depressive symptoms were uniquely associated with sleep deprivation, although chronic depressive symptoms exhibited the larger effect. As expected, fewer hours of sleep than usual (L1) and fewer hours of sleep across the 2 years (L2) were both associated with increased sleep deprivation.
Table 3 shows the multilevel modeling results for sleep onset insomnia and hypersomnia. The significant predictors in the final model for sleep onset insomnia or having trouble
falling asleep were work status (ORL1 = 0.81, p < .05) and episodic and chronic depressive
symptoms (ORL1 = 3.30, p < .0001; ORL2 = 5.59, p < .0001). An individual reporting a
greater average number of work hours across the study period (L2) or a greater number of work hours than his/her average (L1) was less likely to report having trouble falling asleep as compared to those reporting working fewer hours. Both depressive symptoms and perceived stress were strongly associated with a greater likelihood of sleep onset insomnia, although stress became nonsignificant in the final, combined (ie, adjusted) model. Of note, both chronic (L2) and episodic (L1) depressive symptoms were uniquely predictive of having trouble falling asleep, with chronic depressive symptoms showing the larger impact.
Similar to sleep onset insomnia, the predictors significantly associated with hypersomnia or having trouble staying awake in the final, combined effects model were depressive
A
uthor Man
uscr
ipt
A
uthor Man
uscr
ipt
A
uthor Man
uscr
ipt
A
uthor Man
uscr
symptoms (ORL1 = 2.94, p < .001; ORL2 = 2.77, p < .01), stress (ORL2 = 1.88, p < .05), and
sleep quantity (ORL1 = 0.68, p < .01; ORL2 = −0.76, p < .05). In brief, both chronic and
episodic depressive symptoms and chronic stress were associated with greater problems staying awake, with the effects for chronic and episodic depressive symptoms roughly comparable in size. Predictably, longer duration of sleep, both for L1 and L2, was associated with lower odds of hypersomnia.
Comment
The purpose of this research was to explore whether stress and depression are predictive of sleep quantity and quality in a longitudinal survey sample of 2-year college students. In addition, we examined the different impacts of episodic stress and depression as well as chronic stress and depression on sleep problems. Notably, the 2-year college students in our sample reported an average of 8.4 hours of sleep per night, with 72% reporting at least 8 hours of sleep per night at baseline. These results stand in sharp contrast to sleep findings from other studies of college students, which have found that the majority of students report
getting less than 8 hours of sleep per night.11,50 It is unclear whether this difference in
findings is due to the fact that prior research has primarily focused on 4-year college students or due to some other factor. With regard to sleep quality, nearly one-third of our sample reported some degree of sleep onset insomnia, and nearly 10% reported having more than 3 days a week when they had trouble staying awake. Some degree of sleep deprivation was also reported.
Only age and working status were significant predictors of average sleep quantity, with neither chronic nor episodic stress and depression being significantly associated with sleep duration. Several factors that were previously associated with sleep duration including gender, race, number of children, and BMI, proved to be largely unassociated with both sleep quantity and quality in our sample.
While neither stress nor depression was significant predictor of sleep quantity, both were significant predictors of sleep quality with depression emerging as the more robust predictor of the two. Although episodic stress was individually predictive of some sleep disturbances, it became nonsignificant after accounting for other associated factors in the models. Chronic stress was equally nonpredictive of sleep quality in the combined effects models, with the only exception being that it remained a significant predictor in the model for hypersomnia.
Cohen et al51 hypothesized that stress was a predictor of sleep via depression. This
mediation effect was not examined in this research and is worthy of future study. Furthermore, sleep quality emerging as a significant outcome in our sample parallels a recent article by Ridner and colleagues that found that sleep quality was the strongest
predictor of well-being among college students.52 Ridner called for interventions to promote
sleep quality as a means of improving well-being in this population.52 Our results add to this
body of literature by exploring the determinants that affect sleep quality and therefore influence well-being among college students.
Our results suggest that both episodic and chronic depression were related to sleep quality.
Concordant with past research,50,51,53 we found that chronic depressive symptoms were
A
uthor Man
uscr
ipt
A
uthor Man
uscr
ipt
A
uthor Man
uscr
ipt
A
uthor Man
uscr
especially predictive of sleep problems, consistent with the evidence that depression exerts a direct effect on sleep behaviors. It is important to note that although episodic depressive factors were also significant predictors of sleep quality, the effect sizes for chronic factors were generally larger. Therefore, 2-year college students and other young adults
experiencing chronic depression may especially benefit from sleep-related behavioral interventions as they are especially vulnerable to sleep problems and related adverse health outcomes.
Our study found that greater depressive symptoms were associated with sleep problems. Whether depressive symptoms cause sleep problems remains unclear as the current evidence on the directionality of this association is mixed. For example, a study by Moo-Estrella et
al23 reported that participants who suffered from low sleep quality were at greater risk of
developing depressive symptoms than participants who reported better sleep quality. Wilson
et al8 found that sleep problems were associated with almost three times greater risk of
depression than good sleep habits. More works exploring the causal associations between negative affect, depression, and sleep are needed.
Notably, our research did not find that BMI was related to sleep quantity or sleep quality. Research with 4-year college students has found an association between obesity and sleep,
especially for clinically obese individuals.54,55 Indeed, obese individuals are more likely to
suffer from sleep apnea that disturbs sleep patterns, suggesting that obesity causes sleep problems; however, it is equally likely that those who suffer from sleep problems also may consume more calories by virtue of being awake for more hours of the day and may expend fewer calories (since they are too tired to be physically active), suggesting that poor sleep
may be a causative factor in obesity.56 Additionally, hormones may be influencing the
relationship between sleep, weight, and affect.57 In our sample, the fact that more than half
of our sample was at a healthy weight may explain the lack of influence on BMI on sleep quantity and quality. Further research is needed to explore this complex issue.
Limitations
Our findings are constrained by a few limitations. First, all psychosocial and behavioral variables were assessed using self-report instruments (eg, CESD-10, sleep quantity/quality). Although the measures exhibited good internal reliability and predictive validity as well as having been successfully used in past research, they are still subject to potential reporting biases. Second, although this study was conducted over a 2-year period, data collection on sleep, stress, and depression was limited to only four time periods. Data at more time intervals would permit a more nuanced examination of changes in stress and depression and their association with sleep. Third, a comprehensive measure of electronic media use was not administered as part of this study. Research suggests that electronic media, especially use of smart phones and other hand held electronic devices, may be an important factor
related to sleep patterns for adolescents and young adults.58,59 As such, future sleep research
with college students would benefit from detailed studies of the role electronic media on poor sleep. Finally, external validity is limited as these data were collected on a limited number of 2-year college students in a single geographical area. Despite these limitations, this study provides an important contribution to the sleep, depression, and stress literatures,
A
uthor Man
uscr
ipt
A
uthor Man
uscr
ipt
A
uthor Man
uscr
ipt
A
uthor Man
uscr
especially with regard to elucidating the primary risk factors associated with sleep problems in young adult populations.
Conclusions
This study is unique in its use of a sample of 2-year college students to explore the links between stress, depression, and sleep. Two-year college students have been seldom studied in the college student health literature, an important omission given that they are exposed to different environmental pressures as compared to traditional college students. Gaining further insight into the unique characteristics of 2-year college students helps inform future sleep-related interventions with this group.
Our study shows the importance of assessing not only sleep duration but also sleep quality in studies of sleep and mental and physical health. In the current study, we found sleep quality to be a more meaningful measure of sleep problems as compared to sleep quantity. It may be that because our sample reported more than 8 hours of sleep per night that there was
insufficient level of variability to detect differences using the predictors that we examined. However, it is also possible that certain groups may generally obtain a sufficient amount of sleep per night, but due to various co-occurring health issues such as poor mental health, are reporting poorer sleep quality. Research methodology for more objectively assessing sleep outside of clinic settings continues to evolve and may be helpful in further unpacking the association between poor mental health and sleep problems.
As for practice implications of our research, our findings suggest that 2-year college administrators need to continue to address levels of both chronic and episodic stress and depression that their students experience. A social policy organization Manpower Demonstration Research Corporation (MDRC), recently conducted focus groups of
community college students who confirmed that home, work, and school were major sources
of stress.60 Although most 2-year colleges offer personal counseling services to address
student stress and mental well-being, 2-year college students may be reluctant or unable to
seek out these services, which may be, in part, due to time constraints32,60 and perceived
mental health stigma.61,62 A qualitative study by Karp and colleagues further show that
while 2-year colleges have student support services, only students who attend the university with pre-existing social and cultural capital take advantage of these services, thereby
unintentionally perpetuating and legitimizing structural disadvantage.63 Given these issues,
both 2-year and 4-year college health professionals should consider investing greater resources in disseminating health information related to stress, depression, and sleep problems as well as improving accessibility and visibility of mental health services.
Acknowledgments
The authors thank the students and the staff at Anoka-Ramsey Community College, Inver Hills Community College, and St. Paul College for the support and help with this project.
Funding
This research was supported through a grant from NHLBI (1 U01 HL096767-01: Leslie A. Lytle, Principal Investigator).
A
uthor Man
uscr
ipt
A
uthor Man
uscr
ipt
A
uthor Man
uscr
ipt
A
uthor Man
uscr
References
1. Colten, HR., Altevogt, BM., editors. Sleep Deprivation: An Unmet Public Health Problem. National Academies Press; Washington, DC: 2006. p. 424
2. Pilcher JJ, Ginter DR, Sadowsky B. Sleep quality versus sleep quantity: relationships between sleep and measures of health, well-being and sleepiness in college students. J Psychosom Res. 1997; 42:583–596. [PubMed: 9226606]
3. Healthy People. [Accessed October 2, 2014] Sleep health. 2014. Available at: http:// www.healthypeople.gov/2020/topics-objectives/topic/sleep-health
4. Augner C. Associations of subjective sleep quality with depression score, anxiety, physical symptoms and sleep onset latency in students. Cent Eur J Public Health. 2011; 19:115–117. [PubMed: 21739905]
5. Cappuccio FP, Taggart FM, Kandala N-B, et al. Meta-analysis of short sleep duration and obesity in children and adults. Sleep. 2008; 31:619–626. [PubMed: 18517032]
6. Jackson ML, Sztendur EM, Diamond NT, et al. Sleep difficulties and the development of depression and anxiety: a longitudinal study of young Australian women. Arch Womens Ment Health. 2014; 17:189–198. [PubMed: 24647705]
7. Van Cauter E, Knutson KL. Sleep and the epidemic of obesity in children and adults. Eur J Endocrinol. 2008; 159(suppl 1):S59–S66. [PubMed: 18719052]
8. Wilson KT, Bohnert AE, Ambrose A, et al. Social, behavioral, and sleep characteristics associated with depression symptoms among undergraduate students at a women’s college: a cross-sectional depression survey, 2012. BMC Womens Health. 2014; 14:8. [PubMed: 24410897]
9. Thomson CA, Morrow KL, Flatt SW, et al. Relationship between sleep quality and quantity and weight loss in women participating in a weight-loss intervention trial. Obesity. 2012; 20(7):1419– 1425. [PubMed: 22402738]
10. Guidolin M, Gradisar M. Is shortened sleep duration a risk factor for overweight and obesity during adolescence? A review of the empirical literature. Sleep Med. 2012; 13(7):779–786. [PubMed: 22633283]
11. Lund HG, Reider BD, Whiting AB, et al. Sleep patterns and predictors of disturbed sleep in a large population of college students. J Adolesc Health. 2010; 46:124–132. [PubMed: 20113918] 12. Brooks PR. Sleep patterns and symptoms of depression in college students. Coll Stud J. 2009;
43:464–472.
13. Hershner SD, Chervin RD. Causes and consequences of sleepiness among college students. Nat Sci Sleep. 2014; 6:73–84. [PubMed: 25018659]
14. Owens J. Insufficient sleep in adolescents and young adults: an update on causes and consequences. Pediatrics. 2014; 134(3):e921–e932. [PubMed: 25157012]
15. Taylor DJ, Bramoweth AD, Grieser EA, et al. Epidemiology of insomnia in college students: relationship with mental health, quality of life, and substance use difficulties. Behav Ther. 2013; 44(3):339–348. [PubMed: 23768662]
16. Clark CM, Nguyen DT, Barbosa-Leiker C. Student perceptions of stress, coping, relationships, and academic civility: a longitudinal study. Nurse Educ. 2014; 39(4):170–174. [PubMed: 24813939] 17. Carney CE, Edinger JD, Meyer B, et al. Daily activities and sleep quality in college students.
Chronobiol Int. 2006; 23:623–637. [PubMed: 16753946]
18. Nyer M, Farabaugh A, Fehling K, et al. Relationship between sleep disturbance and depression, anxiety, and functioning in college students. Depression Anxiety. 2013; 30(9):873–880. [PubMed: 23681944]
19. Chang PP, Ford DE, Mead LA, et al. Insomnia in young men and subsequent depression The Johns Hopkins Precursors Study. Am J Epidemiol. 1997; 146:105–114. [PubMed: 9230772]
20. Jansson-Fröjmark M, Lindblom K. A bidirectional relationship between anxiety and depression, and insomnia? A prospective study in the general population. J Psychosom Res. 2008; 64:443– 449. [PubMed: 18374745]
A
uthor Man
uscr
ipt
A
uthor Man
uscr
ipt
A
uthor Man
uscr
ipt
A
uthor Man
uscr
21. Johnson EO, Roth T, Breslau N. The association of insomnia with anxiety disorders and depression: Exploration of the direction of risk. J Psychiatr Res. 2006; 40:700–708. [PubMed: 16978649]
22. Millman RP. Excessive sleepiness in adolescents and young adults: causes, consequences, and treatment strategies. Pediatrics. 2005; 115:1774–1786. [PubMed: 15930245]
23. Moo-Estrella J, Pérez-Benítez H, Solís-Rodríguez F, et al. Evaluation of depressive symptoms and sleep alterations in college students. Arch Med Res. 2005; 36:393–398. [PubMed: 15950081] 24. Child Trends Databank. [Accessed March 14, 2015] Young adult depression. 2011. Available at:
http://www.childtrends.org/?indicators=young-adult-depression
25. NIMH. [Accessed March 14, 2015] Depression and college students. 2011. Available at: http:// www.nimh.nih.gov/health/publications/depression-and-college-students/index.shtml
26. Shanahan L. Child-, adolescent- and young adult-onset depressions: Differential risk factors in development? Psychol Med. 2012; 41(11):2265.
27. Tsai LL, Li SP. Sleep patterns in college students: gender and grade differences. J Psychosom Res. 2004; 56:231–237. [PubMed: 15016583]
28. Yang CM, Hung CY, Lee HC. Stress-related sleep-vulnerability and maladaptive sleep beliefs predict insomnia at long-term follow-up. J Clin Sleep Med. 2014; 10:997–1001. [PubMed: 25142760]
29. Lee S-Y, Wuertz C, Rogers R, et al. Stress and sleep disturbances in female college students. Am J Health Behav. 2013; 37:851–858. [PubMed: 24001634]
30. Sawatzky RG, Ratner Pa, Richardson CG, et al. Stress and depression in students: the mediating role of stress management self-efficacy. Nurs Res. 2012; 61:13–21. [PubMed: 22166906] 31. Hammen C. Stress and depression. Annu Rev Clin Psychol. 2005; 1(1):293–319. [PubMed:
17716090]
32. Cooper M. Student support services at community colleges: A strategy for increasing student persistence and attainment. The White House Summit on Community Colleges. 2010:22. 33. Eliasson AH, Lettieri CJ, Eliasson AH. Early to bed, early to rise! Sleep habits and academic
performance in college students. Sleep Breath. 2010; 14(1):71–75. [PubMed: 19603214] 34. Knowlden AP, Sharma M. Health belief structural equation model predicting sleep behavior of
employed college students. Fam Community Health. 2014; 37(4):271–278. [PubMed: 25167067] 35. AACC. [Accessed October 2, 2014] Students at community colleges. 2014. Available at:
www.aacc.nche.edu/AboutCC/Trends/Pages/studentsatcommunitycolleges.aspx
36. NCES. [Accessed March 7, 2015] Postsecondary education: characteristics of postsecondary students. May. 2016 Available at: https://nces.ed.gov/programs/coe/indicator_csb.asp
37. Laska MN, Pasch KE, Lust K, et al. The differential prevalence of obesity and related behaviors in two–vs. four–year colleges. Obesity. 2011; 19(2):453–456. [PubMed: 20966910]
38. Lytle LA, Moe S, Nanney M, et al. Designing a weight gain prevention trial for young adults: the CHOICES study. Am J Health Educ. 2014; 45:67–75. [PubMed: 24910855]
39. CESD-R. [Accessed September 20, 2014] CESD-R explanation. 2013. Available at: http://cesd-r.com/
40. Radloff LS. The CES-D scale: a self-report depression scale for research in the general population. Appl Psychol Meas. 1977; 1:385–401.
41. Andresen EM, Malmgren JA, Carter WB, et al. Screening for depression in well older adults: evaluation of a short form of the CES-D (Center for Epidemiologic Studies Depression Scale). Am J Prev Med. 1994; 10:77–84. [PubMed: 8037935]
42. Cohen S, Kamarck T, Mermelstein R. A global measure of perceived stress. J Health Soc Behav. 1983; 24:385–396. [PubMed: 6668417]
43. Ng DM, Jeffery RW. Relationships between perceived stress and health behaviors in a sample of working adults. Health Psychol. 2003; 22:638–642. [PubMed: 14640862]
44. Pruessner J, Hellhammer D, Kirschbaum C. Burnout, perceived stress, and cortisol responses to awakening. Psychosom Med. 1999; 61:197–204. [PubMed: 10204973]
45. NCI. [Accessed September 20, 2014] TREC overview. 2014. Available at: http:// www.trecscience.org/trec/bin/about/overview.aspx?j=21%20
A
uthor Man
uscr
ipt
A
uthor Man
uscr
ipt
A
uthor Man
uscr
ipt
A
uthor Man
uscr
46. Buysse DJ, Reynolds CF, Monk TH, et al. The Pittsburgh sleep quality index: a new instrument for psychiatric practice and research. Psychiatry Res. 1989; 28:193–213. [PubMed: 2748771] 47. DeMartini KS, Fucito LM. Variations in sleep characteristics and sleep-related impairment in
at-risk college drinkers: a latent profile analysis. Health Psychol. 2014; 33:1164–1173. [PubMed: 25133844]
48. Lytle LA. Examining the etiology of childhood obesity: the idea study. Am J Community Psychol. 2009; 44:338–349. [PubMed: 19838791]
49. Curran, PJ., Bauer, DJ. The disaggregation of within-peron and between-person effects in
longitudinal models of change. In: Fiske, ST.Schacter, DL., Taylor, SE., editors. Annual Review of Psychology. Palo Alto: Annual Reviews; 2011. p. 583-619.
50. Breslau N, Roth T, Rosenthal L, et al. Daytime sleepiness: an epidemiological study of young adults. Am J Public Health. 1997; 87(10):1649–1653. [PubMed: 9357347]
51. Cohen S, Janicki-Deverts D, Miller GE. Psychological stress and disease. JAMA. 2007; 298(14): 1685–1687. [PubMed: 17925521]
52. Ridner SL, Newton KS, Staten RR, et al. Predictors of well-being among college students. J Am College Health. 2016; 64(2):116–124.
53. Bixler E, Vgontzas A, Lin H-M, et al. Excessive daytime sleepiness in a general population sample: the role of sleep apnea, age, obesity, diabetes, and depression. J Clin Endocrinol Metab. 2005; 90(8):4510–4515. [PubMed: 15941867]
54. Kahlhofer J, Karschin J, Breusing N, et al. Relationship between actigraphy-assessed sleep quality and fat mass in college students. Obesity. 2016; 24(2):335–341. [PubMed: 26704169]
55. Kalak N, Brand S, Beck J, et al. Association between subjective actual sleep duration, subjective sleep need, age, body mass index, and gender in a large sample of young adults. Neuropsychiatr Dis Treat. 2015; 11:107–113. [PubMed: 25657583]
56. Li C, Ford ES, Zhao G, et al. Prevalence of self-reported clinically diagnosed sleep apnea
according to obesity status in men and women: National Health and Nutrition Examination Survey, 2005–2006. Prev Med. 2010; 51(1):18–23. [PubMed: 20381517]
57. Taheri S. The link between short sleep duration and obesity: we should recommend more sleep to prevent obesity. Arch Dis Child. 2006; 91(11):881–884. [PubMed: 17056861]
58. Exelmans L, Van den Bulck J. Bedtime mobile phone use and sleep in adults. Soc Sci Med. 2016; 148:93–101. [PubMed: 26688552]
59. Hysing M, Pallesen S, Stormark KM, et al. Sleep and use of electronic devices in adolescence: results from a large population-based study. BMJ Open. 2015; 5(1):1–7.
60. Bloom D, Sommo C. Building learning communities: early results from the Opening Doors demonstration at Kings-borough Community College. MDRC. 2005:84.
61. Fortney JC, Curran GM, Hunt JB, et al. Prevalence of probable mental disorders and help-seeking behaviors among veteran and non-veteran community college students. Gen Hosp Psychiatry. 2016; 38(1):99–104. [PubMed: 26598288]
62. Michaels PJ, Corrigan PW, Kanodia N, et al. Mental health priorities: stigma elimination and community advocacy in college settings. J College Stud Dev. 2015; 56(8):872–875.
63. Karp, MM., O’Gara, L., Hughes, KL. CCRC Working Paper No. 10. Community College Research Center, Columbia University; 2008. Do Support Services at Community Colleges Encourage Success or Reproduce Disadvantage? An Exploratory Study of Students in Two Community Colleges.
A
uthor Man
uscr
ipt
A
uthor Man
uscr
ipt
A
uthor Man
uscr
ipt
A
uthor Man
uscr
A
uthor Man
uscr
ipt
A
uthor Man
uscr
ipt
A
uthor Man
uscr
ipt
A
uthor Man
uscr
ipt
Table 1
Baseline sample demographics, N = 441.
n (%) or M ± SD
Age at baseline, years 22.8 ± 5.0
Female 298 (68%)
Race
Black or African-American 68 (15%)
American Indian or Alaskan Native 2 (1%)
Asian 27 (6%)
White or Caucasian 320 (73%)
Native Hawaiian or other Pacific Islander 1 (0%)
Other race 23 (5%)
Body mass index (BMI)
BMI group
Normal weight 235 (53%)
Overweight 145 (33%)
Obese 61 (14%)
Employment status
Not currently working 104 (24%)
Part time, 1–19 hours per week 149 (34%)
Half time, 20–39 hours per week 145 (33%)
Full time, 40 hours per week 25 (6%)
More than full time, >40 hours per week 17 (4%)
Household income
< $12,000 292 (71%)
$12,000–$24,999 78 (19%)
$25,000–$50,000 35 (8%)
≥ $50,000 6 (2%)
Relationship status
Single, never married 240 (55%)
Unmarried, in a committed relationship 133 (30%)
Married 61 (14%)
Separated or divorced 6 (1%)
Number of children
0 324 (80%)
1 31 (8%)
2 25 (6%)
3+ 25 (6%)
Study condition
Control group 217 (49%)
Intervention group 224 (51%)
A
uthor Man
uscr
ipt
A
uthor Man
uscr
ipt
A
uthor Man
uscr
ipt
A
uthor Man
uscr
ipt
n (%) or M ± SD
Perceived Stress Scale 2.35 ± .66
Average hours of sleep per night 8.4 ± 1.2
Sleep deprivation (0 = 0 nights; 1 = 1–6 nights; 2 = 7–13 nights; 3 = 14–20 nights; 4 = 21–27 nights; 5 = 28–30 nights) 1.8 ± 1.1
Sleep onset insomnia
<3 nights per week, takes >30 minutes to fall asleep 314 (71%)
≥3 nights per week, takes >30 minutes to fall asleep 127 (29%)
Hypersomnia
<3 days per week, have trouble staying awake 407 (92%)
A
uthor Man
uscr
ipt
A
uthor Man
uscr
ipt
A
uthor Man
uscr
ipt
A
uthor Man
uscr
ipt
T ab le 2 Multile vel model results predicting self-reported hours sleep per night and sleep depri
v
ation.
Pr
edictor
P
ast 30 days
P
ast 30 days
Hours of sleep per night
Sleep depri
v
ation
c
Inter
cept-only & Main Effects Models
a
Final Model
Inter
cept-only & Main Effects Models
a Final Model b SE b SE b SE b SE Intercept 8.34 *** 0.04 8.82 *** 0.11 1.73 *** 0.04 3.18 *** 0.38
Age in years
−0.04 *** 0.008 −0.04 *** 0.01 −0.01 0.01 −0.02 * 0.01 Interv
ention (0 = control group; 1 = interv
ention group) 0.09 0.08 0.09 0.08 0.03 0.08 0.02 0.07
Gender (0 = female; 1 = male)
−0.11 0.09 −0.09 0.09 −0.10 0.09 −0.15 † 0.08
Race (0 = ethnic minority group member; 1 = white)
−0.06 0.10 0.20 * 0.10 0.22 * 0.09
Number of children
−0.02
0.06
0.06
0.06
W
orking status Work
L1 −0.14 *** 0.03 −0.14 *** 0.03 0.04 0.03 W ork L2 −0.16 ** 0.05 −0.15 ** 0.05 0.08 0.05
Body mass inde
x (BMI) b BMI L1 0.02 0.02 0.002 0.02 BMI L2 −0.003 0.01 0.003 0.02
Center for Epidemiologic Studies Depression Scale (CESD)
b
Episodic Depression (CESD)
L1 −0.11 0.09 0.47 *** 0.07 0.47 *** 0.07
Chronic Depression (CESD)
L2 −0.01 0.11 0.81 *** 0.11 0.81 *** 0.10 Percei v
ed Stress Scale (PS)
b Episodic PS L1 −0.09 0.05 0.23 *** 0.05 Chronic PS L2 0.10 0.08 0.30 *** 0.07 A v
erage hours of sleep per night
b Sleep L1 . . . . −0.21 *** 0.02 −0.21 *** 0.02 Sleep L2 . . . . −0.24 *** 0.04 −0.24 *** 0.04
Intraclass correlation (ICC)
.33
A
uthor Man
uscr
ipt
A
uthor Man
uscr
ipt
A
uthor Man
uscr
ipt
A
uthor Man
uscr
ipt
Note. † p
≤ .07;
* p
< .05,
** p
< .01
***
p
< .0001;
L1
v
ariable w
as person-mean centered, yielding a Le
v
el 1 ef
fect;
L2
v
ariable w
as grand-mean centered, yielding a Le
v
el 2 ef
fect;
a Each main ef
fect tested indi
vidually with the linear time ef
fect (ie, age in years).
b All repeated measures parsed into within-person (L1) and between-person (L2) ef
fects were tested as blocks in the models.
c Model estimates predict day count based on 1-week increments—see T
A
uthor Man
uscr
ipt
A
uthor Man
uscr
ipt
A
uthor Man
uscr
ipt
A
uthor Man
uscr
ipt
T ab le 3 Multile vel model results predicting odds of self-reported sleep onset insomnia and h
ypersomnia.
Pr
edictor
On av
erage
Sleep onset insomnia
P
ast w
eek
Hypersomnia
Inter
cept-only and main effects models
a
Final Model
Inter
cept-only and main effects models
a Final Model OR SE OR SE OR SE OR SE Intercept 0.32 *** 0.09 0.15 *** 0.29 0.10 *** 0.10 0.12 1.16
Age in years
0.96 † 0.02 0.97 0.20 0.91 * 0.02 0.95 0.02 Interv ention (0 =
control group; 1
= interv ention group) 1.31 0.18 1.30 0.19 0.77 0.19 0.77 0.20 Gender (0 = female; 1 = male) 0.98 0.20 0.95 0.21 1.41 0.20 1.40 0.21 Race (0 =
ethnic minority group member; 1
= White) 0.73 0.21 1.04 0.22
Number of children
1.08
0.12
0.77
0.17
W
orking status Work
L1 0.81 * 0.08 0.81 * 0.09 1.14 0.11 W ork L2 0.79 * 0.11 0.80 † 0.12 1.10 0.11
Body mass inde
x (BMI) b BMI L1 1.03 0.05 1.02 0.07 BMI L2 1.02 0.02 1.02 0.02
Center for Epidemiologic Studies Depression Scale (CESD)
b
Episodic Depression (CESD)
L1 3.30 *** 0.19 3.30 *** 0.19 3.34 *** 0.26 2.94 ** 0.36
Chronic Depression (CESD)
L2 5.59 *** 0.26 5.60 *** 0.26 4.99 *** 0.24 2.77 ** 0.35 Percei v
ed Stress Scale (PS)
b Episodic PS L1 1.67 *** 0.12 2.06 *** 0.17 1.32 0.23 Chronic PS L2 2.03 *** 0.18 3.12 *** 0.18 1.88 * 0.25 A v
erage hours of sleep per night
b Sleep L1 1.01 0.06 0.68 ** 0.11 0.68 ** 0.11 Sleep L2 0.99 0.11 0.78 * 0.13 0.76 * 0.13
Intraclass correlation (ICC)
.35
.20
A
uthor Man
uscr
ipt
A
uthor Man
uscr
ipt
A
uthor Man
uscr
ipt
A
uthor Man
uscr
ipt
† p
≤ .07;
* p
< .05,
** p
< .01,
***
p
< .0001;
L1
v
ariable w
as person-mean centered, yielding a Le
v
el 1 ef
fect;
L2
v
ariable w
as grand-mean centered, yielding a Le
v
el 2 ef
fect;
a Each main ef
fect tested indi
vidually with the linear time ef
fect (ie, age in years).
b All repeated measures parsed into within-person (L1) and between-person (L2) ef
fects were tested as blocks in the models.
c Model estimates predict day count based on 1-week increments—see T