BIOMARKERS IN ESTROGEN RECEPTOR-POSITIVE BREAST CANCER AND THE EFFECT OF EXPOSURE HISTORY
Halei Collette Benefield
A dissertation submitted to the faculty at the University of North Carolina at Chapel Hill in partial fulfillment of the requirements for the degree of Doctor of Philosophy in the Department of Epidemiology in the
Gillings School of Global Public Health.
Chapel Hill 2019
© 2019
ABSTRACT
Halei Collette Benefield: Biomarkers in Estrogen Receptor-Positive Breast Cancer and the Effect of Exposure History
(Under the direction of Melissa Troester)
Background: Estrogen receptor (ER) is an important prognostic and predictive biomarker in breast cancer. Some features of ER, such as quantitative and spatial heterogeneity, have had limited study in relation to recurrence and exposure history among black and white women. These measures also have not been thoroughly investigated in context of intrinsic breast cancer subtype.
Methods: This project had three aims 1) to evaluate ER percent positivity, ESR1 gene
expression, and ER intratumoral/spatial heterogeneity in association with recurrence among women with ER-positive breast cancer and test for modification by race 2) to investigate high-risk molecular features in ER-positive disease (luminal B intrinsic subtype, high ROR-PT score, low ER percent positivity) and risk of recurrence, stratified by race and 3) to measure the association of postmenopausal hormone therapy (HT), oral contraceptives (OC), cigarette smoking, and alcohol use with tumor ER expression and multigene risk scores.
Results: For Aim 1 a total of 175 recurrences were identified among 1,775 nonmetastatic women over a median follow-up of 6.7 years (range = 0.4 to 10.0). Lower quantitative ER percent positivity and lower intratumoral heterogeneity were significantly associated with recurrence risk, adjusted for age and race. After adjusting for clinical covariates, quantitative ER and intratumoral heterogeneity were
significantly associated with recurrence for black but not white women. In Aim 2, 170 recurrences were identified among 1,775 nonmetastatic women with median follow up 6.7 years (range = 0.4 to 10.0). Racial disparities in ER-positive breast cancer recurrence persisted among women with luminal B
positivity. No significant associations were seen for smoking or OC use.
ACKNOWLEDGEMENTS
I would first like to express my sincere gratitude to the participants and staff of the Carolina Breast Cancer Study. I would also like to thank Dr. Melissa Troester for her invaluable support,
TABLE OF CONTENTS
LIST OF TABLES ... xi
LIST OF FIGURES ... xiii
LIST OF ABBREVIATIONS... xiv
LIST OF SYMBOLS ... xvi
CHAPTER 1: BACKGROUND ... 1
1.1 Breast cancer overview ... 1
1.2 Biology of the estrogen receptor ... 2
1.3 ER and breast cancer survival ... 4
1.4 ER and breast cancer etiology ... 7
1.5 Assessment of estrogen receptor in breast tumors ... 8
1.6 Multigene markers in breast cancer ... 10
1.7 Outcome disparities in ER positive breast cancer ... 12
1.8 Exposures and breast tumor biology ... 13
1.9 Significance and study rationale ... 15
CHAPTER 2: SPECIFIC RESEARCH AIMS ... 17
CHAPTER 3: RESEARCH STRATEGY ... 19
3.1 Study design overview ... 19
3.2 Study population ... 19
3.3 Aim 1 ... 20
3.3.1 Data collection ... 20
3.3.2 Exposure assessment ... 21
3.3.3 Outcome assessment ... 24
3.3.5 Statistical analysis ... 25
3.3.6 Power calculations ... 26
3.3.7 Preliminary studies ... 27
3.4 Aim 2 ... 27
3.4.1 Data collection ... 27
3.4.2 Exposure assessment ... 28
3.4.3 Outcome assessment ... 28
3.4.4 Covariate assessment ... 28
3.4.5 Statistical analysis ... 29
3.4.6 Power calculations ... 30
3.5 Aim 3 ... 30
3.5.1 Data collection ... 30
3.5.2 Exposure assessment ... 30
3.5.3 Outcome assessment ... 31
3.5.4 Covariate assessment ... 31
3.5.5 Statistical analysis ... 32
3.5.6 Power calculations ... 32
3.5.7 Preliminary studies ... 32
3.6 Potential limitations and alternative strategies ... 32
3.7 Strengths of study ... 33
CHAPTER 4: ASSOCIATION OF QUANTITATIVE MEASURES OF ESTROGEN RECEPTOR PROTEIN AND RNA WITH EARLY BREAST CANCER RECURRENCE ... 35
4.1 Overview ... 35
4.2 Introduction ... 36
4.3 Methods ... 37
4.3.1 Study population... 37
4.3.2 Clinical characteristics ... 37
4.3.4 Outcome assessment ... 38
4.3.5 Statistical analyses ... 38
4.4 Results ... 41
4.5 Discussion ... 53
CHAPTER 5: OUTCOMES OF HORMONE-RECEPTOR POSITIVE, HER2-NEGATIVE BREAST CANCERS BY RACE AND TUMOR BIOLOGICAL FEATURES ... 56
5.1 Overview ... 56
5.2 Introduction ... 57
5.3 Methods ... 58
5.3.1 Study population... 58
5.3.2 Clinical characteristics ... 58
5.3.3 Genomic assessment ... 59
5.3.4 Outcome assessment ... 59
5.3.5 Statistical analyses ... 59
5.4 Results ... 61
5.5 Discussion ... 70
5.6 Conclusions ... 72
CHAPTER 6: EXPOSURE HISTORY, QUANTITATIVE ER POSITIVITY, AND MULTIGENE RISK SCORES... 73
6.1 Overview ... 73
6.2 Introduction ... 73
6.3 Methods ... 75
6.3.1 Study population... 75
6.3.2 Data collection ... 75
6.4 Results ... 77
6.5 Discussion ... 87
6.6 Conclusions ... 89
CHAPTER 7: DISCUSSION ... 90
7.2 Significance ... 92
7.3 Limitations ... 92
7.4 Future directions ... 93
7.5 Conclusions ... 94
LIST OF TABLES
Table 1.1. Intrinsic subtypes of breast cancer. ... 11
Table 2.1. Epidemiologic exposures and the risk of breast cancer ... 14
Table 3.1. Characteristics of CBCS Phase 3. ... 20
Table 3.2. Expected Aim 1 quantitative ER exposure distribution among study population ... 21
Table 3.3. Aim 1 covariate descriptions ... 25
Table 3.4. Selection bias among eligible CBCS3 participants with no ER data and participants with ER quantity and/or gene expression available... 26
Table 3.5. Aim 2 exposure distribution among study population ... 28
Table 3.6. Aim 2 covariate descriptions ... 28
Table 3.7. Aim 3 exposure description. ... 31
Table 4.1. Characteristics of study population ... 44
Table 4.2. Distribution of intratumoral heterogeneity measures and association with recurrence among study population ... 46
Table 4.3. ER measures overall and by race in study population... 47
Table 4.4. Association between quantitative ER measures and disease-free interval ... 50
Table 4.5. Association between ER and disease-free interval by race ... 51
Table 4.6. Relative excess risk due to interaction and Wald test of modification ... 52
Table 5.1. Characteristics of hormone receptor-positive/HER2- participants in Carolina Breast Cancer Study ... 63
Table 5.2. Standardized1 5-year risk of recurrence, hazard ratios for recurrence risk, and 95% confidence intervals (CI) stratified by race and biological feature ... 64
Table 6.1. Demographics and exposure prevalence among ER-positive tumors in the Carolina Breast Cancer Study... 79
Table 6.2. Mean ROR-PT and Oncotype DX scores among stage I-II postmenopausal women ... 82
Table 6.3. Hormone therapy use and estrogen receptor (ER) expression among postmenopausal ER-positive women in Carolina Breast Cancer Study ... 83
Table 6.5. Alcohol use and estrogen receptor (ER) expression among ER-positive
women in Carolina Breast Cancer Study ... 85 Table 6.6. Smoking and estrogen receptor (ER) expression among ER-positive women in
LIST OF FIGURES
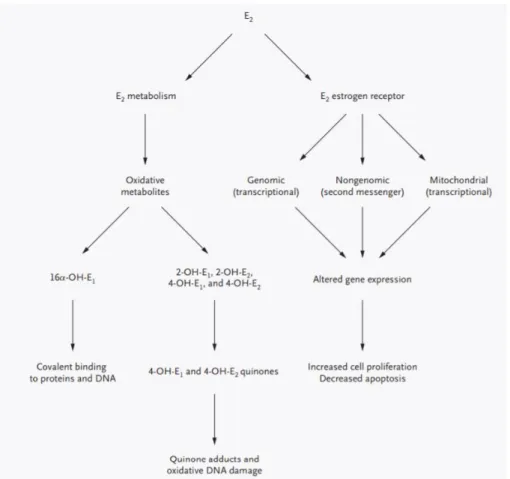
Figure 1.1. Two separate but complementary pathways responsible for estrogen’s
carcinogenicity within the breast. ... 4 Figure 1.2. Kaplan–Meier survival curve showing 10-year overall survival per percentage
staining for estrogen receptors. ... 5 Figure 1.3. Association of quantitative ER with recurrence rate in tamoxifen-treated
versus controls. ... 6 Figure 1.4. ER staining in four cores and tissue from which they were removed, in a case
with heterogenous ER expression. ... 7 Figure 1.5. Average annual age-specific rates stratified by estrogen receptor-positive
(ERP) and -negative (ERN)... 8 Figure 1.6. Quantitative IHC ER by intrinsic subtype. ... 12 Figure 3.1. ESR1 mRNA expression in immunohistochemistry-defined groups. Text on
plot indicates median (interquartile range). ... 27 Figure 4.1. Flowchart for study inclusion ... 43 Figure 4.2. Intratumoral heterogeneity measures in cases with multiple cores in Carolina
Breast Cancer Study Phase 3 ... 45 Figure 4.3. Correlation of ER quantitative and spatial measures in study population ... 48 Figure 4.4. Kaplan-Meier curves for recurrence by ER measure ... 49 Figure 5.1. Standardized1 risk of recurrence among hormone receptor-positive/HER2-
cases stratified by race and ROR-PT (risk of recurrence) score. ... 66 Figure 5.2. Standardized1 risk of recurrence among hormone receptor-positive/HER2-
cases stratified by race and luminal subtype ... 67 Figure 5.3. Standardized1 risk of recurrence among hormone receptor-positive/HER2-
tumors stratified by race and grade ... 68 Supplemental Figure 5.1. Flow diagram for study population. ... 69 Figure 6.1. Relative frequency of low versus high estrogen receptor (ER) percent
positivity by exposure ... 80 Figure 6.2. Patterns of HT use and frequency of low estrogen receptor (ER) percent
LIST OF ABBREVIATIONS
AA African American
AMBER African American Breast Cancer Epidemiology and Risk AO absolute outlyingness
AP absolute platykurtosis
ASCO American Society of Clinical Oncology CAP College of American Pathologists CBCS Carolina Breast Cancer Study CI confidence interval
CPHM Cox proportional hazards models D difference in ER intensity
DX diagnosis
EA European American
ER estrogen receptor ERN ER negative cancers ERP ER positive cancers ESR1 Estrogen receptor 1
ET endocrine therapy
FFPE formalin-fixed paraffin-embedded
fmol/mg femtomoles of receptor protein per mg cytosol protein HER2 human epidermal growth factor receptor 2
HR hazard ratios
HT hormone therapy
IHC immunohistochemical IPW inverse probability weighted IQR Interquartile range
LBA ligand binding assays
NC North Carolina
OC oral contraceptive
qRT-PCR quantitative reverse transcription polymerase chain reaction
REF reference
RERI relative excess risk due to interaction RFD relative frequency differences RNA ribonucleic acid
RO relative outlyingness
ROR-PT PAM50 Risk of Recurrence score ROR-PT risk of recurrence
RP relative platykurtosis
RS recurrence score
RT-PCR reverse-transcription polymerase chain reaction SAS Statistical Analysis System
SD standard deviation
SERDS selective estrogen receptor down-regulators SERMS selective estrogen receptor modulators std standard deviation
TAILORX Trial Assigning Individualized Options for Treatment TMA tumor microarray
LIST OF SYMBOLS
α alpha
β beta
CHAPTER 1: BACKGROUND
1.1 Breast cancer overview
Breast cancer is the most frequently diagnosed malignancy and the leading cause of cancer-related death worldwide. In the United States, breast cancer accounts for over 40,000 deaths annually and more than 266,000 women are diagnosed each year.1 Breast cancer incidence rates have decreased in recent decades; this trend is largely attributed to the saturation of breast cancer screening uptake and the decline of hormone therapy (HT) use, a known risk factor for breast cancer.2 Approximately half of all breast cancer cases can be explained by known risk factors such as age at first birth, age at menarche, and history of proliferative breast disease. Environmental exposures and lifestyle characteristics may also play a role, though these potential risk factors have shown inconsistent associations with breast cancer. Around 10% of breast cancer cases are attributable to positive family history.
The US Preventative Services Task Force recommends biennial mammogram screening for women aged 50 to 74 years.3 The majority of breast cancers in the US are diagnosed by mammography, and nearly 95% of new diagnoses are non-metastatic. Treatment for breast cancer is multimodal, and can involve surgery, radiation, and/or medical oncology. A number of factors are considered in treatment decision-making. In addition to staging by the Tumor, Node, Metastasis (TNM) system, tumors are routinely assessed for hormone receptors and human epidermal growth factor receptor 2 (HER2), the presence or absence of which can help identify patients who may benefit from systemic regimens such as endocrine therapy or chemotherapy. Patient factors like age, race, and cigarette smoking are also
considered in assessment of prognosis. Finally, gene expression profiles, such as the MammaPrint® (Agendia Inc, Irvine, California) and Oncotype DX® (Genomic Health Inc, Redwood City, California), are increasingly being used to provide additional prognostic and predictive information to guide treatment decision-making.
subtypes are the luminal A and B tumors, which comprise the majority of breast cancer cases and carry the best prognosis. Despite this, most breast cancer deaths are caused by luminal tumors, and the largest disparities in outcome by race occur in these subtypes.6 About 10-15% of breast cancers are human epidermal growth factor receptor 2 (HER2) enriched and the remaining 10-15% are ER-negative subtypes, which include the basal-like and claudin-low subtypes, among others. These latter two subtypes express fewer therapeutic targets and generally carry less favorable prognoses.
1.2 Biology of the estrogen receptor
The estrogen receptor (ER) is a protein found in cells that binds steroid hormones to regulate gene activity. Two isoforms of ER, ER-α and ER-β, have been found in humans. ER-α was the first isoform to be discovered, and the majority of breast cancer literature has described this variant. The clinical significance of ER-β in breast cancer remains unclear, thus the focus of this proposal will henceforth be on ER-α.
ER is found in the cytosol of normal mammary epithelial cells where it serves to mediate cell differentiation, proliferation, and growth. It is activated by estrogen, a lipid-soluble hormone associated with reproductive and gestational physiology. In premenopausal women, the primary source of estrogen is ovarian production, but in postmenopausal women estrogen is peripherally synthesized via an enzyme called aromatase. Upon binding estrogen, ER enters the nucleus and functions as a transcription factor, attaching to DNA binding sites and activating specific gene elements. This leads to the transcription of RNA and synthesis of new proteins to carry out the physiological actions of estrogen.7
The complexity of ER signaling extends to downstream interactions as well. In addition to regulating a multitude of target genes, it has been demonstrated that ER promotes transcription of non-coding RNAs that may act as transcriptional regulators.14, 15 High affinity estrogen binding has been noted in both mitochondria and the cell membrane, and the presence of ER-responsive mitochondrial gene sequences and upregulation of second messengers in response to estrogen stimulation suggest that ER may function in non-nuclear gene regulation as well.16 In sum, the ER pathway is complex and estrogen stimulation causes a large proportion of the breast cancer cell genome to be transcribed through the interaction of ER with dozens of proteins and DNA binding sites.
Two key observations led investigators to associate estrogen exposure with breast cancer risk. First, premenopausal women demonstrated regression of advanced breast cancer following
Figure 1.1. Two separate but complementary pathways responsible for estrogen’s carcinogenicity within the breast.23
1.3 ER and breast cancer survival
ER was first recognized as a predictor of response to endocrine therapy in the early 1970s.24 Perhaps the strongest evidence for ER’s necessity in the initiation and promotion of mammary tumors is the successful implementation of endocrine therapy drugs, all of which interrupt estrogen signaling in some manner. Endocrine therapies are used as adjuvant therapy in the treatment of ER positive breast cancer, meaning they are given in addition to the primary treatment to reduce the risk of recurrence or death, or, in the case of metastatic disease, to palliate symptoms.25
aromatase inhibitors, which are used primarily in postmenopausal women to inhibit the conversion of peripheral androgens to estrogen. Aromatase inhibitors are ineffective in women with intact ovarian function.
Because ER is such an effective therapeutic target, it is unsurprising that ER positive tumors have more favorable outcomes relative to ER negative tumors. However, ER status is also prognostic, meaning it provides information about disease outcome regardless of therapy.26 ER positive tumors are less likely to be associated with pathological features indicative of poor prognosis, such as human epidermal growth factor receptor 2 (HER2) amplification and p53 mutation, and are more likely to be well differentiated, diploid, and have a low fraction of dividing cells.27–30
There is substantial evidence to suggest that it is not merely the presence of ER that carries predictive and prognostic weight. Two features of expression that have demonstrated association with survival are ER quantity and heterogeneity of expression within a tumor. A positive linear relationship between ER quantity, measured as cytosolic concentration using ligand-binding assays, and survival was first reported in 1981.31 Since that initial report, numerous clinical and epidemiological studies have supported an association between quantitative ER and survival.32–37 Figure 1.2 below shows increased overall survival with higher ER as quantified by percent of cells staining positively for protein.
A similar trend has been demonstrated for breast cancer recurrence.38, 39 Figure 1.3 below shows the results of a meta-analysis of 21 clinical trials examining the association between femtomoles of receptor protein per mg cytosol protein (fmol/mg) and recurrence rate of women randomized to tamoxifen treatment and women randomized to control.
Figure 1.3. Association of quantitative ER with recurrence rate in tamoxifen-treated versus controls. ER quantities on left are femtomoles of receptor protein per mg cytosol protein (fmol/mg) and text column on right represents ratio of recurrence rates in tamoxifen-treated women relative to control women.25
In addition to intertumoral variation in degree of ER expression, breast cancers can exhibit spatial variation in ER intensity and distribution within a tumor, as demonstrated in Figure 1.4.40 Termed
Figure 1.4. ER staining in four cores and tissue from which they were removed, in a case with heterogenous ER expression. Note variable staining across the entire sample, which is reflected in the diverse expression in the cores. Percentages are percent cells ER positive.40
1.4 ER and breast cancer etiology
ER is thought to serve as a biomarker of breast cancer etiology due to the fact that breast tumors rely on estrogen for development and progression.44 Epidemiologic studies have demonstrated distinct risk factor profiles for ER positive versus ER negative cancers, raising the question of whether risk factors may contribute to altered ER expression or metabolism.45, 46 For example, some studies have shown alcohol consumption to be more strongly associated with ER positive tumors, with further evidence suggesting that alcohol may stimulate estrogen-related signaling in human breast cancer cells.47–49 However, the effect of this exposure on quantity or distribution of tumor ER has not been evaluated, which could strengthen the mechanistic link between alcohol and cancer etiology and progression.
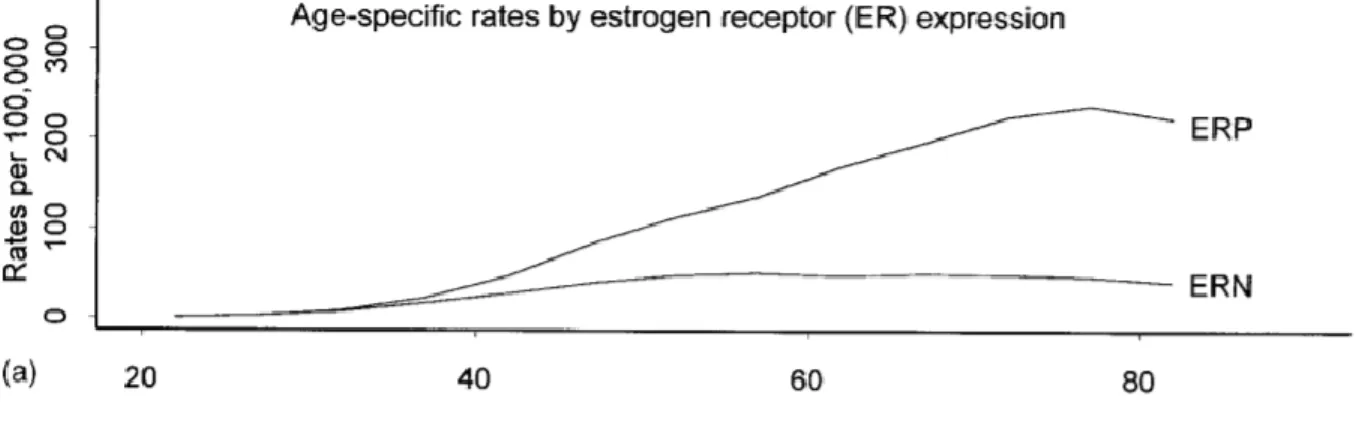
estrogen) while ER negative cancers may be initiated by genetic risk factors and/or do not progress after the removal of possible promotors following menopause. In any case, the different age at incidence curves may represent etiologic heterogeneity by ER status.
Figure 1.5. Average annual agespecific rates stratified by estrogen receptorpositive (ERP) and -negative (ERN).51
1.5 Assessment of estrogen receptor in breast tumors
ER was originally quantified by applying radiolabeled steroid ligand binding assays (LBA) to fresh frozen tissue. Since the early 1990s, these assays have been replaced by immunohistochemical (IHC) assays, which use antibodies linked to colored enzymes to bind ER. ER amount is then semi-quantified according to nuclear staining. ER found in the cell membrane or cytoplasm is thought to represent non-genomic ER signaling, which may contribute to tamoxifen resistance.52 While this staining is valid and important, it is not included in the IHC ER count.
IHC assays are superior to LBA in that they can be performed on a variety of sample types, including paraffin-embedded tumor tissue, and they measure total receptor protein rather than just unbound ER, meaning assay results are not affected by the presence of steroid hormone or tamoxifen. IHC also boasts higher sensitivity and specificity in that it is restricted only to malignant cells under direct visualization, whereas LBA uses tissue homogenate that may be contaminated with adjacent benign tissue. Finally, IHC is less expensive and simpler to perform.
inter-times may reduce sensitivity and different antibodies may recognize different splice variants of the ER protein, making ER quantity difficult to compare between labs. For this reason, the American Society of Clinical Oncology and College of American Pathologists issued guidelines to improve the accuracy of IHC testing of ER in 2010.53
One the most contentious aspects of these latest recommendations was the establishment of a cutoff for ER positive versus ER negative tumors. Current guidelines classify a tumor as ER positive if ≥ 1% of tumor cells uptake nuclear stain for ER protein. Prior guidelines have ranged from 10 – 20%. The current demarcation was chosen in light of evidence that ≥ 1% staining corresponded to measurable response to endocrine therapy.53, 54 However, this guideline was not validated by prospective studies or retrospective review of randomized clinical trials, and there has been considerable debate as to whether this binary cutoff point is ideal.53, 55–57 Tumors with low ER expression, defined as those with 1 – 10% of cells staining positively, have demonstrated prognostic and molecular features more like ER-negative tumors and respond poorly to endocrine therapy.57–60
In addition to spurring new clinical standards, the transition to IHC for ER assessment has led investigators to consider the biologic and clinical significance of the distribution of ER expression. IHC is highly sensitive and produces saturated signals, in part due to the rapid kinetics of the enzymatic detection systems. This results in a bimodal distribution of ER staining, with tumors either completely negative or very positive. Several investigators have proposed that this “all or nothing” dichotomization of ER status is clinically optimal, as it maximizes potential benefit from endocrine therapy by detecting even extremely low levels of ER.61, 62 However, this dichotomization does not reflect the true dynamic range of ER expression, which has been shown to be continuous by LBA and reverse-transcription polymerase chain reaction (RT-PCR).63, 64
decision making. The lack of granularity in IHC is also a significant limitation in studies of ER as a biomarker for breast cancer etiology and progression, as it may obscure true associations.
A final (though this list is not exhaustive) limitation to clinical IHC assessment of ER is that it fails to communicate intratumoral heterogeneity of expression. As seen in Figure 1.4 above, ER may be differentially expressed throughout a tumor. While this phenomenon is detected using IHC, its presence is not typically communicated in pathological reports and it has been largely understudied due to the fact that its clinical relevance has only recently been brought to light (see Section 1.3 above). Digital image analysis or direct pathologist visualization can be used to quantify intratumoral heterogeneity in IHC-stained tissue samples that include multiple cores.43, 66
1.6 Multigene markers in breast cancer
In recent years, the assessment of ER in breast tumors has advanced to include gene expression via mRNA measurement. The molecular and clinical diversity of breast cancer and the vast spectrum of genomic activity involved in the proliferation and differentiation of tumor cells underscores the significance of studying multiple genes in tandem. While the single-gene expression of ER is not routinely examined in breast tumors, it is assessed in the context of clinical genomic assays, which allow simultaneous
measurement of the activity of numerous genes in a tumor biospecimen. Gene expression profiling has revealed distinct subtypes of breast cancer that differ in disease course and response to therapy. These are known as the “intrinsic” subtypes and can be defined by clusters of genes related to ER signaling (luminal cluster), human epidermal growth factor receptor 2 (HER2) expression, proliferation, and genes characteristic of basal epithelial cells.5 These gene clusters are assessed clinically using a 50-gene panel known as the Predictor Analysis of Microarray 50 (PAM50). The PAM50 test identifies a tumor’s intrinsic subtype (see Table 1.1 below) and also generates a Risk of Recurrence (ROR) Score, which can be used to stratify ER-positive tumors into low, medium, and high risk categories. The PAM50 test has
Table 1.1. Intrinsic subtypes of breast cancer.70
Intrinsic subtype Genomic characteristics Prevalence Prognostic features
Luminal A High expression of ER-related genes, low expression of HER2 and proliferation-related genes
40% of all breast cancers
Best prognosis of all breast cancer subtypes Luminal B Expression of ER-related genes
lower relative to Luminal A, variable HER2 expression, and high expression of proliferation-related genes
20% of all breast tumors
Worse prognosis than Luminal A, typically higher ROR score
HER2-enriched High expression of HER2 and proliferation clusters, low expression of luminal (ER signaling) and basal clusters
10 – 15% of all breast tumors
Mixed prognosis; only ~30% of HER2-enriched tumors are also clinically HER2-positive (which are therapeutically targetable) Basal-like Low expression of luminal and
HER2 clusters, high expression of basal cluster
10 – 15% of all breast tumors
Worst prognosis of all subtypes
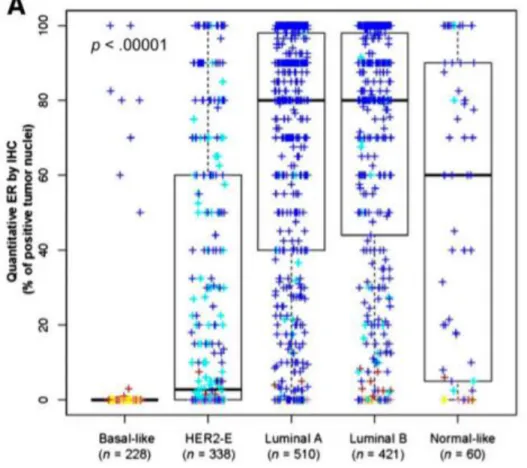
Given the robust molecular characterization and powerful prognostic insight that genomic profiles provide, it is important to consider ER expression and estrogen-related signaling in the context of
Figure 1.6. Quantitative IHC ER by intrinsic subtype. Colors are assigned by clinical hormone receptor and HER2 status; yellow = ER/PR negative, HER2 negative, red = ER/PR 1% - 9%, HER-2 negative, pink = ER/PR negative, HER2 positive, light blue = ER/PR positive, HER2 positive, dark blue = ER/PR
positive, HER2 negative [82].
1.7 Outcome disparities in ER positive breast cancer
To date, one prior study has compared the association between ER quantity and breast cancer survival by race. This study found that increasing percentage of tumor cell nuclei positively stained for ER, measured using IHC, was positively associated with survival in white women (n=426) but not in black women (n=268).79 Importantly, this study included a relatively small number of black women and excluded treatment information, which is critical to consider given that black and white women exhibit significant disparities in access to care.80, 81 In addition to replicating these findings in a larger population with treatment information, it is also important to examine gene expression data, as there is evidence to suggest that ER expression may contribute to differences in tumor biology by race.A study of 1307 European American (EA) and 1365 African American (AA) women examining genes in estrogen biosynthesis, metabolism, and response pathways found that the allele frequencies of 41 of 49 single-nucleotides studied differed by race.82 Another recent comparison of gene transcripts of 24 age- and stage-matched breast tumors of AA and EA women revealed differential expression of genes implicated in estrogen signaling.83
1.8 Exposures and breast tumor biology
Table 2.1. Epidemiologic exposures and the risk of breast cancer
Exposure Low Risk Group High Risk Group Relative Risk
Use of oral contraceptives1
Never users Current users 1.07 – 1.2
Use of hormone therapy (estrogen + progestin)1
Never users Current users 1.2
Alcohol1 None 2 – 5 drinks per day 1.4
Smoking2 Never Current 1.24
1Adapted from Estrogen and the risk of breast cancer. N Engl J Med 2001.84 2Gaudet et al. JNCI 2013.85
Postmenopausal hormone therapy (HT) use is a well-established risk factor for breast cancer.86, 87 Breast cancer incidence has declined following results of the Women’s Heath Initiative trial which
demonstrated increased breast cancer risk in women randomized to HT versus placebo.87 HT is
considered an estrogen agonist, and HT use appears to modify the gene expression profile of ER positive tumors in users versus non-users.88 The impact of HT on tumor phenotype is unclear, though some studies have suggested that HT users have better prognosis tumors and lower risk of recurrence.89, 90
Similar to HT, oral contraceptive (OC) use has also been associated with increased risk for breast cancer, though more modestly.91, 92 Like HT, OC is thought to work as an estrogen agonist to promote cell differentiation and tumor growth. The risk of breast cancer is highest in current or recent users and increases with duration of use. The increased risk appears to persist up to 5 years after discontinuation of use.87
Alcohol is hypothesized to act as both an initiator and promoter of breast cancer through inhibition of DNA synthesis and repair.93 It is also hypothesized to modify estrogen metabolism in women (see section 1.4 above) [98]. It is a known risk factor for breast cancer with a significant dose response with increasing alcohol intake.47–49
higher, rather than lower, circulating estrogen levels than nonsmokers.96 Furthermore, our group has shown that smoking upregulates ESR1 expression in breast tumors.97
Recent evidence has suggested that the increased risk of breast cancer from contemporaneous exposures such as those above may be through tumor subtype.98, 99 While the precise mechanisms by which the above exposures influence tumor biology are not known, studying their effect on ER expression may give further insight, as the ER signaling pathway is critical to tumor progression.
Measuring the association between contemporaneous exposures and tumor ER expression has substantial clinical relevance. First, exposures that modulate ER expression may impact survival outcomes, as ER is the primary therapeutic target for treatment of ER-positive breast cancer. Second, clinical assays Oncotype DX® (Genomic Heath Inc., Redwood City, California) and Prosigna®
(Nanostring Technologies Inc., Seattle, Washington) both include ER gene expression in their algorithms to predict breast cancer recurrence and benefit from chemotherapy. These assays were validated in homogenous patient populations that likely do not represent the wide range of exposure profiles seen in a general population.100, 101 Exposures that contribute to variable ER expression may influence the results of these assays and subsequent treatment decisions.102 As the use of these tests increases, understanding their sensitivity to contemporaneous exposures in a general population becomes increasingly important. Finally, exposures that are found to associate with unfavorable patterns of ER expression may help identify women who are at risk of becoming resistant to endocrine therapy or who may benefit from extended endocrine therapy.
1.9 Significance and study rationale
The current body of evidence suggests clinically relevant biologic heterogeneity within the ER positive subtype that may be important to understanding outcome disparities and interpreting ER as a biomarker. However, prior studies have been limited by small, homogenous study populations and limited measures of ER. We propose to implement robust quantitative and spatial measures of ER and related pathways as well as a consideration of contemporaneous exposure profiles in a large, diverse population of women to improve our understanding of the role of ER status in breast cancer outcomes.
with a limited dynamic range and lack a linear relationship between assay results and actual ER protein content within tumor cells, making them poorly suited for quantifying ER.103–105 Molecular technologies such as real-time quantitative reverse transcription polymerase chain reaction (qRT-PCR) and gene expression microarrays offer the opportunity to refine the assessment of ER expression in tumor samples, and show good correlation with IHC.106 Additionally, digital image analysis technologies can be used to assess intratumoral spatial heterogeneity in ER expression.107, 108 This study will use ribonucleic acid- (RNA-) based measures of ESR1 expression and multigene scores reflecting estrogen receptor signaling pathways, as well as protein-based measures of ER quantity and distribution, to obtain a clearer insight into ER’s role in breast cancer outcome disparities.
This proposal is further strengthened by the unparalleled diversity of its study population and unique combination of observational and biomarker data. The majority of prior studies of breast cancer outcomes and etiology have suffered from small sample sizes of black women. We will address this limitation by including 3,000 breast cancer cases, with nearly 50% of samples from black women from the Carolina Breast Cancer Study (CBCS). CBCS is exceptional in its comprehensive clinical, exposure, and demographic data collected via medical record abstraction and patient interview as well as tumor
CHAPTER 2: SPECIFIC RESEARCH AIMS
Breast cancer is the most frequently diagnosed cancer and the second leading cause of cancer-related death in women.1 Over 70% of all breast tumors overexpress estrogen receptor (ER), a protein which binds estrogen to mediate tumor growth.109 ER is a powerful prognostic indicator and the most reliable predictor of response to endocrine therapy.38, 110–112 Quantity of tumor ER and intratumoral heterogeneity of ER expression have shown associations with breast cancer survival.39, 43, 58, 79 However, these aspects of ER expression are not well captured in traditional clinical assays, which are highly sensitive and suppress the true biological range of expression.103–105 Genomic assays now allow for quantitative assessment of ER gene expression, and digital image analysis can detect intratumoral spatial heterogeneity of ER protein expression.113 It is imperative to use these tools to study how ER expression impacts survival because ER is arguably the most important biological marker and therapeutic target in clinical management of breast cancer.
While previous studies have demonstrated the influence of ER expression on breast cancer outcomes, crucial knowledge gaps remain. First, it is unknown whether the relationship between ER and survival varies between black and white women. The extent to which known variations in ER-positive tumor biology contribute to survival disparities is also unknown. This is important to understand because black women with ER-positive breast cancer demonstrate significantly higher mortality rates than white women, even in randomized clinical trials.6, 74, 114 Second, we have previously shown that smokers and non-smokers have significantly different tumor ER gene expression, but the impact of other
contemporaneous exposures on ER expression remains unexplored.97 Understanding how exposures modulate expression is critical to accurate interpretation of ER as a biomarker.
increasing ER quantity and spatial homogeneity of expression will be associated with better outcomes, particularly in white women, and that exposure history will affect ER expression.
Aim 1: To estimate the association between quantitative measures of ER and recurrence, and
assess for modification by race
We will estimate the association between recurrence and measures of ER, including ER protein expression, ESR1 gene expression and intratumoral heterogeneity of ER expression. We will control for age, stage, grade, node status, treatment regimen, and time to first treatment course and test for modification by race.
Outcome: These results will demonstrate the value of quantitative and spatial ER expression in predicting survival outcomes in a racially diverse patient population.
Aim 2: To examine the contribution of ER-positive tumor molecular features to survival disparities
by race
We will estimate associations between race and recurrence, overall and within molecular subgroups defined by gene expression profiling [PAM50 and risk of recurrence (ROR-PT) score] and quantitative ER protein expression, adjusting for baseline clinical covariates.
Outcome: These results will demonstrate how tumor biology differences promote survival disparities in ER-positive breast cancer.
Aim 3: To evaluate how exposure history impacts quantitative ER and multigene biomarkers that
include ER.
We will estimate the association between oral contraceptive use, hormone therapy use, alcohol use, and cigarette smoking and quantitative ER (ER protein and ESR1 gene expression, intratumoral heterogeneity, ROR-PT score).
CHAPTER 3: RESEARCH STRATEGY
3.1 Study design overview
The proposed study will make use of extant data from the Carolina Breast Cancer Study. To accomplish Aim 1, we will examine the association of quantitative protein- and RNA-based measures of ER with recurrence. IHC and RNA expression data have already been measured in CBCS. Previously collected immunohistochemical data will be used to measure intratumoral heterogeneity. Recurrence data from ongoing follow-up will be used to measure disease-free interval. Aim 2 will investigate the role of high-risk molecular features in recurrence disparities by race in ER positive breast cancer, using data from Aim 1 augmented with multigene measures of tumor biology. To accomplish Aim 3, we will estimate the association between contemporaneous exposures and RNA- and protein-based measures of
quantitative ER using exposure data collected from in-person interview and medical records and quantitative ER measures as described for Aim 1.
This study design is efficient in that in makes extensive use of existing data, allowing for expeditious results and subsequent publications. This study design is also enterprising in that it extends the impact of a study that has already made groundbreaking contributions to our understanding of breast cancer. The study population in CBCS is now contemporary enough to maintain clinical relevance but mature enough to provide robust survivorship data. It is also one of the only existing repositories of epidemiologic and biologic data in a large, racially diverse cohort of women with breast cancer.
3.2 Study population
order to study risk factor differences by age and race, CBCS oversampled young and black women. Information regarding family and personal medical history, reproductive history, smoking, alcohol, diet, medication use and occupational history were obtained through in-person nurse interview. Objective anthropometric measurements were also recorded during interview. FFPE tumor blocks or tumor tissue slides were obtained for biomarker analysis using IHC for protein quantification and tumor microarray (TMA) for RNA expression data. Clinical and pathological data were procured from medical records and pathology reports. Table 3.1 describes Phase 3 of the study population.
The use of CBCS overcomes a major limitation of prior population-based studies of breast cancer by ensuring adequate power to detect differences by race. Furthermore, the use of case ascertainment from the general population will allow for generalizability to women accessing healthcare in the
community.
Table 3.1. Characteristics of CBCS Phase 3.
Characteristic N (%)
Total cases 2998
White 1503 (50)
Black 1495 (50)
< 50 years of age 1492 (50)
> 50 years of age 1506 (50)
ER positive1 2165 (72)
ER negative1 768 (26)
ER borderline1 65 (2)
Patients with IHC data available 2157 (72) Patients with IHC and gene expression
data available
1279 (43) Year of diagnosis
2008 233 (11)
2009 415 (19.)
2010 578 (27)
2011 573 (27)
2012 335 (16)
2013 23 (1)
1 ER Positive = ≥10% positivity by IHC, borderline = 1 – 10%, positive, negative = <1%
3.3 Aim 1
3.3.1 Data collection
ESR1 expression. IHC assays and automated digital analysis have already been performed to quantify ER percent positivity and intensity for each case.
3.3.2 Exposure assessment
For Aim 1, the exposure, ER expression, will be measured in multiple ways: quantitative ER protein, mRNA expression of ESR1 gene, and intratumoral heterogeneity of ER expression. A description of quantitative ER exposures in the study population is shown in Table 3.2 below. ER protein was
assessed using automated digital analysis of immunohistochemical stained tissue microarrays (TMA) constructed from multiple cores (1-8) per case [112]. ER was quantified as percent positivity (range = 0 to 100%) using a tumor cellularity-weighted approach. The weighted average of percent positivity was calculated by summing the product of percent positivity and core weight across all cores per case. Core weight was defined as the number of tumor nuclei in a given core divided by the total number of tumor nuclei across all cores for that case.
ESR1 mRNA expression was assessed from the same tumor specimens used to construct the TMAs, using the Qiagen RNeasy FFPE protocol for RNA extraction and Nanostring assay for
quantification. Quality control and data normalization were performed using the NanostringNorm R package [113]. Data were first normalized to the geometric means of 6 internal positive controls and subsequently to the geometric means of 5 reference genes. Normalized ESR1 counts were log2
transformed, yielding a bimodal Gaussian distribution of the data with log2 expression values ranging from 0 to 15.64 [18].
Table 3.2. Expected Aim 1 quantitative ER exposure distribution among study population
We will explore multiple methods to detect intratumoral heterogeneity of ER expression. We have previously measured ER % positivity in the individual cores of tumor microarrays. Each microarray consists of 1 – 8 cores (each taken from a larger sample from the same patient). Multiple measures from each sample can then be used to compute within-case heterogeneity.
Aim 1 Exposure Expected distribution
ER quantitative measures
IHC percent positivity Range 0 – 100%, Median 67% in ER positive (data not published)
ESR1 Range 0 - 15.64, Median 9.6 [18]
Multigene measures
PAM50 ROR-PT score Mean 29.07, SD 22.87 [114]
For cases indexed by 𝑖 = 1, ⋯ , 𝑛, assume that 𝑑𝑖is the number of measurements made (number of cores), which are labeled 𝑋𝑖𝑗 for 𝑗 = 1, ⋯ , 𝑑𝑖. Since these are percentages 0% ≤ 𝑋𝑖𝑗 ≤ 100%. The sample mean is then calculated as follows:
𝑋̅𝑖= 1
𝑑𝑖∑ 𝑋𝑖𝑗 𝑑𝑖
𝑗=1 = 𝐴𝑣𝑔(𝑋𝑖1, 𝑋𝑖2, ⋯ , 𝑋𝑖𝑑𝑖)
and sample standard deviation 𝑠𝑖= √𝑑𝑖−11 ∑ (𝑋𝑖𝑗−𝑋̅𝑖) 2 𝑑𝑖
𝑗=1 .
The association between survival outcomes and the following heterogeneity measures will be explored and compared. All parameters below are larger for cases which have more heterogenous ER % staining. These measures were calculated for cases with more than two cores in CBCS.
Standard Deviation: this serves as a standard measure of spread and is based on the sample standard deviation, 𝑠𝑖.
𝑆𝐷𝑖= 𝑠𝑖
√4350% .
Centrality: this measure increases as all values approach 50%.
𝐶𝑖= 1
𝑑𝑖∑𝑑𝑖𝑗=1min(𝑋𝑖𝑗,100%−𝑋𝑖𝑗)
50% .
Absolute Outlyingness: This quantifies the distance of a single measurement from all others.
𝐴𝑂𝑖=
max (𝐴𝑣𝑔(𝑋𝑖(2), ⋯ , 𝑋𝑖(𝑑𝑖)) − 𝑋𝑖(1), 𝑋𝑖(𝑑𝑖)− 𝐴𝑣𝑔(𝑋𝑖(1), ⋯ , 𝑋𝑖(𝑑𝑖−1)))
100% .
Relative Outlyingness: This quantifies the distance of a single measurement from all others in relation to the overall spread of measurements.
𝑅𝑂𝑖=
𝐴𝑂𝑖
𝑆𝐷𝑖
.
Absolute Platykurtosis: This quantifies the spread between the two largest and two smallest measurements.
𝐴𝑃𝑖=
{
𝑋𝑖(3)− 𝑋𝑖(1)
100% 𝑓𝑜𝑟 𝑑𝑖= 3
𝐴𝑣𝑔(𝑋𝑖(3), 𝑋𝑖(4)) − 𝐴𝑣𝑔(𝑋𝑖(1), 𝑋𝑖(2))
100% 𝑓𝑜𝑟 𝑑𝑖= 4
Relative Platykurtosis: This quantifies the spread between the two largest and two smallest measurements, in relation to the overall spread of measurements.
𝑅𝑃𝑖=
𝐴𝑃𝑖
𝑆𝐷𝑖
.
To select measures that are not colinear and convey unique information about ER in the study population, we will plot each of the above measures against each other measure and examine the distribution. We will select the measures which qualitatively show a broad, even distribution of values in the study population and are not strongly colinear with one another.
Because the above measures only consider the percent of cells staining positively for ER and are limited to cases with > 2 cores, we will consider an additional measure of intratumoral heterogeneity which incorporates staining intensity and can be measured for cases with any number of cores. Rao’s quadratic entropy (QE, Equation 1 below) has recently been used to measure the association between intratumoral heterogeneity and survival [7]. Rao’s quadratic entropy uses the Simpson index, a measure used in assessment of tumor diversity, together with a distance matrix as weights to quantify intratumor heterogeneity [7, 77]. Proportions in the Simpson index will be defined by the proportion of tumor cells positively stained for ER at intensity levels as assessed by study pathologist (0, 1+, 2+, 3+). The distance matrix is used as weights to reflect the difference in ER intensity (D, below). For instance, a difference between ER intensity 0 and 3+ within a tumor would be weighted as a 3. Rao’s QE will be calculated for each core of each patient tumor and reported as a core-weight average as described above.
Equation 1. Rao’s Quadratic Entropy measure of intratumoral heterogeneity
We will assess the mean, standard deviation, median, interquartile range, minimum, and maximum values of centrality, absolute outlyingness, relative platykurtosis, and Rao’s quadratic entropy in the study
3.3.3 Outcome assessment
For Aim 1, the outcome assessed will be breast cancer recurrence defined as the time from diagnosis of first primary breast cancer to subsequent recurrent breast cancer. Enrollment concluded in 2013 for CBCS and follow-up is ongoing. Recurrence dates have been ascertained via medical record review and follow up with study participants. Survival outcomes have already been successfully assessed in earlier phases of CBCS [15].
3.3.4 Covariate assessment
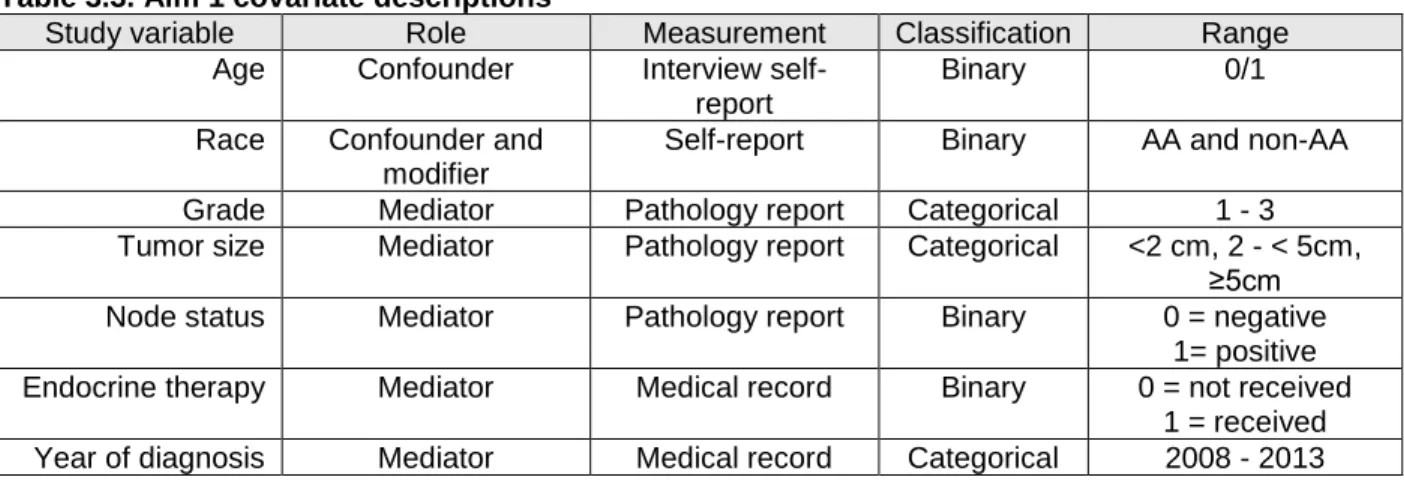
Table 3.3. Aim 1 covariate descriptions
Study variable Role Measurement Classification Range
Age Confounder Interview self-report
Binary 0/1
Race Confounder and modifier
Self-report Binary AA and non-AA Grade Mediator Pathology report Categorical 1 - 3 Tumor size Mediator Pathology report Categorical <2 cm, 2 - < 5cm,
≥5cm Node status Mediator Pathology report Binary 0 = negative
1= positive Endocrine therapy Mediator Medical record Binary 0 = not received
1 = received Year of diagnosis Mediator Medical record Categorical 2008 - 2013
3.3.5 Statistical analysis
We will first examine the distribution of each measure within the study population by comparing medians using Kruskal-Wallis test and comparing distributions of categorical measures using Chi-square tests. We will also examine the correlation of measures by calculating Pearson correlation coefficient for continuous measures and plotting boxplots with median and interquartile range for categorical vs continuous measure.
Each continuous quantitative measure (ER percent positivity, ESR1 RNA, and Rao’s quadratic entropy) will be evaluated separately as a continuous predictor of survival using Cox proportional hazards models (CPHM). First, the proportional hazards assumption will be assessed by testing for a non-zero slope in a generalized linear regression of the scaled Schoenfeld residuals on functions of time and graphical diagnostic of residuals over time [117]. For categorical ER-related measures (PAM50 intrinsic subtype and high, medium, low ROR-PT) proportional hazards assumption will be tested using Kaplan Meier curves for each category of predictor and visually assessing whether the curves are parallel. Cox proportional hazards models will then be used to estimate multivariate hazard ratios (HR) and 95% confidence intervals as a measure of association between each continuous and categorical quantitative ER measure and survival adjusting for relevant clinical characteristics (race, age at diagnosis, stage, lymph node status, treatment regimen, time to first treatment course).
also report race stratified estimates separately for black and white women. Next we will test for
significance of an interaction term of race*ER status in minimally and fully adjusted models using Wald test. Finally, we will calculate the Relative Risk Due to Interaction (RERI) which is HR(Black, High risk ER status) – HR(Black, Low risk ER status) – HR (White, High risk ER status) + 1.
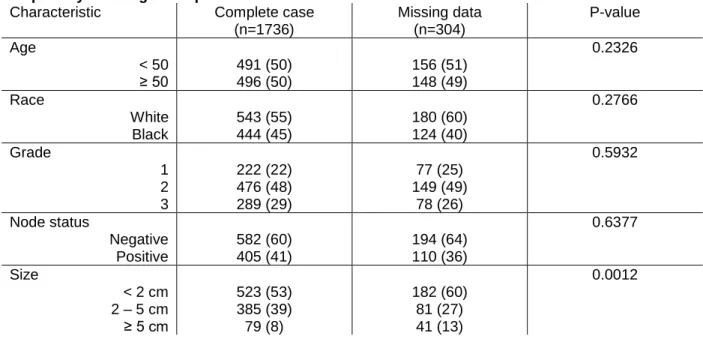
We assessed for selection bias by comparing the demographic and clinical covariate distributions of women who have ER quantity and/or gene expression data available to those who have entirely missing ER biomarker data using Chi-square tests (Table 3.4 below). We found that women with entirely missing ER data tended to have smaller tumors (p=0.0012). This is not unexpected, as sufficient tumor material must be available in order to perform IHC and measure gene expression profiling. However, this selection bias would occur outside of CBCS as well, such that any woman with a tumor too small to assess with standard pathology or gene expression assay would be clinically managed without ER information. Thus, this selection bias is not a threat to the generalizability of our results. Other than tumor size, the final study cohort is not significantly different from the women excluded due to missing ER data.
Table 3.4. Selection bias among eligible CBCS3 participants with no ER data and participants with ER quantity and/or gene expression available
Characteristic Complete case
(n=1736)
Missing data (n=304)
P-value
Age 0.2326
< 50 491 (50) 156 (51)
≥ 50 496 (50) 148 (49)
Race 0.2766
White 543 (55) 180 (60)
Black 444 (45) 124 (40)
Grade 0.5932
1 222 (22) 77 (25)
2 476 (48) 149 (49)
3 289 (29) 78 (26)
Node status 0.6377
Negative 582 (60) 194 (64)
Positive 405 (41) 110 (36)
Size 0.0012
< 2 cm 523 (53) 182 (60)
2 – 5 cm 385 (39) 81 (27)
≥ 5 cm 79 (8) 41 (13)
3.3.6 Power calculations
80% for ER negative disease (n=833) [69]. It also assumes no loss to follow-up and group sizes of 600 (2,998 divided into quintiles of ER expression). Prior studies that have reported differences in survival between low ER and high ER tumors have reported HRs ranging from 0.6 – 0.81 [78, 79]. To detect difference in survival by quintiles of quantitative ER by race, we have 80% power to detect a HR of 0.65. A prior study of survival by quintiles of ER percent positivity by semi-quantitative IHC by race showed HRs ranging from 0.28 to 0.81 [78]. Power calculations were performed in SAS 9.4 (SAS Institute Inc., Cary, NC).
3.3.7 Preliminary studies
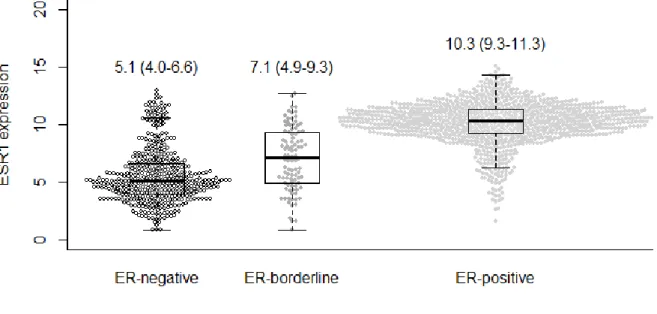
We have recently examined the ESR1 gene expression levels of ER subtypes defined clinically by IHC and found that even among ER positive tumors, a wide range of ESR1 expression values exist, with some tumors showing ESR1 levels commensurate with ER negative tumors (Figure 3.1 below). The significance of these ESR1 values in survival outcomes has yet to be determined, though these results confirm that ESR1 offers a more granular view of ER status than IHC classification.
Figure 3.1. ESR1 mRNA expression in immunohistochemistry-defined groups. Text on plot indicates median (interquartile range).
3.4 Aim 2
3.4.1 Data collection
regression and IPW survival curves. Clinical and treatment data, gene expression profiling, and quantitative ER have already been obtained for cases in CBCS3.
3.4.2 Exposure assessment
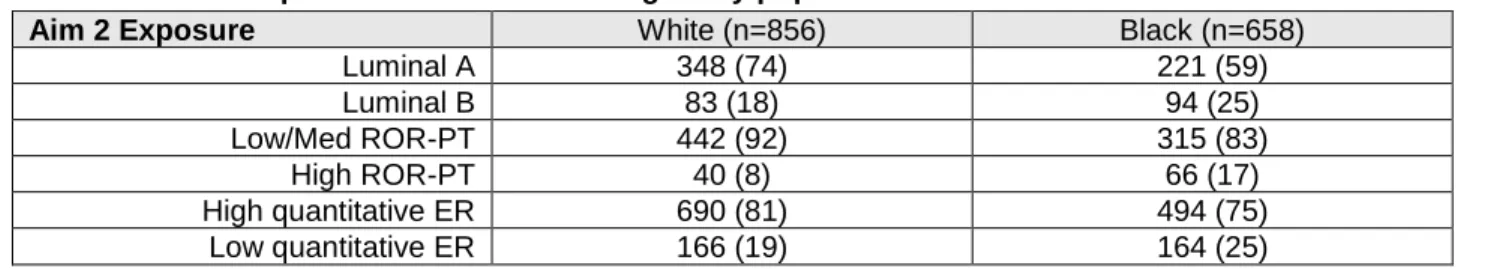
For Aim 2, our exposure will be race, and race jointly stratified by molecular markers of high-risk tumor subtypes. We will compare Luminal B to Luminal A tumors, high ROR-PT to low/medium ROR-PT, and low quantitative ER to high quantitative ER stratified among black and white women.
Table 3.5. Aim 2 exposure distribution among study population
3.4.3 Outcome assessment
For Aim 2, the outcome assessed will be breast cancer recurrence defined as the time from diagnosis of first primary breast cancer to subsequent recurrent breast cancer. Enrollment concluded in 2013 for CBCS3 and follow-up is ongoing. Recurrence dates were ascertained via medical record review and follow up with study participants.
3.4.4 Covariate assessment
For Aim 2, we are interested in variables that may confound, predict, or modify the association between molecular features, race, and recurrence. These include age, tumor grade, node status, and tumor size. For parsimoniously adjusted models we will consider stage a proxy for node status, size, and grade. Variables are described in detail in Table 3.6.
Table 3.6. Aim 2 covariate descriptions
Study variable Role Measurement Classification Range Age Confounder Interview
self-report
Binary 0/1
Grade Mediator Pathology report Categorical 1 – 3 Tumor size Mediator Medical record Binary 1 = < 2 cm
2 = ≥ 2 cm Node status Mediator Medical record Binary 0 = negative
1 = positive Stage Mediator Medical record Categorical I - III
Aim 2 Exposure White (n=856) Black (n=658)
Luminal A 348 (74) 221 (59)
Luminal B 83 (18) 94 (25)
Low/Med ROR-PT 442 (92) 315 (83)
High ROR-PT 40 (8) 66 (17)
High quantitative ER 690 (81) 494 (75)
3.4.5 Statistical analysis
We will use linear binomial regression to calculate relative frequency differences (RFD) and 95% confidence intervals (95% CI) as the measure of association between race and clinical covariates, adjusting for age at diagnosis.
Inverse probability weighted (IPW) Cox proportional hazards models will be used to estimate standardized hazard ratios and 95% CI for the effect of race on disease-free interval, overall and within strata defined by molecular features. 116, 117 IPW are advantageous in that allow for adjustment for baseline characteristics but do not require the proportional hazards assumption to be met within all cross-strata of covariates. IPW also allows for the calculation of standardized survival curves similar to Kaplan-Meier curves.
To estimate the effect of race on disease-free interval, we will use logistic regression models to calculate the probability of belonging to each group (black vs white) accounting for baseline clinical covariates. Model 1 will adjus for age at diagnosis (continuous linear). Model 2 will additionally adjustfor grade (1, 2, or 3), node status (positive vs negative), and tumor size (≤ 2 cm vs > 2cm). To estimate the effect of race jointly stratified by molecular feature, we will use multinomial logistic regression models to calculate the probability of belonging to each of the four jointly stratified group (white/low risk, black/low risk, white/high risk, black/high risk) adjusting for age (continuous linear) and stage at diagnosis (I, II, or III). These probabilities will be used to calculate stabilized inverse probability of exposure weights to estimate standardized hazard ratios, calculate 5-year disease-free interval probability, and plot
standardized survival curves. We will assess the mean and range for all weights, will optimal mean of 1 and reasonable range within 10 - 20. The proportional hazards assumption of IPW Cox models will be assessed graphically by examining the inverse probability-weighted log cumulative hazard function estimates and by Wald test of a product term between exposure group and time.
We will examine treatment covariates among grade 3 tumors, as grade is a widely assessed tumor marker and correlates strongly with high-risk molecular subgroups.101, 118 We will assess
adjusted for stage. We will perform sensitivity analyses to assess treatment differences among tumors with low quantitative ER status and high ROR-PT score.
3.4.6 Power calculations
See Aim 1 for power calculations for survival analyses.
3.5 Aim 3
3.5.1 Data collection
We will use exposure data collected from in-person interview and medical records and
quantitative ER measures collated as described for Aims 1 and 2.All exposure data has been previously collected and outcomes will be measured as in Aims 1 and 2, so no new data collection will be necessary for Aim 3.
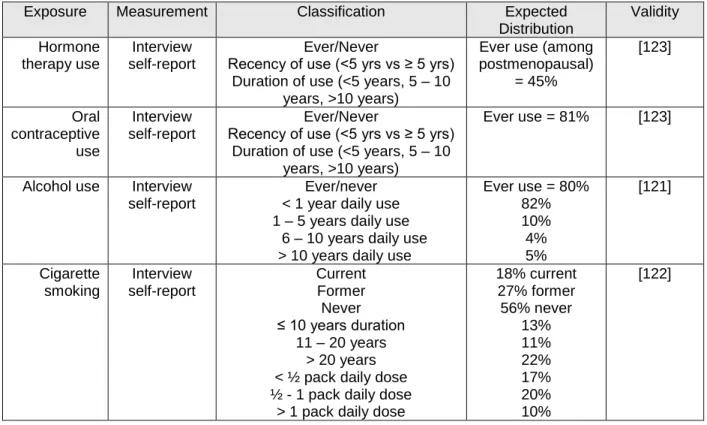
3.5.2 Exposure assessment
Table 3.7. Aim 3 exposure description.
3.5.3 Outcome assessment
For Aim 3, the outcome assessed will be protein- and RNA-based quantitative ER measures as detailed above in exposures for Aims 1 and 2. We will assess continuous measures of ER percent positivity, ESR1 gene expression and ER intratumoral heterogeneity. The former two measures will also be dichotomized to low versus high, with low category representing the lowest quartile of expression in the study population. ER intratumoral heterogeneity will be dichotomized as high (top tertile of study population) versus low. ROR-PT score will be dichotomized to high (score > 64.71) versus low/medium per established protocol. 101 Oncotype Dx Recurrence Score will be dichotomized to high (score > 25) versus low/medium per established recommendations. 119
3.5.4 Covariate assessment
For Aim 3, the association between individual exposures and quantitative ER will be assessed adjusting for age at diagnosis, race, node status, and stage at diagnosis.
Exposure Measurement Classification Expected
Distribution Validity Hormone therapy use Interview self-report Ever/Never
Recency of use (<5 yrs vs ≥ 5 yrs) Duration of use (<5 years, 5 – 10
years, >10 years)
Ever use (among postmenopausal) = 45% [123] Oral contraceptive use Interview self-report Ever/Never
Recency of use (<5 yrs vs ≥ 5 yrs) Duration of use (<5 years, 5 – 10
years, >10 years)
Ever use = 81% [123]
Alcohol use Interview self-report
Ever/never < 1 year daily use 1 – 5 years daily use
6 – 10 years daily use > 10 years daily use
Ever use = 80% 82% 10% 4% 5% [121] Cigarette smoking Interview self-report Current Former Never ≤ 10 years duration
11 – 20 years > 20 years < ½ pack daily dose ½ - 1 pack daily dose
> 1 pack daily dose
3.5.5 Statistical analysis
To evaluate the association of contemporaneous exposures with quantitative measure of ER we will use linear binomial regression to calculate relative frequency differences (RFD) and 95% confidence intervals (95% CI) as the measure of association between binary measures and exposure categories, general linear regression will be used for continuous measures. Estimates will be adjusted for age (continuous linear), race (black vs white), stage (I, II, III, or IV) and node status (positive vs negative). Associations with HT use will be restricted to post-menopausal women only.
3.5.6 Power calculations
To assess the correlation between categorical exposures and continuous measures of quantitative ER, we are 80% powered to detect a difference in means of 0.3 at alpha=0.05 with a
minimum group size of 174. Our prior study of ESR1 expression and smoking status showed a difference in mean ESR1 expression of 0.3 between never and ever smokers [18].
3.5.7 Preliminary studies
We have examined the impact of exogenous hormone use on breast tumor subtype as indicated by Oncotype Dx Recurrence Score (RS) and found that among postmenopausal women, HT users have a significantly higher frequency of intermediate RS tumors relative to low RS tumors [abstract presented at the International Society for Pharmacoepidemiology Annual Conference]. This suggests that HT use may modify tumor gene expression profiles in a clinically relevant manner. Further investigation of tumor molecular features of HT users will help clarify the mechanisms by which HT influences tumor biology and help determine tumor phenotypes which are sensitive to hormone exposure.
3.6 Potential limitations and alternative strategies
Measurement error: In self-report measures used in nurse interview, it is possible that some women may misrepresent their exposure history. However, in person report has shown moderate validity when compared to medical record review [68-71]. Measures of quantitative ER have or will be processed in the same laboratory for all samples, and has shown high validity in prior studies in CBCS [18, 53].
CBCS3 is a member. The AMBER consortium contains 1,279 additional population-based breast cancer cases from the Women’s Circle of Health Study (WCHS) with exposure and tumor data harmonized with CBCS data. Our group has previously published using pooled CBCS and WCHS data from AMBER and has access to the data [53].
Selection bias: It is possible that women who consented to enrollment in CBCS are different from women who chose not to enroll. However, CBCS is advantageous in that it is a population-based sample, and offers higher external generalizability than hospital-based cohorts or clinical trials. We compared the demographic and clinical covariates of women enrolled who have complete ER biomarker data to those with missing biomarker data as described in Aim 1 methods (see Table 3.4 above) and found no concerning differences.
Missing data: Some women will have missing exposure or outcome data. Missing exposure data will be assessed as discussed in Aim 1 methods. In the event of high missingness of recurrence or mortality outcomes (>10% of women missing outcome), we can use multiple imputation or inverse probability weights to obtain unbiased effect estimates.
3.7 Strengths of study
To our knowledge, this is the first study to examine the impact of quantitative ER and intratumoral heterogeneity of ER expression on survival outcomes in a population-based cohort with a high proportion of black and younger women. Quantitative ER levels and spatial variation of expression have been recognized as important clinical parameters of ER expression but remain poorly understood. Until recently, measurement of ER expression has been limited to IHC assays, which are highly sensitive and do not reflect the biological range of ER expression. Advances in genomic assays now allow us to
survival are expressed differently by race. The diversity of the CBCS population gives us the power to do this.
This study is also innovative in that it considers the influence of exposures that may impact tumor biology. It is important to better understand the impact of exposure history on tumor biology, because this may help elucidate etiologic heterogeneity within the ER positive subtype.
Another favorable aspect of this study is that it leverages the innovative and comprehensive information collected in the CBCS. The CBCS is a powerful resource for studying risk factors and outcomes in breast cancer because it captures a high proportion of younger and black women, who are not often represented in other population based or clinical trials. Medical records and tumor biospecimens allow for detailed clinical and pathological data, and continued follow-up has resulted in high clarity treatment data and robust measurement of survival and recurrence outcomes. The in-depth personal history obtained during in-person nurse interview, which will allow us to consider many important exposures and covariates. Furthermore, the CBCS data is now mature enough to meet relevant survival outcome endpoints but remains contemporary to current clinical practices.
CHAPTER 4: ASSOCIATION OF QUANTITATIVE MEASURES OF ESTROGEN RECEPTOR PROTEIN AND RNA WITH EARLY BREAST CANCER RECURRENCE
4.1 Overview
Introduction: Estrogen receptor (ER) is a powerful prognostic and predictive biomarker in breast cancer. Few studies have explored how ER quantity, gene expression, and intratumoral heterogeneity of expression impact recurrence, particularly among non-white populations.
Methods: Using data from ER-positive stage I-III patients in the Carolina Breast Cancer Study (Phase 3: 2008 – 2013) we estimated the association between binary and continuous ER measures (ER percent positivity, ESR1 gene expression, and intratumoral heterogeneity quantified using Rao’s
quadratic entropy equation) and recurrence. We calculated race-stratified estimates and tested for modification by race on the additive and multiplicative scales.
Results: Among 1,775 eligible women a total of 175 recurrences were identified over a median follow-up of 6.65 years (range = 0.39 to 9.96). Decreasing continuous ER percent positivity was associated with increased risk of recurrence (age and race-adjusted hazard ratio: 1.06 95% CI: 1.02, 1.11). Increasing intratumoral heterogeneity score was associated with decreased risk of recurrence (age and race-adjusted hazard ratio: 0.6 CI: 0.4, 0.9). ESR1 gene expression was not associated with
recurrence. No measures of ER remained significantly associated with recurrence in the overall cohort after additionally adjusting for size, grade, node status, hormone therapy receipt, and year of diagnosis. The effect of ER percent positivity and intratumoral heterogeneity appeared to be modified by race on the additive scale, with the effects of low ER and high intratumoral heterogeneity significant for black but not white women.
Conclusion: The early prognostic and predictive value of ER expression may be different for black and white women. Future studies should investigate the impact of ER expression on longer-term
4.2 Introduction
Estrogen receptor (ER) positivity is a prognostic indicator and a powerful predictor of endocrine therapy (ET) response in breast cancer.38, 110–112 ER status is typically assessed using
immunohistochemical (IHC) stains from which percent of positively-stained tumor cells and intensity of staining can be quantified. In most tumors, ER is either entirely absent or clearly expressed.61, 62 This dichotomy is reflected in clinical guidelines established by the American Society of Clinical Oncology (ASCO) and College of American Pathologists (CAP), which classify ER-positive breast cancers as all tumors with at least 1% staining.53 However, unlike ER-negative tumors, which are almost uniformly highly proliferative and carry a poor prognosis, ER-positive tumors exhibit considerable heterogeneity in clinical and molecular characteristics. Part of this heterogeneity appears to be due to differences in ER expression. Breast tumors that exhibit weak (≥1 – <10%) ER-positivity have demonstrated pathological features of negative tumors, with survival outcomes intermediate between negative and ER-positive cases.58–60, 71, 120–124 Further evidence has suggested that, in addition to differences in intensity and amount of ER expression, spatial heterogeneity in expression also contributes to differential outcomes in ER-positive breast cancer.43
In addition to varied survival outcomes by features of ER expression, there are also outcome disparities by race among ER positive tumors.6, 75 These disparities, which are not observed at the same magnitude among ER-negative tumors, are thought to be driven in part by differences in tumor biology. It is uncertain whether heterogeneity in ER expression may be a contributing feature, or whether the association between ER expression and survival is the same in black and white women. Ma et al. previously reported quantitative ER positivity to be predictive of breast cancer-specific mortality in white women but not among black women, though the study lacked treatment data and focused solely on ER protein levels.79 Thus, while several biological explanations for disparities are plausible, few studies have had detailed biological data on quantitative and spatial measures of ER protein, ER gene expression, and outcomes in black and white women.