The Effect of Rurality and Region of
Residence on the Receipt of
Adjuvant Chemotherapy in
Colon Cancer Patients: A Look at North Carolina
By
Curtis Bryant
A Master's paper submitted to the faculty of the University of North Carolina at Chapel Hill In partial fulfillment of the requirements for
the degree of Masters of Public Health in the Public Health Leadership Program
The Effect of Rurality
and Region of Residence
on the Receipt of
Adjuvant Chemotherapy
in Colon Cancer Patients
A
look at North Carolina
Curtis Bryant
2/22/2008
Introduction Objective
Social inequalities in cancer outcomes are well documented. The social
determinants of these cancer disparities often include factors related to race, age, gender,
social capital, socio-economic status, and environment. These determinants often work in
combination to create or help sustain the disparities in cancer outcomes that appear to be
widespread in the United States. One of the ways that social determinants create
inequalities is by promoting differences in the quality of cancer treatment for different
patient subgroups. For instance, there is some evidence that colon cancer patients who
belong to disadvantaged races, who live in rural areas, or who have low socio-economic
status receive recommended adjuvant chemotherapy (ACT) at lower rates than
predominant social groups. 14 However, studies examining the link between these social
factors and the quality of cancer treatment often offer conflicting results. 5
This study examines the relationship between living in rural areas and the receipt
of adjuvant chemotherapy for colon cancer patients in North Carolina. It also examines
the relationship between region of residence in North Carolina and the probability of
ACT receipt. Patient-level data was acquired from the North Carolina Central Cancer
Registry (CCR) to answer the study questions. If a treatment disparity is found it may
indicate the need for specific interventions to counter deficiencies in post-operative
medical care for rural patients with colon cancer.
Burden of Disease
Colorectal cancer is the third most frequent cancer type and the third leading
colon cancer, a subtype of colorectal cancer, was diagnosed in over one hundred
thousand Americans in 2007 and that nearly 52,000 cases died last year.6 These numbers
are estimates of the burden of disease, but they are calculated with incidence data from
the Surveillance Epidemiology and End Results (SEER) database. The SEER database is
the most comprehensive database describing annual incidence of the most common forms
of cancer affecting Americans.
The American Cancer society derives its cancer mortality figures from the
National Center for Health Statistics (NCHS).6 Together, raw data from SEER and the
NCHS provide the best estimates of national cancer statistics available. Estimates of
disease burden in North Carolina also come from come from the North Carolina Central
Cancer Registry (CCR).7 Using similar techniques as the ACS, the registry estimated that
4,425 new cases and 1,645 deaths from colorectal cancer occurred in North Carolina in
2007.7
Treatment of Colon Cancer
Surgery is the primary therapy for colon cancer. All patients with stage I to stage
III colon cancer (85% of cases) require surgical removal as the major mode of therapy. 8
Adjuvant chemotherapy is recommended for patients with stage III cancer.9 These cases
comprise 22% of all incident colon cancers. The recommended chemotherapy regimen
was initially based on results from three clinical trials indicating that 5-fluorouracil and
levarnisole improved five-year survival in patients with stage III colon cancer compared
to those who received levisimole alone, or surgery alone. 9 In particular, adjuvant
chemotherapy lowers five-year mortality by 33% and five-year recurrence by 40% when
In 2003 fluorouracil plus leucovorin became the standard therapy following a
series of trials proving its superiority to fluorouracil and levamisole. In 2004, Andre et
al. demonstrated that adding oxaliplatin to fluorouracil and leucovorin improves five-year
survival from 73%, to 78%. These results led to oxaliplatin gaining acceptance as the
current standard adjuvant chemotherapy treatment.9 The results of adjuvant
chemotherapy appear even more impressive when one considers an outcomes table
(Table 1 ). As seen in Table 1, stage III colon cancer patients on average have mortality
rates reaching 55% over 5 years with only surgery, but with adjuvant chemotherapy
five-year mortality may fall to as low as 36.6%.8•10 Combining the figures derived by the
ACS and by Moertel et. al, one can estimate that there are nearly twenty-two thousand
patients are diagnosed with stage III cancer a year in the U.S. One can postulate that if
these patients are treated with surgical resection alone, on average 12,100 will die within
five years. 8 Providing adjuvant chemotherapy to all eligible candidates may lower this
number to 8,066 over five years.
In the context of clinical trials, ACT has offered impressive survival benefits for
stage III patients. Consequently, adjuvant chemotherapy has gained nationwide
acceptance as critical part of post-operative colon cancer treatment. The National Cancer
Institute and the National Institute of Health both have issued recommendations
reiterating this point, but U.S. cancer patients have experienced low treatment rates for
nearly a decade. In 2001, Schrag et al. concluded that only 55% of eligible Medicare
patients received adjuvant treatment.11 Similarly, in 2004, the investigators recording
data for the National Cancer Database found that only 45% of eligible patients received
these numbers are on an upward trend, as some demographic groups receive ACT at rates
close to 80%, but under-treatment is still present, especially among certain subgroups.12
Disparities in Treatment among Colon Cancer Patients Race
Several studies have explored social factors explaining why some groups receive
adjuvant chemotherapy at lower rates than the average and key results have surfaced.
Race, age, rural residence, insurance status, socioeconomic status have all been found to
be related to the under use of adjuvant chemotherapy, but results have been conflicting
for some of these factors. Most recent studies have found no relationship between race
and rates of adjuvant chemotherapy use.1• 2• 12 The most recent study to find otherwise,
Baldwin eta!., noted that African American patients were just as likely to be offered
chemotherapy, but significantly less likely to receive it.13 This result might indicate
differences in patient preference, a problem with physician-patient communication, or
problems with access to care for certain racial groups. This is an area which needs
further research, but preliminary results indicate that white and black patients may be
offered ACT for colon cancer at similar rates.
Socio-economic Status and Insurance Status
Only one study has found that insurance status and income are related the receipt
of adjuvant chemotherapy among colon cancer patients. In 2002, in a study by
VanEnwyk, patients with an annual income ofless than nine thousand dollars were
significantly less likely to receive adjuvant chemotherapy. The study also found that
patients with private insurance were more likely to receive adjuvant chemotherapy than
like education level, and the measure of insurance status was inexact. Given the
weaknesses in this study and the lack of available evidence on the subject, the
relationship between socio-economic status, insurance status and colon cancer treatment
is inconclusive. 5
Age
Studies have consistently linked advanced age at cancer diagnosis to low rates of
adjuvant chemotherapy receipt. One study estimated that only 69% of patients between
the ages of70 and 79 receive ACT treatment, while only 34% above age 80 receive
ACT.11 Another study published in 2002, found that patients younger than 55 were much
more likely to receive adjuvant chemotherapy than patients older than 80 after adjusting
for co-morbidities.5
There are several possible reasons for this trend. First, the presence of significant
co-morbidities among the elderly could play a role. Potosky et al. found that the presence
of a co-morbidity using the Charlson co-morbidity scale was inversely related to the
receipt of standard adjuvant chemotherapy when adjusting for age.14 The Charlson
morbidity score measures the severity of co-morbid conditions, with higher scores
representing more significant health problems. A score of zero represents the healthiest
patients and a score of three or more three represents the sickest patients. A more recent
study, published in 2006, using SEER data found that 60% of elderly patients ( age>65)
with a score of zero received adjuvant chemotherapy, while only 51% and 45% of
patients with scores of two and three were offered treatment.15
Physician reluctance to prescribe the current adjuvant chemotherapy regimen to
trials describing the efficacy of each treatment rarely included patients with significant
co-morbidities.9 Consequently, it is not known whether co-morbidities reduce the
survival benefits offered by adjuvant chemotherapy for colon cancer.
In addition, some physicians may not offer elderly patients chemotherapy because
of notions that otherwise healthy elderly patients cannot significantly benefit from
chemotherapy. Physicians may believe that the elderly have low potential life expectancy
or may believe that the elderly do not tolerate chemotherapy well. Studies among the
elderly examining these issues are limited in number, but Sargeant eta!. published a
high-quality study in 2001 indicating that patients taking 5-fluorouracil experienced higher
rates of severe organ toxicity and poorer patient tolerability when compared to patients
under 65.14 This study seemed to validate the belief that patient tolerability of
chemotherapy declines with age, independent of general health. On the other hand,
Jensen eta!. in 2006 found that patients 75 years and older, despite requiring lower doses
of chemotherapy, still benefited significantly from adjuvant treatment.15 Furthermore,
Jessup et a! found in 2005 that colon cancer patients 80 years or older benefited similarly
from adjuvant chemotherapy in terms of five-year survival in comparison to younger
patients.12 Consequently, age is currently not accepted as a reason for not offering
adjuvant chemotherapy to patients with stage III colon cancer, but physicians must be
prepared to vary doses to optimize patient tolerance.
Finally, patient age may relate to patient preference for treatment. In a study of
general patient preferences for adjuvant chemotherapy, age was a strong predictor of
patient preference with older patients less likely to choose ACT. 16 It is difficult to
receipt of adjuvant chemotherapy. A patient's preference against ACT could explain
much of the differences seen in the receipt of ACT among older cancer patients.
However, research suggests that patients rely heavily on the advice of physicians;
better-informed physician advice may lead to a reduction of the age gap in cancer therapy.
Rural Residence
Only a few studies have examined the relationship between rurality and ACT
receipt. One study done by V anEenwyk et a!, in 2002 indicated that patients living in
rural zip codes in Washington State were 60% less likely to receive adjuvant
chemotherapy. The authors were able to adjust for patient co-morbidity, age, sex, race
and insurance status. 5 The data used in this study included colon cancer cases diagnosed
from 1996 to 1997. Research has suggested that rates of adjuvant chemotherapy for
patients with stage III colon cancer have continued to increase since the mid 1990's, so
the results of this study may not adequately reflect the current relationship between rural
residence and ACT receipt.12 A second study done by Wu et. a!, in 2004, using data from
several Louisiana hospitals and medical practices, found no difference in the receipt of
ACT between patients living in rural versus urban areas. The authors of this study
controlled for confounding factors thoroughly, and their results provide up to date
information regarding rurality's effect on ACT receipt. 17 More studies are needed to
verifY the results put forth by Wu's study.
Research Objective
We will attempt to investigate the relationship between rural residence and ACT
receipt for stage III colon cancer cases using data from the North Carolina Central Cancer
examining the study question we propose, and the studies that have been published offer
conflicting results. Additionally, the breadth of information obtainable from the CCR has
been improved significantly over the years, and we hope we can answer our study
questions adequately and also provide information about regional differences in ACT
receipt. The CCR now obtains a higher percentage of information about colon cancer
cases in the state than in past years, especially from small community hospitals. The CCR
has also added variables related to patient refusal of treatment, and more detailed
information about tumor stage, grade and date of treatment.
One of the most difficult challenges of this study is adequately defining rural
residence. Depending on one's definition of rurality, around I 0- 28% of the U.S.
population lives in rural areas.18• 19 On average residents in rural areas in the U.S. have
higher rates of unemployment, higher percentages of the elderly and of children, lower
population density, higher poverty rates, and higher rates of uninsurance and
underinsurance.18 Many of these characteristics of rural environments play a role in the
quality of care patients receive. The prevalence of these factors varies depending on the
definition of urbanization that researchers use.
Using rural residence as an independent variable in analytic studies leads to two
major problems. The first is that rural areas can vary greatly in terms of culture,
economics, demography and environment. As a result, attempting to lump all rural areas
together in these types of analyses is difficult and ultimately leads to a more diverse
groups that desired.18 A second problem relates to the possibility that a defined level of
urbanization serves only as a marker for more specific social determinants of health. The
reporting population density, economic and trade development, environment, pollution,
urbanization, relationship to metropolitan areas, penetration and development of medical
specialists, or distance to hospital care.18 As a result, it is useful for researchers to also
attempt to evaluate these other variables by either controlling for them or evaluating them
individually and including them in the study discussion.
Despite these difficulties, a number of standardized methods for defining
urbanization have emerged. The Office of Management and Budget (OMB) has issued
one of the more widely accepted systems of defining urbanization.17• 18 The OMB system
is based on assigning all U.S. counties Urban Influence Codes, which were derived from
2000 census figures. These codes classify counties as either metropolitan or
non-metropolitan based on population size, population density and proximity to urban areas.
This system then subdivides each category based on adjacency to the different size
counties created.19 The Urban Influence Codes put forth by the OMB offer one of most
rigorous and conservative methods of delineating rural areas as has been used in many
studies in heath care research.18
Consequently, we will use OMB urban influence codes in our analysis. We will
also examine the relationship between patient region of residence and the receipt of
adjuvant chemotherapy, to determine whether there are regions of the state with lower
receipt of ACT, regardless of degree of rurality. We believe that these relationships will
clearly delineate whether access to care represents a barrier to the receipt of
chemotherapy. We will attempt to control for the other factors that are related to rural
residence and receipt of ACT.
Data source
The North Carolina Central Cancer Registry (CCR) collects information on colon
cancer cases diagnosed and treated within state boundaries. The CCR records name,
gender, age, sex, race/ethnicity, insurance status, and residence geocodes. The CCR also
collects information related to disease, including tumor stage, tumor grade, date of
diagnosis, initial treatment, use of adjuvant chemotherapy and patient specified reason for
refusing treatment. The CCR is licensed to receive information from every cancer
diagnosing health care provider within the state. The sources of information most often
are hospital based, but they can include physician practices, pathology laboratories and
individual death certificates. The goal of the CCR is to monitor the incidence of cancer
among various populations over time, and to also report information related to staging,
location and treatment. Specifically for colon cancer the CCR obtains over 83% of the
desired information. Public health experts, researchers, and members of the state health
department analyze the data upon request. The quality of the data is assessed and by the
NCCCR, Centers for Disease Control and the North American Association of Central
Cancer Registries.
Patients
Our analysis was restricted to state residents diagnosed with colon cancer between
1998 and 2004 in North Carolina. The study included all men and women diagnosed with
stage III colon cancer in that time. Staging was accomplished using the tumor, node,
metastases staging classification designated by the American Joint Cancer Commission
(AJCC). The patients were staged from physical exam, abdominal and chest CT, and
extending to one or two lymph nodes but without established metastasis. All patients
meeting these criteria were included in the study.Z0
Geocoding Locations
We used Geographic Information Systems (GIS) to provide spatial analysis. Our
goal was to accurately determine each patient's residence within a North Carolina county.
Traditionally, GIS has been a powerful research tool allowing investigators to process,
analyze and visualize ecologic data. In this study, as part of the abstraction of process,
the CCR collected information on patient residence. Through GIS, the CCR was able to
give each patient a geo-code for residence location. Using these geo-codes, the CCR
assigns each patient to a specific county in North Carolina. The CCR is also able to
assign a geo-code location for a patient's hospital of diagnosis, surgical treatment and
adjuvant chemotherapy treatment. We will use the patient's geocoded data on residence
to determine the patient's county urbanization level and geographical region. We will
examine the relationships between these factors and the probability of receiving
recommended adjuvant chemotherapy and other factors related to receiving appropriate
care.
Study Variables Urbanization
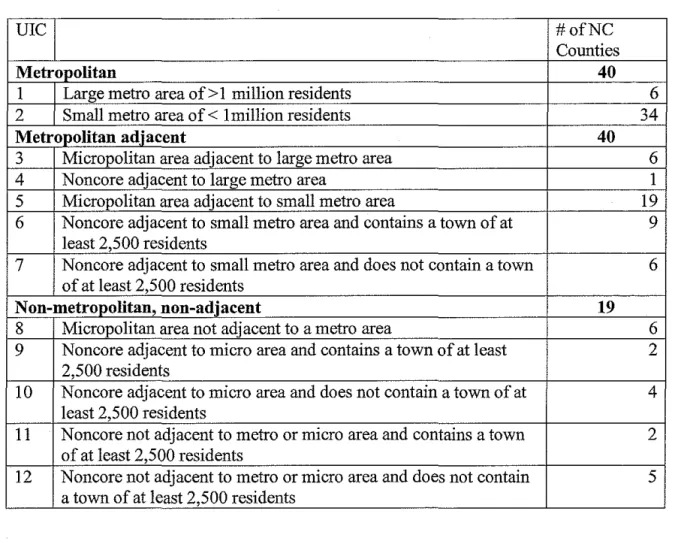
Rural status was defined using urban influence codes which were published by the
federal Office of Management and Budget (OMB) in 2003. We grouped the OMB's
codes to fit the design of our study. The urban influence codes originally defined by the
OMB can be seen in Table 2. The listed classification scheme defines metropolitan
adjacency with more urbanized areas. The urbanization scale correlates well with
economic development, access to information, finance and many other important social
resources. This scale is particularly useful in health access research because the level of
urbanization and adjacency to urban areas often correlates well with the proximity of
community hospitals and large medical centers. Using this scale, 75% of the nation's
land is considered rural, and 17% of the nation's citizens are considered rural residents.19
Urban influence codes divide all state counties into a total of 12 groups. As
mentioned above, counties are first determined to be either metropolitan (metro) or
non-metropolitan. Metro areas are defined using population and commuting data from the
2000 census. The definition depends on the census definition of an urbanized area. The
census bureau defines urban areas as those with a nucleus of at least 50,000 residents,
which may or may not contain individual cities. In general, urban areas must have a
population density of 1,000 persons per square mile and may contain adjoining territory
with at least 500 persons per square mile.19
According to the OMB counties are counted as metro areas if they are central
counties with one or more urbanized areas, or they outlying counties that are
economically tied to the core counties by work commuting. Outlying counties are
included if at least 25 percent of workers living in the county commute to the central
counties, or if 25 percent of the employment in the county consists of workers coming
from the central counties. Metropolitan areas are further divided into two groups by their
population size. Large metro areas are those with more than a million people, and small
Non-metro counties are divided into two main groups. The first group is entitled
micropolitan (micro) areas which consist of any non-metropolitan area with an urban
cluster of at least 10,000 residents. Surrounding counties can be included in the micro
area by considering the amount of inter-county commuting, which is defined in the same
way as for metro areas which is detailed above. These micro areas are further divided into
three groups depending on their adjacency or non-adjacency to large, small, or no metro
areas. The second group of non-metro counties is called non-core counties. They are
divided into seven groups by their adjacency to a metro or a micro area and whether or
not they contain a town of at least 2,500 residents. Non-core counties containing more
than 2,500 resident are referred to as having their "own town".19
Using patient geo-codes for county residence each patient was placed in one of
the 12 areas detailed above and also illustrated in Table 2. For the purposes of this study,
we consolidated urban influence codes into three groups. 1) NC Metropolitan Areas
which were any area designated as metro using UIC codes (UIC codes 1 and 2). 2) NC
Non-metropolitan areas were areas designated as non-metropolitan according to UIC
codes and non-adjacent to metropolitan areas (UIC codes 8-12). 3) NC Adjacent areas
were defined as areas with UIC codes indicating a non-metropolitan status but areas
adjacent to metro areas (UIC codes 3-7). The UIC coded regions were grouped in order
to capture the proximity to metropolitan areas. We believe that the distance each patient
encountered in attempting to reach a metropolitan area is the most relevant factor to
explore in regards receipt of chemotherapy.
The North Carolina Cancer Partnership, an organization committed to the
improvement of cancer outcomes for patients in North Carolina, divided the state into
several regions based geography and each region's perceived major center of health care.
The regions are as follows: the Asheville Region, Greensboro Region, Charlotte Region,
Raleigh Region, Wilmington Region, and Greenville Region. The counties of each region
are depicted in Figure 1. We will use patient geo-codes to stratify patient residence based
on the region in which they live. We will then analyze patient region versus the
probability of not receiving adjuvant chemotherapy and the other outcomes we outline
below
Receipt of care
We will use several variables to provide information about the receipt of adjuvant
chemotherapy among the study population. The NC Central Cancer Registry collects
information on whether patients with stage III colon cancer receive chemotherapy.
Patients for whom there is no record of chemotherapy having been received are assigned
one of the following codes: chemotherapy not recommended (1 ); chemotherapy
contraindicated (2); chemotherapy treatment of choice, not administered, no reason given
(6), chemotherapy refused by patient, family member or guardian (7); chemotherapy
recommended, unknown if given (8); and reason for no chemotherapy unknown (9).
We grouped these variables to create several new variables, to give us a more complete
picture of whether patients were being offered and receiving care consistent with current
guidelines. We considered it to be consistent with current guidelines to withhold
chemotherapy if it was contraindicated or refused by the patient; we therefore created a
patients who received chemotherapy and those for whom chemotherapy was
contraindicated or refused (codes 2 and 7). We also created a variable "offered adjuvant
chemotherapy if not contraindicated," which includes those patients who received
chemotherapy, those to whom chemotherapy was offered but for whom there was
incomplete data on whether it was received (codes 6 and 8), and those for whom
chemotherapy was contraindicated or refused (codes 2 and 7). We compared these
variables to "chemotherapy not recommended," a group for whom it could be clearly
determined that care was not consistent with current guidelines.
Statistical Analysis
Statistical analyses were performed with the help of several biostatisticians at the
North Carolina Central Cancer Registry. We used the total number of cases of Stage III
colon cancer occurring between 1998 and 2004 as our study population. We geocoded to
a specific street address. We geocoded patients who provided non-street addresses to
census block groups. Finally, we geocoded patients who provided county of residence
data only. It is important assign as many patients to street level addresses as possible to
be able to control for some of the confounding variables we will detail below.
In our analysis, we compared patient residence in Metropolitan Areas,
Non-Metropolitan Areas, and Adjacent Areas to the receipt of adjuvant chemotherapy. We
compared region of residence using NC Cancer Partnership regions to the receipt of
ACT. Specifically we used Chi-square analysis to examine our primary and secondary
questions in the study. We had concerns that the data were not normally distributed and
We will also perform multivariate analysis to determine the effect of that the
potentially confounding variables. Because we did not have patient-level data on income
we used mean census tract income as a proxy for patient income. For patients for whom
a street address was not available, we used median county income as a proxy for patient
income. Those variables will include race, patient age at diagnosis, and sex. We will use
mean census tract income as crude measure to control for patient income.
Results
The North Carolina Central Cancer registry reported that 5,474 patients were
diagnosed with colon cancer in North Carolina between 1999 and 2004. Of these 5,306
patients were designated as state residents. The remaining 169 cases were eliminated
from the study. Demographic characteristics of original sample of patients can be seen in
Table 3. Of the 5,306 patients who were North Carolina residents, the registry had data
on chemotherapy treatment and county of residence for 4,432 of the patients diagnosed
with colon cancer in the time period, and as Table 4 shows, these patients were included
in the study. This was 83.5% of the North Carolina patients diagnosed with Stage III
colon cancer. For the remaining 874 patients, the registry did not have adequate treatment
data. It is unknown how or if these patients were managed. Consequently, they were not
included in the study. Depending on how these patients were dispersed in the state and
the treatments they received, they could have affected the results of our analysis
significantly.
Geocoding Results
The geocoded results were originally completed for patients diagnosed with colon
on available to the NCCR. Only these cases were included in the final analyses. Of the
cases diagnosed among North Carolina residents, the North Carolina Central registry had
a unique recorded address for 4740 cases. If the cases provided a valid street address they
were geocoded to that address. If the cases provided a post office box as an address they
were geocoded to a 2000 census census block group. This step allowed us to better
classifY their location within their listed county. The remaining cases, 566 or I 0% of the
total, could not be geocoded to either street address or census block group, so they were
geocoded to their residential county.
Care received results
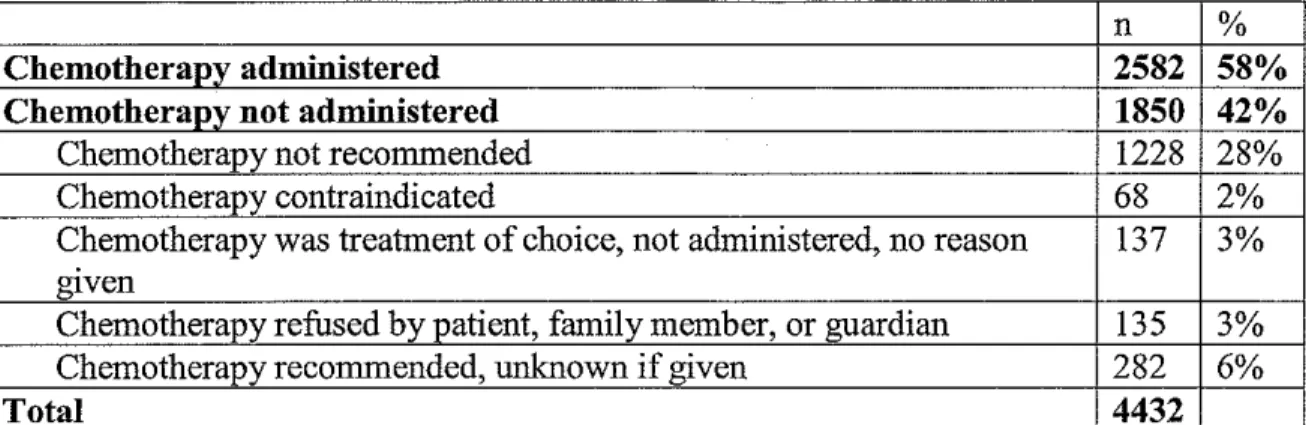
A total of2,582 patients with Stage III colon cancer received ACT between 1998
and 2004. This represented 58% of the study population. Twenty-eight percent of the
patients did not receive a recommendation for ACT, without any indication that ACT was
contraindicated or refused. A total of 72% of the study population patients was offered
ACT if it was not contraindicated, and 63% received chemotherapy if it was not
contraindicated or refused (Table 5). Consequently, the majority of patients in North
Carolina received care consistent with current treatment recommendations, and a larger
percentage were at least offered ACT when appropriate, although we do not have
complete data on whether they received it or the reasons for why they did not receive it.
For the patients who did not receive ACT, we have some data that sheds some
light onto the possible reasons. Three patients in the study population died prior to the
decision to treat or not treat with adjuvant chemotherapy. This was less than 0.01% of the
study population and was not likely a significant factor in the interpretation of the results.
272 patients, 6.1% of the study population, treatment was recommended and either not
given or it is unknown if treatment was given.
Chemotherapy regimen results
The exact chemotherapy regimen received by each patient remains unknown. The
drugs were not recorded by members of the NCCCR, but they did record the number of
agents each patient received. Based on the prevalent recommendations at the time,
patients should have received at least two chemotherapeutic agents to maximally benefit
from adjuvant chemotherapy.9 In the study population, it is known that nearly 55.3% of
treated patients received only one chemotherapeutic agent. Only 16.6% of patients
received two or more chemotherapeutic agents and the regimen. This suggests
significant under-treatment among even those who received adjuvant chemotherapy.
Additionally, the data indicates that there is significant heterogeneity of treatment
received by patients in the study population. It is unknown whether the appropriate "
chemotherapeutic drugs were administered at appropriate doses in a timely manner.
Level of urbanization vs. Receipt of Care
The results describing the relationship between receiving appropriate care and
urbanization level are listed in Table 6. As described earlier, urbanization level was
divided into three groups based on metropolitan status or proximity to a metropolitan
area. On all statistical analyses a chi-square analysis was used due to Non-Gaussian
distribution of data.
Patients living in metropolitan areas, metropolitan/adjacent areas, and
non-metropolitan/non-adjacent areas received ACT at very similar rates (59.0%, 58.3%,
(p=0.37). The rates of receiving ACT if not refused or contraindicated (63. 7%, 61.3%,
55.5%) and being offered ACT if not contraindicated (72.9, 71.3, 70.1) were very similar
as well and no significant difference with discernable on univariate or multivariate
analysis.
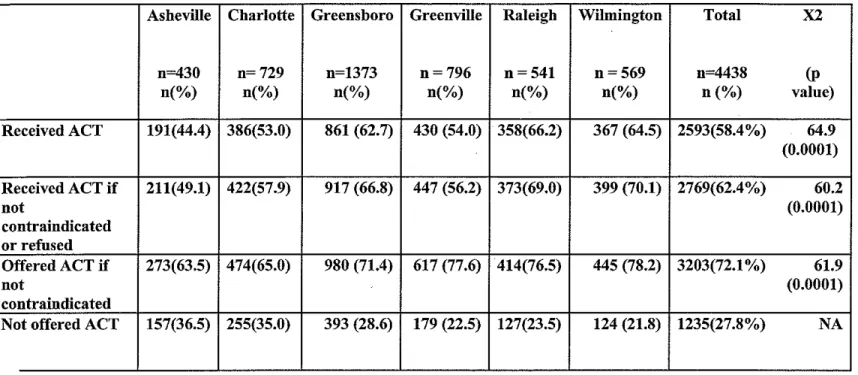
Region vs. receipt of care
The results describing the relationship between region of residence and treatment
can be seen in Table 7. Again, North Carolina was divided into six regions in this
analysis: Asheville, Charlotte, Greensboro, Greenville, Raleigh and Wilmington areas
(Figure 1 ). Patients in Asheville, Charlotte and Greenville were less likely to receive,
ACT and to be offered ACT than patients in the other NC regions. The relationship
between treatment and region was statistically significant (p<O. 0001) on the univariate
analysis. On multivariate analysis including the aforementioned variables, the
relationship was no longer significant. To perform this analysis we used multivariate
logistic regression with receipt and non-receipt as the two outcome variables. We did this
analysis for each of the three dependent variables we analyzed.
Discussion
This study was done to determine if rurality affects the probability of receipt of
ACT for stage III colon cancer patients in North Carolina. First, we wanted to determine
the overall level of statewide prescription of ACT for stage III colon cancer between
1998 and 2004. We hoped that the results would indicate whether colon cancer patients in
North Carolina suffered from under-receipt of treatment. We also hoped that this study
receive differing rates or if region of residence in North Carolina affected the probability
of ACT receipt.
Our study was similar to prior studies done byWu and VanEenWyk, but key
differences do exist between our study and prior studies investigating rurality versus ACT
receipt for colon cancer. First, our study data is considerably more recent and covers a
greater time span than previous studies. We used statewide data from 1998 to 2004, while
the Wu used data from a single year, 2001, and VanEnwyk used data from 1996-1997.
Consequently, we hoped that our results we provide a more up to date estimate of the
patterns of ACT receipt for stage III colon cancer patients. Second, the aforementioned
studies were completed in Louisiana and Washington State respectively, and we felt that
investigating the relationship between rurality and ACT receipt in North Carolina would
bemore relevant to our local health systems. 5•17 Finally, we hoped that including
additional dependent variables in our study would allow us to make more precise
conclusions about the patterns of ACT receipt in North Carolina. For example, we
included variables describing rates of ACT refusal and contraindication which allowed us
to investigate the relationship between region and rurality and the probability of being
offered ACT.
Overall ACT Receipt for Colon Cancer Patients with Stage III Disease
Ultimately, our results allow us to draw a few conclusions about the treatment of
colon cancer among North Carolinians. First, nearly forty percent of eligible patients in
the state still do not receive ACT. This supports prior publications indicating that ACT is
under prescribed. For example, Scharg et al. and data from the National Cancer Database
respectively. 8• 11 These results highlight the need for continued emphasis on the
prescription of ACT for all eligible patients in North Carolina. The efforts to improve the
rates of ACT receipt could take the form of statewide initiatives to make ACT for stage
III colon cancer patients a measure of cancer treatment quality among all cancer treating
hospitals in North Carolina. A similar initiative could also be incorporated into the North
Carolina's Cancer Partnership's overall mission to improve the cancer outcomes among
state residents. Such an initiative would be worthwhile because data from clinical trials
suggest that outcomes could improve collectively for all stage III patients if more eligible
patients received the appropriate treatment.
Our data also indicate that between 1998 and 2004 there was not clear standard of
care ACT treatment for followed for eligible patients. Nearly 55.3% of patients only
received one chemotherapeutic agent. Only 16.6% of patients received multi-drug
therapy, while for 11% of patients the exact number of drugs used was not recorded. This
indicates that the current and past standard of care treatments, meaning the treatment
regimens supported by landmark clinical trials were not used for the majority of patients.
Those studies support the use of at least two chemotherapeutic agents as a part of ACT. 9•
10
Again, this is an indication that under treatment was pervasive in the study period,
and a statewide initiative to improve the level of recommended ACT might be beneficial.
Rurality vs. ACT Receipt
Our study results indicate that rural residence does not affect the probability of
ACT receipt in the North Carolina. The results trended towards higher rates of ACT
receipt being associated with metropolitan and adjacent to metropolitan areas, but these
of interest, which included the probability of receiving ACT if not contraindicated or
refused and the probability being offered ACT if not contraindicated, also did not vary
with rurality significantly. Environment, as defined by rurality, likely has no effect on
the probability that stage III colon patients in North Carolina receive ACT. It is possible
that our study did not have enough power to produce a significant test result. Still, the
absolute difference in probabilities across levels of rurality would not have been
clinically significant regardless of the p value obtained. The groups differed only slightly
in regards to the probability of ACT receipt, being offered ACT if not contraindicated,
and receiving ACT if not contradiccated or refused.
In addition, it is possible that the OMB-defined urban influence codes did not
adequately capture rural-urban differences in receipt of ACT. In some cases counties
were defined as part of a metropolitan area if 25% or more of residents commuted to an
adjacent metropolitan area, but access to heath care in these counties on the periphery of
the metropolitan area may in be different from that of counties at the center of the
metropolitan area. If counties that were actually more rural in character were
misclassified as urban, differences between rural and urban areas would have been
obscured.
Results from prior studies investigating rurality's effect on ACT receipt offered
conflicting results. VanEwyk found that rurality lowers the probability of ACT receipt for
stage III colon cancer patients. 5 The most recent data, from our study and from Wu et a!,
both agree that rurality has no effect.17 Consequently, it possible that over time the
quality of care available to patients in rural environments in terms of post-operative
Region of residence vs. ACT receipt
Our study also showed that region of residence significantly affects the
probability of receiving ACT, the probability of being offered ACT and the probability of
receiving ACT if not refused or contraindicated. This significant difference disappeared
upon multivariate analysis when race, age, and income were taken into account These
results indicate that patients receive differing care depending on the region. Patients
residing in the Asheville, Charlotte and Greenville regions are offered and receive ACT
much less often than the other regions ofNorth Carolina. This is most likely explained by
other factors related to each region. Income, race, and age could be confounding the
relationship between region and ACT receipt Other factors like distance to National
Cancer Institute funded cancer centers may also act as a confounder in the relationship
between region and ACT receipt
There have not been any prior studies investigating region of residence versus
receipt of ACT for stage III colon cancer. Consequently, there is no body of evidence
available to substantiate or oppose our findings. Investigating the patterns associated with
differing quality of cancer treatment in North Carolina is a worthwhile issue. In future
studies, if the same regions continually have inferior treatment rates for recommended
cancer treatments, then it would signal for the need of significant interventions to
improve cancer care in those regions.
Study Limitations
The study is hampered by several significant weaknesses. The first group of
shortcomings relates to the potential for misclassification of treatment and race. For
classifiers do not accurately represent a significant proportion of the actual study
population. It is unclear from our system how many patients with colon cancer are
Hispanic, American Indian or of Asian descent. This is significant because over ten
percent of the North Carolina population is made up of non-white, non- black races. 21
Patients of these other races may receive ACT at differing rates, making racial
misclassification a significant issue.
A second potential weakness of our study relates to the method we used to control
for income. We used mean census tract income as surrogate value for patient income. It is
difficult to determine how well census tract income represented patient-level data.
Potentially if patient income is related to the development of colon cancer, then mean
census tract income would not accurately represent patient income. For example, if
patients with less income develop colon cancer more often than wealthier patients, then
the mean census tract income would overestimate patient -level income data. Again, using
census tract income was a potential source of misclassification of our confounding
variables and unfortunately we can not predict how this potential error could have
affected our results.
Finally, our study's most significant weakness was that we did not have treatment
data for a large sum of patients in our original sample. The NCCCR did not have
treatment data for nearly nine hundred patients (16.5%) in the original sample of North
Carolina residents with Stage III colon cancer. This lack of treatment data potentially
could have biased our results if these patients were distributed in the state unequally. For
example if the majority of unknown treatment cases came from rural areas, or from
significantly if these patients also received ACT at different rates than we found in the
study.
Future Research
As mentioned earlier this study indicates that patients with stage III colon cancer
receive ACT less often in the Charlotte, Greenville and Asheville regions. One potential
confounder of this relationship is patient distance to National Cancer Institute (NCI)
funded cancer center and patient distance to American College of surgeon certified
cancer treatment. These centers have to meet specific standards related to cancer
treatment quality and are monitored closely by state and Federal agencies. American
college of Surgeon and NCI centers are scattered throughout North Carolina and it is
possible that patients who live closest to these treatment centers receive ACT at higher
percentages than patients who live far away. We feel that this is an important question
that needs to be answered. It may give the medical community in North Carolina more
insight about how well these centers are performing in delivering care to all patients in
North Carolina, as well as how distance to these centers relates to region of residence and
the receipt of recommended ACT receipt for patients in this study.
Ultimately, the results of this study may mimic those describing the relationship
between rurality and ACT receipt results. The majority of ACOS treatment centers and
comprehensive cancer centers are located in metropolitan and or
non-metropolitan/adjacent areas. The close relationship between these variables may indicate
that they are also closely related in terms of their effect on adjuvant chemotherapy
(1) McGory ML, Zingmond DS, Sekeris E, Bastani R, Ko CY. A patient's race/ethnicity does not explain the underuse of appropriate adjuvant therapy in colorectal cancer. Dis. Colon Rectum 2006 Mar;49(3):319-329.
(2) Cronin DP, Harlan LC, Potosky AL, Clegg LX, Stevens JL, Mooney MM. Patterns of care for adjuvant therapy in a random population-based sample of patients diagnosed with colorectal cancer. Am.J. Gastroenterol. 2006 Oct; 101 (1 0):2308-2318.
(3) Sargent DJ, Goldberg RM, Jacobson SD, Macdonald JS, Labianca R, Haller DG, et a!. A pooled analysis of adjuvant chemotherapy for resected colon cancer in elderly patients. NEngl.J.Med. 2001 Oct 11;345(15):1091-1097.
( 4) Jensen SA, Vilmar A, Sorensen JB. Adjuvant chemotherapy in elderly patients (>or=75 yr) completely resected for colon cancer stage III compared to younger patients: toxicity and prognosis. Med.Oncol. 2006;23( 4):521-531.
(5) VanEenwyk J, Campo JS, Ossiander EM. Socioeconomic and demographic disparities in treatment for carcinomas of the colon and rectum. Cancer 2002 Jul 1 ;95(1 ):39-46.
(6) American Cancer Society, editor. Cancer Facts and Figures 2007. 1st ed. Atlanta: American Cancer Society; 2007.
(7) Cancer Sites Projections North Carolina. 28 March 2008. http://www.schs.state.nc.us/SCHS/CCR/proj07site.pdf
(8) Jessup JM, Stewart AK, Menck HR. The National Cancer Data Base report on patterns of care for adenocarcinoma of the rectum, 1985-95. Cancer 1998 Dec 1 ;83(11 ):2408-2418.
(9) Andre T, Boni C, Mounedji-BoudiafL, Navarro M, Tabernero J, Hickish T, eta!. Oxaliplatin, fluorouracil, and leucovorin as adjuvant treatment for colon cancer. N Engl J
Med 2004 June 3;350(23):2343-2351.
(I 0) Moertel CG, Fleming TR, Macdonald JS, Haller DG, Laurie JA, Tangen CM, eta!. Fluorouracil plus levamisole as effective adjuvant therapy after resection of stage III colon carcinoma: a final report. Ann.lntern.Med. 1995 Mar 1;122(5):321-326.
(11) Schrag D, Cramer LD, Bach PB, Begg CB. Age and adjuvant chemotherapy use after surgery for stage III colon cancer. JNatl.Cancer Inst. 2001 Jun 6;93(11):850-857.
(12) Jessup JM, Stewart A, Greene FL, Minsky BD. Adjuvant chemotherapy for stage III colon cancer: implications of race/ethnicity, age, and differentiation. JAMA 2005 Dec 7;294(21 ):2703-2711.
(13) Baldwin LM, Dobie SA, Billingsley K, Cai Y, Wright GE, Dominitz JA, et a!. Explaining black -white differences in receipt of recommended colon cancer treatment.
(14) Potosky AL, Harlan LC, Kaplan RS, Johnson KA, Lynch CF. Age, sex, and racial differences in the use of standard adjuvant therapy for colorectal cancer. J. Clin. Oneal. 2002 Mar 1;20(5):1192-1202.
(15) Cronin DP, Harlan LC, Potosky AL, Clegg LX, Stevens JL, Mooney MM. Patterns of care for adjuvant therapy in a random population-based sample of patients diagnosed with colorectal cancer. Am.J. Gastroenterol. 2006 Oct; 1 01(1 0):2308-2318.
(16) Mahoney T, Kuo YH, Topilow A, Davis JM. Stage III colon cancers: why adjuvant chemotherapy is not offered to elderly patients. Arch.Surg. 2000 Feb; 135(2): 182-185. (17) Wu X, Chen VW, Andrews P A. Treatment patterns for stage III colon cancer and factors related to receipt of postoperative chemotherapy in Louisiana. J La Sate Med Soc. 2004 Sep-Oct;156(5):255-61
(18) Hart LG, Larson EH, Lishner DM. Rural definitions for health policy and research. Am.J.Public Health 2005 Jul;95(7):1149-1155.
(19) Briefing Room Measuring Rurality: Urban Influence Codes. 2003; Available at: http://www.ers.usda.gov/Briefing/Rurality/Urbanin£'. Accessed 4/12, 2007.
(20) Commission on Cancer Accreditation: Cancer Program Approval General
Information. 2003; Available at: http://www.facs.org/cancer/coc/approval.html. Accessed 4/22,2007.
(21) U.S. Census Bureau: North Carolina. 2000; Available at:
http://factfinder.eensus. gov/servlet/ ACSSAFFFacts? event=Search& lang=en& sse=on &geo id=04000US37& state=04000US37. Accessed 4/12/2007.
Tables and Figures
Table 1.
Outcomes Table of 5 Year Survival for Patients with Stage Ill Colon Cancer Mortality figures derived from Moertel et al 1995
No. of Cases/yr 5 year Mortality 5 year mortality
with Surgery Alone with ACT and Surgery
Stage Ill No. Percentage No. Percentage
22,000 12,100 55% 8066 36.6
Deaths prevented w/ACT
Table 2. Urban Influence Code (UIC) Groupings
UIC #ofNC
Counties
Metropolitan 40
1 Large metro area of> 1 million residents 6
2 Small metro area of< 1 million residents 34
Metropolitan adjacent 40
3 Micropolitan area adjacent to large metro area 6
4 Noncore adjacent to large metro area 1
5 Micropolitan area adjacent to small metro area 19 6 Noncore adjacent to small metro area and contains a town of at 9
least 2,500 residents
7 Noncore adjacent to small metro area and does not contain a town 6 of at least 2,500 residents
Non-metropolitan, non-ad.iacent 19
8 Micropolitan area not adjacent to a metro area 6 9 Noncore adjacent to micro area and contains a town of at least 2
2,500 residents
10 Noncore adjacent to micro area and does not contain a town of at 4 least 2,500 residents
11 Noncore not adjacent to metro or micro area and contains a town 2 of at least 2,500 residents
12 Noncore not adjacent to metro or micro area and does not contain 5 a town of at least 2,500 residents
Table 3. Demographic Characteristics of Source Population
Metro Non-metro Non-metro Total n(%) Adjacent Non-adjacent n(%)
n (%) n(%) Race
White 2589 1294 250 4133
African American 644 331 89 1064
Other 48 38 6 92
Sex
Male 1614 783 159 2556
Female 1667 880 185 2732
Mean age 67.57 67.64 68.59 67.66
Table 4. Receipt of Adjuvant Chemotherapy: Study Population
n %
Chemotherapy administered 2582 58% Chemotherapy not administered 1850 42%
Chemotherapy not recommended 1228 28%
Chemotherapy contraindicated 68 2%
Chemotherapy was treatment of choice, not administered, no reason 137 3% giVen
Chemotherapy refused by patient, family member, or guardian 135 3% Chemotherapy recommended, unknown if given 282 6%
Total 4432
Table 5. Ad.iuvant Ch emot erapy h T reatment
c
ategonesn %
Received adjuvant chemotherapy 2582 58%
Received adjuvant chemotherapy if not contraindicated or refused 2785 63% Offered adjuvant chemotherapy if not contraindicated 3204 72%
Not offered adjuvant chemotherapy 1228 28%
Table 6. Receipt of ACT vs. UIC Groupings
Non-metro Non-metro
Metro Adjacent Non-
x2
Total n=2688 n=l448 adjacent n=4417n=281
Receipt of n(%) n(%) n(%) (p value) n(%) Chemotherapy
Received ACT 1585 (59.0) 844 (58.3) 153 (54.4) 1.99 (0.37) 2582 (58.5%) CT if not contraindicated 1713 (63.7) 887 (61.3) 156 (55.5) 3.72 (0.16) 2756
or refused (62.4%)
CT if not contraindicated 1959 (72.9) 1033 (71.3) 197 (70.1) 1.77 (0.41) 3189 (72.2%) Not offered ACT 729 (27.1) 415 (28.7) 84 (29.9)
Table 7. Receipt of ACT by Region of Residence
Asheville Charlotte Greensboro Greenville Raleigh Wihnington Total X2
n=430 n=729 n=1373 n=796 n=541 n=569 n=4438 (p
n(%) n(%) n(%) n(%) n(%) n(%) n(%) value)
Received ACT 191(44.4) 386(53.0) 861 (62.7) 430 (54.0) 358(66.2) 367 (64.5) 2593(58.4%) 64.9 (0.0001)
Received ACT if 211(49.1) 422(57.9) 917 (66.8) 447 (56.2) 373(69.0) 399 (70.1) 27 69( 62.4%) 60.2
not (0.0001)
contraindicated or refused
Offered ACT if 273(63.5) 474(65.0) 980 (71.4) 617 (77.6) 414(76.5) 445 (78.2) 3203(72.1%) 61.9
not (0.0001)
contraindicated
Figure 1. NC Cancer Partnership Regions
Greensboro Raleigh Greenville
Asheville
Charlotte
Wilmington