Miles
Bidwell
and
Jean
M.
Bonnes
A
Peak
Load
Pricing
Policy
for
North
Carolina
Utilities
In the early
1970s
North Carolinaelectricutilitycom-paniesplannedto
embark on
construction projectsfornew
plantscostingbillionsof dollars. But,forthefirsttime inthehistory ofthestate,
power
firm policiesfellupon
turbulent waters. Soaring electric rates had resultedina tideofconsumer
outrage.Legislative ef-forts delayed thecompanies
from sailing theiroriginal courses. Questions
were
being raised aboututility pricing policies.
In 1975,the North Carolina legislature adopted a
measure
by Senator McNeill Smith to require thestate Utilities
Commission
tohold publichearingsonpeak load pricing and the future needsforelectricity
inthe state. After the
December,
1975
hearings,theCommission
ordered the utilitiesto submit plans toimplement
this form of pricing.With peak load pricing, a
consumer
is charged a ratebasedupon
the timeofday he usestheelectrici-ty. Thissystem chargesa lower rate foroff-peakuse
to encourage electricity
consumption
at off-peak"With
peak
load
pricing,
a
con-sumer
ischarged
a
rate
based
upon
the
time
of
day
he uses
electricity."
periods. Advocates of peak load pricing,
sometimes
calledtimeofdayormarginalcost pricing,claim there
couldbean immediate reduction inaverage monthly
bills and that construction
programs
fornew
generating capacity to
meet
peakdemand
would
be delayedfor a significant period in the future.The
presentrate structureisleftoverfromthe pastwhen
average costs for generating electricitywere
declining. Back then,people never used to worry
whether
theyturnedofflightsinempty
rooms
ortriedtoconserveelectricityinotherways.
Most
peopledidnot question or understand the reason for the rate
structure,becauseastheir use increased,they got a
cheaper rate, something like a bulk rate.
They
felt itwas
notworth the effort toconserve energybecause
it did not lower their monthly bill very
much.
People
were
behavingexactlyas theeconomic
textbooks predicted.
The
declining block rate structure lowered the unit cost asmore
electricitywas
con-sumed.
Thismeant
thatthelastunitcost lessthanthe averageprice.Even thoughelectric billsrose within-creased consumption, the
added
cost of usingone
more
unitwas
small.1Why
the Increase
inElectrical
Rates?
In 1973, the oil
embargo
by the Organization of Petroleum Exporting Countries (OPEC) and the en-suing "energycrisis" raisedourconsciousness abouta
phenomenon
thathadbegun
severalyears earlier.Energyprices
were
rising. In North Carolina in 1961the averagepricefor
one
kilowatt* hour of electricitywas
0.0125
dollars. In 1967,thatpricehad droppedto0.011 dollars. But by 1975,the average price had climbedto
0.0265
dollarsand
is stillclimbing.2Therewere
several reasons for this change.In the 1950's
and
1960's the electriccompanies
took advantage of
economies
of scale as they builtlarger
and
larger generating plants.The
price ofvariousfuels
was
nearlyconstantand thesetwo
fac-tors
combined
tocauseadecreasingcostof electricity generation.The
onlyratecases heard by the UtilitiesCommission were
requests by theutilitycompanies
fordecreases inrates.
Meanwhile,
thepublicenjoyeda substantial increase in real income,
making
itthatmuch
more
difficulttoget excitedaboutthe technical aspects of efficiency in electricity generation.Electric
power
generating plants continued toex-pand. But,
sometime
in the early 1970'sthe electricutilitiesindustryran outof
economiesof
scaleandthecostsofelectricityandofadditionalgenerating plants
began
a rapid rise. Thisphenomenon,
coupled with thesudden
increase in oiland
coalpriceshas spurred the abruptjump
in electrical rates.Is
the
Existing
Rate Structure
Part
of
the
Problem?
The
present rate structureswere drawn
up in theolddays.Since largegenerating plants
were more
ef-ficient and had smalleraverage coststhan the small*A kilowattis
an
amount
ofelectricityused
atanymoment.
An
electrictoastermight have
ademand
of1,000 watts or
one
kilowatt. Thesame
toaster ifoperated
foran
hour
would
consume
one
kilowatthour fkwh) ofelectricity.
Miles 0. Bidwell holds a Ph.D. in
Economics
fromColumbia
University.He
isamember
ofthe National Sierra ClubEconomics Committee and
Assistant Professor ofEconomics
atWake
Forest University.Jean
M.Bonnes
is a free-lance writer.V
*>*•§*-*
'*•
Duke
Power'sBelews
Creek PlantPhoto courtesyDuke Power Co.
plants, it
seemed
clearthatifpeoplecould beinducedtouse
more
electricity,more
efficientplantscouldbe builtand
everyonewould
benefitfrom lower averageelectric rates. Therefore, the declining block system
became
the traditionalway
of pricing.The
power
company
calculatedthetotalexpectedcostofproduc-ing the electricity
which
included a "fair" rate of return on its capital,and
divided by thenumber
ofkilowatt hours it expected to generate. This
way
itarrivedata priceperkilowatthour.Thisaverageprice
was
then modified to charge a higher rate for the small userand
a lowerrateforthe large consumers.Consumers
were rewarded
with lower rates iftheyuseddevicesthat
consumed
largequantities ofelec-tricity, like hot water heaters
and
electricheatingforhouses.
The
result today, however, is not a loweraveragecost for generating electricity, but a higher cost,
revealing the relation
between
costand
output. Thiscost of
new
expensive generating capacity, en-couraged under the present system, isspread to allconsumers
intheformofhigheraverageelectricbills.It is
one
source of inefficiency in electricity genera-tion.A
second inefficiency results from having pricesand
costs notdirectlyrelatedtoeach
other.Under
ex-istingconditions,the costofgeneratingelectricity
in-creases with the
amount
being generated,because
the
most
efficient generating plants are brought infirst. In1974, thefuel costalonevariedfrom0.001
86
dollars to
0.02768
dollars per kilowatt hour in theDuke
system.3Average
costs in the system are
in-creasing with total use. Therefore, the cost of generating electricity at periods of peak
demand
isgreater than thecost ofgenerating itattimesof low
use. But people paythe
same amount
regardless ofwhen
they use it. Since this rate is charged at alltimes,the
consumer
hasnoincentivetoplantoselectthetime ofhis use.
The
resultisagreaterdemand
atpeak times,
which
requires thepower companies
to maintain additionalexpensivegeneratingplants.The
consumer
iscaught inaprecariouspositionwithinaninefficient pricing system
—
a pricingsystem thaten-courages greater total use
and
greater peak use.What
are thealternatives?What
would
be theeffectsofusinga differentapproach?
A
good
startingplaceto look for theseanswers
is toexamine
theway
other goods are distributedand
priced.The
Competitive
Model
In a competitive
economic
system,theconsumers
ultimatelydecide
how
a nationwillallocateitsscarceand limited resources by casting dollar votes in the
market place.
Consumers
decide, forexample, ifthenation istohave an
abundant
supplyofautomobiles, rather than a well developedmass
transit system.*In all cases, the individual
consumer
decideswhether
ornottobuy somethingbycomparingtheex-pected benefit with the price. In any competitive market, the prices of manufactured commodities
reflect the marginal cost of producing the
com-modities.
The
electric utilities industry is not a part of thecompetitive system. In the past,the first
company
tosupply electricity to an area
became
themonopoly
supplier. To protect citizens from
monopoly
power,states established
commissions
toregulatethesein-dustries.
On
theone
hand, thecommission
hasachance
toset electricity prices in any
way
it chooses.On
theother hand,the
commission
hastheverydifficulttaskof performingthe functionsthatoccur automatically through the interaction ofproducers and
consumers
in the competitive sector.
The commission
facesthe problem ofmaking
the interrelated decision ofhow
much
electric capacity to have,and
how
to set thepricesignalsthat
consumers
usetodecidehow
much
electricity they
want and
when
theywant
it.There is an important distinction
between
acom-petitive market
and
amonopoly
or non-competitive*John
Kenneth
Galbraithwould
argue that in therealworldof giantmonopolies,corporations are able
tocajole, coerce,
and
deceive theconsumer
into buy-ingwhat
the corporationswant
to sell. BarryCom-moner
inthePovertyofPower
arguesthatthedemise
of public transit in the U.S.
was
helped along by GeneralMotors
buyingup municipaltrolleysystemsand
shuttingthem down.
system.
The
price isalways a signaltotheconsumer
for deciding
how
much
of each item to purchase inboth systems, but only in a perfectly competitive system
must
the pricerepresent the marginal costtothe society of producing each item.
Marginal
Cost
Pricing
In acompetitive marketaproducerdoesnot setthe price.
The
market determinesthegoingpriceandthe producerdecideshow
much
ofthisitemtoproduceby comparing the price with his marginal cost.The
marginal cost is the costofproducinganextraunit or the difference in his total costs
now
and histotal costs
when
he producesone more
unit. If themarginal costtoproducea pencil,forexample,isonly
two
cents, but the market price is three cents, themanufacturer will continue to produce pencils and
expand
his output.When
the marginal cost to produce the pencil equalsthe market price of three cents he will not producebeyond
this quantity because the addition to costwould
be greater than the increase inrevenuewhich
ismarketprice.He
will not,forexample,want
toexpand
productiontoa pointwhere
the marginal cost ofthat pencil is threeand
ahalfcents, half a cent abovethe marketprice. Ina
competitive system,all production will be such that
the price of each good is equal to its marginal cost.
Intheabove caseofpencils, thisisareadilyapplied concept. In the case of electricity production
and
throughout this paper, however, the large scale
and
expense of generating plants
make
it appropriate to consider LongRun
Marginal Cost (LRMC).The
marginal costisalwaysthecostofproducinganother unit; however,
when
producing anotherunitinvolvesbuilding a
new
multi-billion dollar plant, thisnew
capacity cost
must
be considered in calculating the marginal costat levelsofoutputwhich
press againstcapacity. Sincethe costofeach
new
plant isgreaterthanthe lastone,
and
itdoesnotmatterwhy
the costsare increasing (it might be
due
to construction orcapacity or pollution controls etc.), the appropriate long run marginal cost
must
reflect the cost ofin-creasing the output. This is necessary ifthe optimal
amount
ofgenerating capacity in the system isto be determined. In the long run,the desiredamount
ofnew
capacity can be determinedonly by seeinghow
much
electricitypeoplewant
touseata pricethatin-cludes the potential cost of
new
capacity.Because
marginal cost pricingmeans
setting thepriceequaltothecostofproducing
one more
unit,itisirrelevant that
some
ofthepeaking electricitycomes
from hydroplants
which
have lowmarginal costsun-til they arefullyused.
The
appropriatepriceisthecostof another
KWH
to the system.The
general theory tells us that incremental capital costs should bein-cluded in the prices attached to the time period in
which
use presses againstcapacity.Thisisfairsinceit allocates the
new
construction coststothosewho
demand
electricity during peak periods, andwho,
therefore, are
making
thenew
construction necessary.4On
the otherhand, including thecost of
new
construction might well decreasedemand, and
make
construction ofnew
generating plants un-necessary. "Boththe Britishand
theFrenchelectrici-ty industries have reported
improvements
in systemloadfactors of
between
10and
20
percent."5At the present time in the
Duke
system,which
recorded44
per cent reserves duringitsgreatest peak,this
would
not havea matterof practicalimportancein rate set-ting. However, if
and
when
the systemdemand
doesincrease
enough
to approach capacity, then the marginal cost prices will reflect this marginalcon-struction cost, and should result in equitable and
ef-ficientdistribution ofthe costs.
The
Present
System
is inConflict
with
the Competitive
Model
Regulatory
commissions
now
set a price forelec-tricitythat has norelationship tothe marginalcostof
generating it.
The
price of electricity, though, stillremainsthesignalon
which
theconsumer
basesthe decisiontopurchaseornottopurchase.Butthatprice has no direct relationship to the cost to society of producing it. The presentpricingsystem
leadstoless5
03
cr.
0)
13,000 12,000
11,000
10,000
9,000 8,000 7,000 6,000 5,000 4,000 3,000 2,000 1,000
Figure 1
Duke
PowerCompany
System Load forDay
ofGreatestSummer
Peak, Monday, August 25,1975
System Generating Capacity
1
2345
678
91011121
2345
6789101112
Time
useof
cheap
off-peak electricityand
more
use ofthe expensivepeak
electricity. Therefore theaveragecostofallelectricitygeneration is increased.
Ifthe
consumer
were
chargedfortheaveragecosts of the products he used, the market placewould
bechaotic, likethesupermarket described by Columbia
University economist William Vickery, at the peak
load pricing hearings before the North Carolina
Utilities
Commission
duringDecember,
1975. To eliminate the bother of checkout counters, the supermarketwould
doaway
with the present marginalcost pricingsystem andinstitutean averagepriceforallthegoods basedonlyontheweightofthe
purchase. For example, an economist mightfind the average price per
pound
by weighing all expectedpurchases at the grocery stores
and
dividing the en-tire weight into the desired revenue.This pricingsystem
would
facilitate matters atthecheckoutstation
and
probably eliminate lines.A
sim-ple scale
would weigh
eachconsumer's
purchase and the billwould
be basedupon
a fixed price per pound.The
resultofthispricingscheme
ispredictable, saidVickery.
The
consumer would
buyconsiderablymore
steak
and
less potatoes,and
the supermarketwould
go broke. If this
were
amonopoly
situation with nocompeting stores, then it could stay in business by
substantially raising the average price.
Illustrative
Examples
Figure 1, the
August
25, 1975,daily patternfortheDuke
system, illustratesthevariationofdemand
overa 24-hour period for the day ofthe highest
summer
peak
demand.
The
lowestdemand
was
4,503megawatts
at5 a.m.The
averagedemand
forthedaywas
6,834megawatts
andwas
reachedbetween
9and
10 a.m.The
greatest peakdemand
was
over 8,400megawatts and
occuredbetween
5 p.m.and
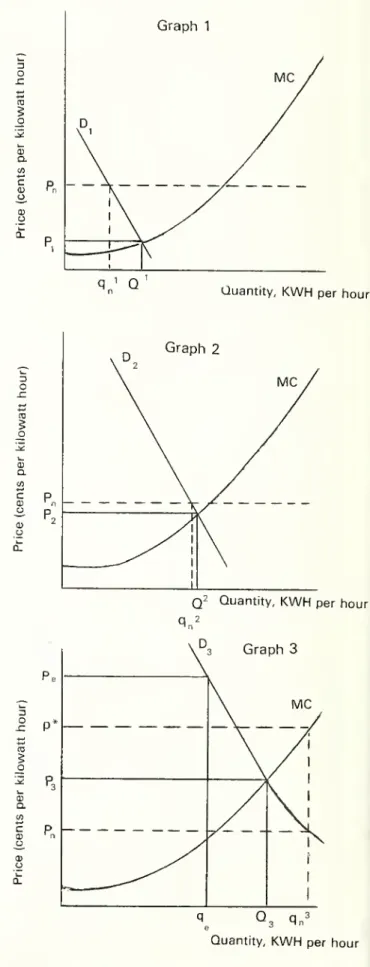
6 p.m.*InFigure2,
MCshowsthe
relationshipbetween
the marginal cost of generating the electricityand
theamount
being generated. This curve starts at a low level, correspondingtothe useofthe leastexpensive base load generatingplants,thenincreases as thein-termediate plants are brought in, and finally
in-creasessharply as the"peaking"plantsareadded.
As
thelimits ofcapacityare reached,thiscurveincludes the costofbuilding
new
generating capacityto satisfy a further increase indemand
and
rises evenmore
steeply.
Graph
(1) represents thedemand shown
in*At this
same
timeDuke Power had
over 12,400megawatts
of installedgeneratingcapacity.About 40
per cent ofcapacity
was
idle at the time ofgreatestuse. This level of reserves is
more
than double theamount
considered desirable in the industry. Ingeneral, utilities like to
have between
15and
20
per cent reserves. Thisamount
should becomputed
con-sidering the possible purchases from neighboring systems. Itshouldbe added
thatthe reserveisneeded
only as long as prices are notflexiblesothatthereis
no
way
to discourage use during a temporaryshut-down
of a plant.Figure 2
Different Pricing Systems andthe Effectson
Electricity-Use
3 O
SZ
CD
Q.
C
CD CD
u
Graph
13 o
0)
Q.
C
CD
^J
CD
O
3 O
0>
D.
CD
U
Quantity,
KWH
per hourGraph
2q
2 Quantity,KWH
perhour
q 2
\
u
3
Graph
3MC
Q,
q„3Quantity,
KWH
per hourTable 1
Generating Capacity
and
Total Sales of ClassA
Electric Utility
Companies
in North Carolina1970-1975
Generating Capacity' 1970 1971 1972 1973 1974 1975 Average
(KWH
in1000s
YearlyChange Duke 56,932,821 60,059,756 66,510,270 76,927,801 99,631,733 111,303,877 14.34 Vepco 46,147,680 48,013,560 55,179,240 67,162,920 74,889,240 81,035,130 11.92
CP&L
29,522,560 40,121,404 44,317,276 50,609,096 55,750,240 64,388,0871688
Nantahala 876.000 898.898 950,327 988,52/1 1,017,033 957,265 1.79
Total 133,479,061 149,093,618 166,957,113 195,688,338 231,288,246 257,684,359 14.06
Sales (incl
jdmg
Resale)2(KWH
in 1000s)Duke 35,287,995 36,912,737 39,688,068 43,158,623 42,343,600 42,137,670 3.61 Vepco 23,505,825 24,686,096 26,910,710 30,044,018 29,872,991 31,488.319 6.02
CP&L
17,547,500 19,656,673 22,101,472 24,081,319 24,076,446 24,118,233 6.57Nantahala 374,735 415,173 414,278 445,685 474,269 412,891 1 96
Total 76,716,055 81,670,679 89,114,528 97,729,645 96,767,306 98,157,113 5.05
Ratio
(Sales/Generating Capacity)
Duke Vepco
CP&L
Nantahala Total
Average Price3
(C/KWH)
6198 .5094 .5944 .4278 .5747
1.34
.6146
.5141
4899 4619 .5478
143
.5967 4877
4987
4359 .5338
1.49
.5610
4473
.4758
4509
.4994
1.60
.4250 .3989 .4319 .4663 .4187
2.04
.3786 .3886 .3746 .4313 .3809
2.65
'Total installed
KW
capacity(FPCFormNo.1 p.432-434)x8760hours/year+KWH
purchased (FPCFormNo.1 pg.431,L10)2FPC Form No.
1, p. 409. L. 12
3FPC Form No.
1, p. 409, L. 10, col. (b)/col(d): does not include resale Figure1
between
4
a.m.and
5a.m.,Graph
(2),thede-mand
between 10
a.m.and
1 1 a.m.,and Graph
(3),the
demand
between
5 p.m.and
6 p.m.Under
the present system, a customer is chargedthe
same
price perKWH
whenever
the electricity isused.
The
presentaverageprice isrepresentedas Pn andwas
about 2.65 cents perKWH
in 1975. At thisprice,
consumers
usedqn1between 4
a.m.and5a.m.as
shown
ingraph(1). Laterintheday,theyusedqn2as
shown
in graph (2),and
during the peaktime withthe price still at Pn
consumers
usedqn3 as
shown
in
Graph
(3).These
same
graphs also illustrate the effects of changing toa marginal cost,flat-rate (noblockrateswith variable time of day pricing) pricing system.
A
marginal cost pricing system
would
setprices equalto the marginal costs. Setting marginal cost prices
consistsofdetermining
where
thedemand
curvein-tersects the
MC
(marginal cost) curve in eachdiagram.
An
optimal set of prices isshown
by P, inGraph
(1), P2 inGraph
(2),and
P3 inGraph
(3).Com-paringthedifferent prices, itisseenthatthemarginal
cost price
would
be lower than the existing price atthetimes represented by
Graph
(1) ,and
sincetheprice
was
lower,peoplewould
usemore
electricity atthis time,an increasefrom q n'
toQ
1.
Much
of thisin-crease
would
come
from people installing automatic timed switches on water heaters as isdone
in coun-trieswhere
time of day pricing is used.6The
price and quantity during the periodrepresented by
Graph
(2)would
bequite similartothe present formost
residential users.The
second bigdifference
would
occur during period (3). Duringthispeak time, the electricity
would
be priced at itsmarginal cost instead of being subsidized.
The
pricewould
be setat P3.Because
ofthe higherprice,peo-ple
would want
to use lessatthistimeand
quantitywould
fall from qn 3to
Q
3.Itis obvious that a substantial saving
would
bein-curred.
The
peoplewho now
use qn3of electricity at
thetimeof peak dosobecausethey arecharged only Pn. However,therealcostofthiselectricityisp*.
The
difference
between
thesepricescanbeclassifiedasasubsidy, financed by chargingeveryone
more
fortheirelectricity at other times.
The
difference in these costs atdifferenttimesofdayincreases as thesystem peak is reached,and
hasbeen
estimatedtovaryby asmuch
asfrom a lowofaboutone
cent perkwh
at latenight to over 11 cents per
kwh
at peak.*Table 1
shows
the relationbetween
electric priceand outputand generating capacity. It
was
preparedby theoffice of Senator McNeillSmith
whose
billes-tablished the hearings on electricity pricing.
The
tableshows
that inthe faceofdecreasingde-mand,
utilitycompanies
have continued toexpand
generating capacity. Profitsfrom electricutility
com-panies are established as rates of return on capital
base. This
means
that themore
capital there is,themore
profittherewillbe.Butprofitcomes
fromhigher electric rates.7In
1970
Duke
Power's ratio of output to capacitywas
61 .98%; by 1975
this hadfallen toonly37.86%.This
means
that generating capacity hasbeen
in-creasing
much
fasterthansales.As
thepercentageof excess capacity increases, the rate per kilowatthour increases.Benefits
Possibly the largest savings from marginal cost
pricing
would
be gainedin the long runbecause
thehigher price
and
lower use at peak times could decreasetheneed
fornew
construction. Ifsometime
in the future,
some
customersshowed
by theirwillingness to pay a high price at peak, that using electricity at the time of peak
was
worth tothem
asmuch
as itcostto producethe electricity, thenpeak-ingplantscould be added. But,they
would
bepaidfor onlyby the people using the electricity atthetimeof peak, rather than by all customers.When
marginal capital costs are included in the peak period marginal cost,the discrepancybetween
peak
and
off-peak costsbecomes
greateras the costof generating plants increases. For example,
Duke
Power
estimates the cost of its proposed Perkins nuclearplantatmore
than632
dollarsper kilowattof generating capacity.8If a pricing system could
eliminateor reducethe
need
forexcesscapacitythen expensiveconstructionprograms
could be eliminated at a great savings to theconsumer.
A
peak load pricing system should also providebenefits to lower
income
utility users. If a marginalcost pricing system
was
implemented
in NorthCarolina, the total revenue collected by the utilities
would
be likely to exceed thetotal costs for produc-tion. To keepconsumers
bills equal to average generating costs, a rebate of the differencebe-tween
thetotal revenuecollectedand
thetotalcost should beofferedto thecustomer.The
rebatewould
be
computed
bydeterminingthe differencebetween
the total revenue collected
and
the total costs of operatingthesystem,and
dividing thisby thenumber
*Differencesthis largeprobablyonlyoccur
when
a system is beingused
almost to capacityand
the marginal capital cost ofnew
construction are thereforeincludedinthemarginalcostcalculation.A
tthepresent rateofutilization in theelectricsystems
inNorthCarolina, the price difference
would be
much
less
because
thereismuch
unused
capacityeven
atthe timesof
peak
usage.of customers served. Since electricityuse increases
directlywith
income
(Recentfederalstudiesshow
anincome
elasticity of electricityuse ofabout 1 by crosssection.9
Most
studiesshow
in time series analysisthe
income
elasticityisabout.510.),thiswould
causearelative decrease in the electric billsof low
income
people.Therefore,a peakloadpricing
scheme
shouldhave positive distributional effects.
WhyThree
Instead
ofTwo
Prices?
With a peak-load pricing system, at least three
pricesare
needed
over a 24-hour period, plusone
ortwo emergency
prices.The
time of highest pricewould
be a three to four hour period during the heaviestdemand.
A
second periodwould
includemost
of the remainingwaking
hoursand would
besimilar totheexisting price.
A
thirdrate,for latenighthours,
would
bemuch
lower pricesto rewardoff-peakusers.
"Possibly
the
largest
savings
from
marginal
cost
pricing
would
be
gained
in
the
long
run
because
the higher
price
and
lower
use
at
peak times
could
decrease
the
need
for
new
con-struction."
During the hours of greatest
demand
and
highest price, aconsumer
mightchoose
towait afew
hours before turning up the air-conditioner or save evenmore
electricityby turning offhishotwaterheater.At off-peak hourswhen
the price is very low, the customer mighttakeadvantageofthelowratesbyus-ing atimeron hiswaterheater, freezer,etc.
Because
time of
summer
peak coincides with the timewhen
solar energyis
most
available, a peakpricingsystemwould
encourage
development
and
use of solartechnology.
A
two
price system is not considered appropriatebecause the object is to set prices that reflect marginal costs
and
thevariation inmarginalcostisso greatthat atwo
pricesystemcould onlyapproximate themarginalcost partofthe time.The
restofthetime,the price
would
be either greater or less thanmarginal cost,
and
much
ofthe present inefficiencywould
still persistwith the additionofamore
expen-sivemeteringsystem.
A
relatedproblemisthatifonlytwo
prices are used,thechange
in pricefromone
toanother
must
be substantial.Any
sudden
change
inpricescouldcausea shift tothe othersideofthe high
pricedperiodand shiftthe peak.
Athree
ormore
pricesystem isnecessary sothat
changes
fromone
priceto the nextcan besufficiently small.The
optimalsystemwould
haveverymany
prices.The
useofthreeorfourisa
compromise between
efficiencyinpricingandthe costs of metering.11How
should such a system be implemented?Inex-pensive metering systems have
been
developed inDuke
Power'
sMcGu
ireNuclear GeneratingStationisabout 75 percent complete
Photo courtesy Duke Power Co. tothe threetimeofdayprices,
one
ortwo emergency
prices should be added.
An
emergency
high ratewould
substitute for excess capacity. If a large plantbroke
down
atatimeofheavyuse,thesystemwould
switch to an
emergency
ratesuch as the oneshown
as price=Pe on Figure 2, graph 3.
As
explainedpreviously, the resulting difference
between
thepower
companies' total costsand
the total revenuecollected
would
be rebated equally to customers, sothatonly the people
who
usedmore
thantheaveragewould
wind
uppayingmore.A
low income,small user could conceivablywind
up receiving apayment
fromthe
company
instead of abillattheendof
themonth.What
Choice.
. .In the long run, the choice facing
consumers
andUtility
Commissions
isbetween
buildingnew
generating facilities or marginal cost pricing.
As
Carolina
Power and
Light said inan advertisementintheRaleigh
News
and
Observer, ". ..the lessyou use
athours of
peakdemand.the
lessgenerating capacitywe'll haveto build.
And
the lessyourelectricbillwillhave to go up in the future."12
After the decision is
made
tocommit
sums
ofcapitalforconstruction of
new
plants,allconsumers
ofelectricity are strapped with the
economic
burden. (Duke Power's proposed PerkinsNuclearStationwillcost about three billion dollars, or the equivalent of the net worth of
Duke
Power's totalassetsin 1975.)Many
peopleseem
confused by theconceptbehindpeak load pricing. But, these
same
people have livedwithpeak load pricingforothercommoditiesfor
most
of their lives.
The
telephonecompany
has specialrates for time of day use to reward callers for using
thelinesduring off-peak hours. Thisredistributesthe
demand
forservices.Withouta marginalcostortimeofdaypricingsystem, thetelephonecustomers
would
have no incentivetowait untilevening to
make
callsThe
telephonecompany
would need
to buildmore
facilities
and
transmission lines toaccomodate
the peak hourdemand, and
the rateswould
have toin-creasetopayforbuildingthis
"needed"
new
capacity.Under
an average pricing system, rateswould
skyrocket as the telephone
company
scrambled to keep upwith anew
construction program. Since theconsumer would
have no incentiveto be selectiveof the time of day hephoned
long distance, the wireswould
be flooded dailyand
the lines hopelesslytiedup, resultingeventuallyin "ringout"(comparabletoa
brown
or blackout).Thiswould
be followed bymore
construction
programs
and
more
rate increases. There is no disputeamong
conservative or liberal economiststhat peakload or marginalcostpricing isthe
most
efficientway
to allocate any resource,in-cluding electricity. Marginal costpricing is a
method
of pricing followed by electric utilities in nations
aroundtheglobe. Marginalcostpricingisfollowed by businessoperations throughoutthe United States. It
would
seem
such a system should be usedby North Carolina utilities.Footnotes
1
.
For a discussion of increasing costs and decreasing
economiesofscale, see:Leonard
W
Weiss,"AntitrustintheElectric Power Industry," in Promoting Competition in
RegulatedMarkets.-The Brookings Institution,Washington,
DC. 1975.
2. Federal Power Commission,Form 1, p. 409.
3 Duke Power Companyand the Federal Power Commission,
Form 1
.
4. The traditional theory of peak load pricing isthat the peak
users pay the marginal capital cost as well as marginal operating costs. See Berlin, Cicchetti, and Gilen, Energy Policy Project, Chapter3, 1974,also Alfred Kahn,"Between
Theory and Practice",PublicUtilitiesFortnightly,January2,
1975, pp. 29-33
5. Paul L. Joskowand Martin L.Baugham, "The Futureofthe
U.S. Nuclear Energy Industry", BellJournal ofEconomics.
Spring 1976, p. 17.
6. Anextensivediscussionofpeakload pricingmethods usedin
France and England appears in P. L. Joskow, et al.,
"Sym-posium on Peak Load Pricing", BellJournalofEconomics.
1976, pp. 197-240
7. CommonlycalledtheA-Jeffect,thisphenomenaisexplained
in Averich, H. and L.Johnson, "BehavioroftheFirmunder
Regulatory Constraint", American Economic Review,
December 1962
8. United States Nuclear Regulatory Commission, Final En-vironmentalImpactStatement,October 1975, Table9.1
9 Bureau of LaborStatistics,ConsumerExpenditure Survey.
10. Lester P.Taylor,"The Demandfor Electricity:
A
Survey",BellJournalofEconomics, Spring, 1975, pp. 74-110.
11. Adiscussionofhowtobest allocatemarginalcapacity costs to
prices at different time periods are discussed by John T
Wnders, "Peak Load Pricing inthe ElectricUtilityIndustry",
Bell Journal ofEconomics, Spring 1976, pp. 232-241. He
arguessomemarginal capacity costs should be includedatall
times.
12 Advertisement, Raleigh News and Observer, October 12,
1976