92
A closed-loop supply chain network design with considering
third party logistics: A case study
Beheshteh Moghadas Poor
1, Mohammad Saeed Jabal Ameli
1*, Ali Bozorgi-Amiri
21School of Industrial Engineering, Iran University of Science & Technology, Tehran, Iran 2 School of Industrial Engineering, College of Engineering, University of Tehran, Tehran, Iran
[email protected], [email protected],[email protected]
Abstract
Organizations are nowadays seeking competitive advantage over other rivals, reduction of costs, and customer satisfaction for their progress and development. One of the key factors in reaching the competitive advantage is to have a robust logistic system. The available complexities in the forward and reverse integration processes lead managers to take the companies offering third party logistics services as proper alternatives for outsourcing processes. Furthermore, with population growth and development of transportation network, the amount of scrap products related to this industry is increasing. One of the widely used products is tire which could cause irreversible damages to the environment if it is not logically and appropriately disposed after being fully used. Accordingly, this study proposed a period, multi-product, bi-objective mathematical model to design a closed-loop supply chain network in the tire industry concerning sustainability factors (economic and social) under the third party logistic management. The proposed model aimed at maximizing the profit made by different process over the scrap products and reaching social sustainability as well. Furthermore, the environmental impacts were controlled. The augmented epsilon-constraint method was implemented to solve the multi-objective model and reach optimal Pareto solutions. Finally, the proposed model was validated against a case study in the tire industry.
Keywords: Closed loop supply chain, reverse supply chain, third party logistics, recycling, tire
1-Introduction
The tire production is a high-tech and highly complex industry that has shown an ongoing trend of innovation over the past century. Also, the raw materials of tire are provided by metallurgy, textile, and chemical industries. Moreover, tire might be one of the best engineered products with a long lifespan that has ever been manufactured (Karagiannidis et al., 2010).
Since the transportation network is developing, the deterioration of its related products (e.g. tire) is growing as well. The statistics have shown that the annual amount of scrap tire is 17 million tons which is a non-degradable waste generated across the world.
*Corresponding author
ISSN: 1735-8272, Copyright c 2020 JISE. All rights reserved
Journal of Industrial and Systems Engineering Vol. 13, No. 1, pp. 92-110
93
This can inflict major damages to human, weather, and environment in general due to its contents, namely a high degree of black carbon, rubber, and other contaminants (Malijonyte et al., 2016). In this regard, to effectively manage new and scrap tires, coordinating the forward and reverse logistic networks is addressed as a concern in the value chain of tire industry (Pedram et al., 2017).
Leberton et al. (2006) introduced a numerical approach to evaluating the profitability of remanufacturing and recycling tires of personal vehicles and trucks. This study aimed to investigate two elements: 1. the extent of developing remanufacturing activities, 2. a decision-making model with objective of analyzing potential scenarios for enhancing the remanufacturing rate in the future. Chang et al. (2016) conducted a study on different methods of disposing tire based on the benefit-cost analysis, environmental effects, and their feasibility. In this respect, 4 different multi-criterion decision-making methods were applied to identify the best solution by the weighing system regarding criteria of benefit-cost analysis, environmental impacts, and energy generation. According to the literature, a limited number of studies have introduced a model to investigate all of the dimensions of integrated scrap tires process, namely remanufacturing, recycling, and application in different industries (e.g. civil and so forth). Therefore, an appropriate logistic network seems necessary for this industry, as well as the design of a closed-loop supply chain to reach not only sufficient benefit but also reduction of waste and sustainable development.
The subjects of “closed-loop supply chain” and “management of returns” are emerging issues in the field of logistics and supply chain management in different industries, which have not been seriously addressed so far in different industries of Iran. A closed-loop supply chain is classified as “forward flow” and “reverse flow”. The forward flow exists in the traditional freight flow and managers of industries generally focus on its control and management, i.e. managing activities and flows dealing with delivering goods from suppliers to producers and finally to the end users (Pedram et al., 2017). However, there is no extended definition for the reverse flow logistics due to their substantial complexity. Nevertheless, it can be stated that reverse logistics study a reverse operational flow that manage and control the consumed products and wastes during their production cycles (Sellitto et al., 2013). Therefore, due to the ability of value recovery from used and return products, the reverse logistics have cut the attention of many researchers as a key element in the supply chain.
Closed-loop logistic networks have become popular among many researchers due to the increase in the importance of raw materials saving, environmental factors, and state rules, and since it can be an approach to reaching competitive advantage. Pishvaee et al. (2010) conducted a study on the integration of forward and reverse parts of the supply chain with the goal of minimizing costs and maximizing the responsiveness to customers. Furthermore, Dehghanian et al. (2009) proposed a multi-objective programming model to design the recovery network of end-of-life products and presented many types of processing over non-usable tires. However, based on the literature review, a limited number of studies have addressed the closed-loop logistics in the tire industry.
One of the central problems in the investigation into supply chain in the present era is its sustainable development and management. Sustainable development meets the demands of current generation without weakening the capability of next generations to fulfill their needs. Sustainable development needs to simultaneously consider economic, social, and environmental facets. In this regard, few papers have addressed the social aspect in the tire industry and most of studies have been focused on other facets in this industry, as presented in what follows. Abdul-kader et al. (2011) carried out a study on the sustainable environmental advantages, increase in the tire remanufacturing percentage and its spillover on other key actors with the focus on the significance of sustainability and preservation of natural resources rather than direct concentration on economic factors.
Moreover, Subulan et al. (2014) proposed a model for the tire closed-loop supply chain by mixed integer programming concerning environmental issues. This model maximized the total profit of the closed-loop supply chain and minimizes the negative impact on the environment in this supply chain.
The integration of forward and reverse flows usually leads the closed-loop supply chain to be a more complex network than the forward flow (Yang et al., 2009). Also, since lifecycle of products is diminishing every day in the current trade age, it has been vital to properly manage used, damaged, and finally returned products. The complications available in the reverse and forward integration processes provoke managers to take the third-party logistics service provider companies as proper alternatives for outsourcing of the processes. One of the main merits of outsourcing is the concentration of organizations on their key abilities whereby they could enhance their productivity. In
94
addition, growing opportunities for reducing costs and satisfying customers have triggered third-party logistics service provider companies to become active in forward and reverse logistic operations. Third-part logistics companies are external organizations that are in charge of managing, controlling, and executing a part or entire logistics affairs delivered to their customers (manufacturers) (Tezuka 2011). It is worth noting that third-party logistics are being increasingly employed due to different factors including globalization, development of new information technologies, market pressure for enhancement of services offered to customers, necessity of competitive advantage, pressure on companies to cut prices, high logistics costs for companies, and so forth (Ko et al., 2007). One of the applications of third-part logistics is embedded in the transportation industries and its dependent elements such as automobile and tire. Due to the intricacies of production processes, a dramatic decrease occurs in the sufficient focus of producers on goods distribution, concern for meet customers’ demands, and abundance. Hence, outsourcing of tire-related processes plays a crucial role in its industry. However, few studies (e.g. Mahmoudzadeh et al. 2013) have addressed this subject. Also, Zhang et al. (2007) proposed a model for optimal outsourcing of reverse flow to third-party logistics. In this mode, third-party logistics are obligated to transfer scrap goods from customers to remanufacturing and burial centers.
Above all, the present study proposes a multi-period multi-product bi-objective mathematical model to design a sustainable closed-loop supply chain in the tire industry under the third-party management. The main innovations of the present paper differentiating it from past studies are as follows:
Investigation into the outsourcing of logistics activities to the third-party providers, including distribution of products and supplying raw materials generated by recycling
Investigation of the supply chain under the management and profitability of the third party logistics.
Considering various levels of managing scrap products, such as the consumption of the third-party applications to sell materials from recycling it.
Providing the possibility of using materials from recycling in the chain itself, this saves more cost for producers and competitive advantage of the third party than other suppliers.
Considering the economic and social sustainability.
Implementation of the presented model in a real-world case study.
The next sections of the paper are as follows: in the second section, we describe the problem and in the third section, mixed-integer programming model is proposed for the problem. we describe the Solution procedure in the fourth section and case study, method and results in the fifth section. Finally, the results and future suggestions are presented in the sixth section.
2-The statement of the problem
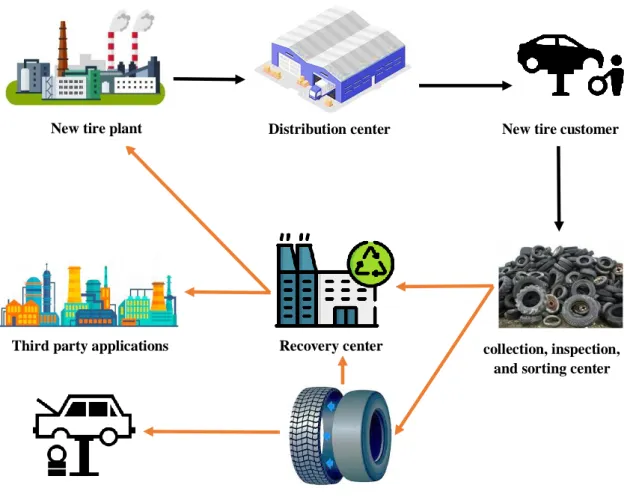
The designed third-party logistics network of this study is 10-level according to Figure.1, which consists of third-party logistics customers (new tire plant), distribution centers, new tire costumers (that can include the costumers and retailers), collection, inspection and sorting centers, recycling facilities, remanufacturing centers and third-party applications that include different industries of tire industry such as construction industries, and finally the secondary market (retreaded tire customer). In this research, the management of all cases including the establishment of necessary facilities, management of flows etc. from the perspective of the third-party providers is considered.
95
Fig 1. Closed loop supply chain network
The logistics service provider (3pl) has the responsibility of distributing the products, delivery to the receiving points and, in fact, an important part of the logistics activities of the producer according to its customer. According to the demand of customers, 3pl delivers products from the producer, transfer products to its distribution warehouses and try to deliver products according to the minimum cost of transportation. Since the number of products delivered from the producer in order to satisfy the demand of customers is on third-party logistics, the cost of the shortage due to the unmet demand for customers is on third-party logistics, too. Thereupon, the customers return the used and scrap products to the chain with a certain percentage being obtained according to experience. Third-party logistics takes part of the scrap products that customers are planning to return to the cycle simultaneously with the delivery of new products and transfer them to a collection, inspection, and sorting center. It's worth noting that for another part of the scrap products that the costumers didn't deliver to third-party logistics, the cost is imposed as a fine to third-party logistics. In the center of collection, inspection and sorting, the sorting process is carried out according to the quality level of products and a certain percentage of them will be transferred to remanufacturing and recycling centers. The products that are sent to the remanufacturing centers usually have a higher quality level than the other products and can be reused after the simple repair. These repaired products are sold to the secondary market at a lower price than the new ones, and if third-party logistics fails to meet some of the demand for the secondary market, the cost of the shortage will be followed. In addition, the amount of waste of the repair and remanufacturing process is transferred to recycling facilities. The products that are sent to recycling facilities are recycled and recycling materials can be transported as raw materials to associated production centers (tires), or they can be sold for third-party application (other industries such as construction industries, floor-covering production, etc.).
New tire plant Distribution center New tire customer
collection, inspection, and sorting center Recovery center
Third party applications
Remanufacturing center Retreaded tire customer
96
That portion of raw materials that are transported to the factories in addition to generating revenue for third-party logistics makes the factory supply the required raw materials at a lower price than any other supplier. As a result, if third-party logistics fails to provide a portion of the required raw material, it will be imposed as a loss of credit. Other assumptions are as follows:
Briefly, in a contract that is set between third-party logistics and its customers (manufacturers), third-party logistics will undertake to provide the distribution of products with forward flow in order to supply their customers demand and to minimize the lack of demand, and also in the reverse flow, the return products from customers and supply some of the required raw materials for the production of tire at lower price than other suppliers. The profits of selling products that are sold in reverse supply chains by carrying out different processes on scrap tires such as selling tires to the secondary market and selling material from recycling to third-party applications belong to the third-party logistics.
The model is a multi-product and multi-period model.
The locations of primary and secondary consumers are known and constant.
The potential locations of distribution, collection, remanufacturing under the ownership of third-party logistics are known.
The numbers of facilities that can be enabled are limited.
The capacity of distribution, collection, remanufacturing, recycling centers and third-party applications is considered to be limited.
The shortages are considered as lost for primary and secondary customers.
The shortage cost depends on the amount and time of the shortage.
The amount of return of the tires is dependent on the primary customer's demand in each period.
The quality of new and retreated products is different, so the price of these products is also different.
Primary customers of the producers covered by third-party logistics and secondary market and third-party applications, customers of third-party logistics itself.
The government subsidizes per tire that is collected, recycled, and remanufactured.
The emission of carbon dioxide during recycling and remanufacturing processes should be less than permitted by the government.
The remaining stock at the end of the periods and consequently the maintenance cost is not considered.
In the proposed model, the decisions taken are as follows:
Location of distribution warehouses, collection, separation and inspect centers, and remanufacturing centers.
Flow rate between different levels in the supply chain
Lack of demand for primary and secondary customers
Amount of scrap products that are not collected by third-party logistics Likewise, the sustainability aspects of the model are considered as follows:
Economy: This aspect is considered as an objective function in the proposed model. In particular, the objective function includes the profits of selling retreated tires to the secondary market, profits from selling raw materials to factories, government subsidies, and minimizing the costs of supply chains.
Social: This aspect is considered as maximizing social effects in the form of another objective function in the model. In other words, the objective function seeks to maximize the factors including job development, local development and minimize occupational damages.
3-The proposed mathematical model
Prior to the proposed model, the sets, parameters and decision variables used in the model will be considered as follows:
97
3-1- Model sets and indexes
set of new tire plants
F
set of potential locations for distribution centers
D
set of new tire customer
C
set of collection, inspection and sorting centers
A
set of potential locations for remanufacturing centers
Q
set of time periods
T
set of capacity levels available for the potential facilities
H
set of tire types or family
M
set of recycling facilities
R
set of third party applications
B
set of retreaded tire customer
G
3-2- Model parameters
demand of new tire customer c for new tire type m in period t
cmt D
demand of retreaded tire customer g for retreaded tire type m in period t
gmt D
The income achieved from distribution and delivery of each product to new tire customer c in period t
ct Rev
unit selling price of the retreaded tire type m to a retreaded tire customer
mt Price
unit selling price of recycled materials from recycling facility r to third party application b in period t
bt
Price
purchasing cost of per unit weight of raw material for new tire producer from another suppliers
price
fixed set-up cost of the remanufacturing centers q with capacity level h
qh
F
fixed set-up cost of the distribution centers d with capacity level h
dh
F
fixed set-up cost of the collection centers a with capacity level h
ah
F
distance from new tire plant f to distribution center d
fd
DS
distance from distribution center d to new tire customer c
dc
DS
distance from new tire customer c to collection center a
ca
DS
distance from collection center a to recycling facility r
ar
DS
distance from collection center a to remanufacturing center q
aq
DS
distance from remanufacturing center q to recycling facility r
qr
DS
distance from remanufacturing center q to retreaded tire customer g
qg
DS
distance from recycling facility r to new tire plant f
rf
DS
manufacturing Capacity at the new tire plant f in period t (hour) t
FC
Remanufacturing Capacity at the remanufacturing center q in period t (hour)
qt
RFC
recycling Capacity at the recycling facility r in period t (hour)
rt
RDC
Storage capacity of distribution center d with capacity level h
dh
DC
Storage capacity of collection center a with capacity level h
ah
AC
Storage capacity of remanufacturing center q with capacity level h
qh
RC
Storage capacity of recycling facility r
r
98
remanufacturing cost of per unit of used tire type m in remanufacturing center q in period t
qmt
QFC
recycling cost of per unit weight of used tire in recycling facility r in period t
rt
RFCO
inspection and sorting cost per unit of used tire type m through the collection center a in period t
amt
DAC
The cost of the unsatisfied demand of delivery point for product type m in period t
mt
SC
manufacturing time of per unit of new tire type m in hours m
FH
Remanufacturing time of per unit of used tire type m in hours at remanufacturing center q
qm
RFH
Recycling time of per unit of used tire type m in hours at recycling facility r
rm
RDH
unit transportation cost per kilometer
TC
rate of return of used tire type m
m
RR
fraction of used tire type m satisfying the quality specifications for remanufacturing process
m
RRm
fraction of used tire type m satisfying the quality specifications for recycling process
m
RRc
Fine for not collecting scrap tire type m from new tire customer c in period t
cmt
Ps
Government subsidies for collecting of per unit scrap tire type m
gov m Ca
Government subsidies for recycling of per unit scrap tire type m
gov m Cr
Government subsidies for remanufacturing of per unit scrap tire type m
gov m Cq
weight of the tire type m
m
W
Holding Capacity of third party application center b
b
C
Holding Capacity of new tire plant f
f
C
Carbon emission unit in recycling process
r e
Carbon emission unit in remanufacturing process
q
e
Employment score of potential locations of distribution center d
d
Em
Employment score of potential locations of collection center a
a
Em
Employment score of potential locations of remanufacturing center q
q
Em
Local development score of potential locations of distribution center d
d
Ld
Local development score of potential locations of collection center a
a
Ld
Local development score of potential locations of remanufacturing center q
q
Ld
occupational damage score of potential locations of distribution center d
d
Dm
occupational damage score of potential locations of collection center a
a
Dm
occupational damage score of potential locations of remanufacturing center q
q
Dm
Normalized weight of employment
1
W
Normalized weight of local development
2
W
Normalized weight of hazardous work conditions
3
W
Carbon emission limit L
Portion of raw material for manufacturing per unit of new tire type m m
99
3-3- Model variables
1, if a remanufacturing center is opened at location q with capacity level h
0, otherwise
qh
XQ
1, if a collection, inspection and sorting center is opened at location a with capacity level h
0, otherwise
ah
XA
1, if a distribution center is opened at location d with capacity level h
0, otherwise dh
XD
quantity of brand new tire type m shipped to distribution center d from new tire plant f in period t
fdmt
Q
quantity of brand new tire type m shipped to new tire customer c from distribution center d in period t
dcmt
Q
quantity of used tire type m shipped to collection center a from new tire customer c in period t
camt
Q
quantity of used tire type m shipped to remanufacturing center q from collection center a in period t
aqmt
Q
quantity of used tire type m shipped to recycling facility r from collection center a in period t
armt
Q
amounts of materials shipped to recycling facility r from remanufacturing center q in period t
qrt
Q
amounts of recycled material sold from the recycling facility r in period t
for third party application b
rbt
Q
Quantity of unsatisfied demand of new tire m at new tire customer c in period t
cmt
SD
Quantity of unsatisfied demand of retreaded tire m at retreaded tire customer g
in period t
gmt
SG
Quantity of used tire type m not collected from new tire dealer c in period t
cmt
V
Quantity of raw materials that new tire plant purchased from another supplier
100
3-4- The proposed mathematical model
Objective function1 dcmt ct qgmt mt rbt bt
q,g,m,t q,g,m,t r,b,t
gov gov
rft m camt armt m qrt
r, f,t c,a,m,t a,r,m,t
gov m aqmt a,q,m,t
dh dh ah ah qh qh
d,h a,h q,h
Max Z =
Q
.Rev +
Q
. price +
Q .price
+
Q .price.0.3+
Ca
.Q
+
Cr
.(Q
.w + Q
)
+
Cq
.Q
F . XD +
F .XA +
F . X
+
SC
-
mt cmt mt gmt camt amt
c,m,t g,m,t c,a,m,t
aqmt qmt armt m rt qrt rt
a,q,m,t a,r,m,t q,r,t
fdmt fd aqmt aq camt ca
f,d,m,t a,q,m,t c,a,m,t
qgmt qg
q,g,
.SD
+
SC .SG
+
Q
.DAC
+
Q
.RFCO
+(
Q
.w .RPC +
Q .RPC )
+
Q
.TC .DS +
Q
.TC .DS +
Q
.TC .DS
+
Q
.TC .DS
qrt qr dcmt dc
m,t q,r,m,t d,c,m,t
armt m ar rft rf
a,r,m,t r, f,t
cmt cmt c,m,t
+
Q .TC.DS +
Q
.TC .DS
+
Q
.TC .DS +
Q .TC .DS
+
V
.Ps
+ of.price
(1) (2) 2 1 2 3q q a a d d q q a a d d q q a a d d
Max Z = w .(Em .X + Em .XA + Em .XD ) + w .(Ld .X + Ld .XA + Ld .XD )
- w .(Dm .X + Dm .XA + Dm .XD )
In equation (1) the goal is to maximize profits. The revenue of this model includes revenue from third-party logistics commitment to the producers for distribution of per products and supply demands of costumers, selling retreated products to the secondary market, selling materials from recycling to the third-party applications and selling raw materials to the factories of the chain, the subsidies that the government assigns for collecting of per unit of scrap products, recycling of any waste unit and remanufacturing of a scrap products to third-party logistics. The present costs include: the cost of establishment of facilities such as the distribution, collection, and remanufacturing, the costs of shortages to respond the demands of primary and secondary customers, the cost of separation and inspect on the collection centers, the costs of remanufacturing process in the remanufacturing centers, the costs of recycling at the recycling centers, the costs of transportation between various facilities, the fines of lack of collection of part of scrap products, and fines of lack of supplying part of the required raw materials for related factories.
In equation (2) the purpose is to maximize the social dimensions of the model, which include factors like occupational development, local development, and occupational damage. In this way, each of the potential sites for the establishment of facilities likes distribution, collection and remanufacturing have the advantages from the perspective of the three mentioned factors that if the relevant facility is activated that advantage would be achieved. Finally, weighting will be assigned for each factor.
101
3-5- Constraints
, , , , , , , ,
.(
)
.
r armt qrt q aqmt
a r m t q r t a q m t
e
Q
Q
e
Q
L
)3(( ).
camt cmt
dcmt ma d
Q V Q RR c m t, , )4(
camt armt aqmt
c r q
Q Q Q
a m t, , )5(.
camt m
aqmtc q
Q RRM Q a m t, , )6(
.
camt m
armtc r
Q RRC Q a m t, , )7(
. .
aqmt m
qrt
qgmt ma r g
Q W Q Q W q m t, , )8(
.
armt m qrt rft rbt
a q f r
Q W Q Q Q
r m t, , )9(. .
rft m m
fdmtr d
Q S of S Q f t m, , )10(
dcmt cmt cmtd
Q SD D c m t, , )11(
qgmt gmt gmtq
Q SG D g m t, , )12(
,
.
fdmt fm ftd m
Q FH FC f t, )13(
,
.
aqmt qm qta m
Q RFH RFC q t, )14(
, ,
( . ).
armt m qrt r rta m q
Q w Q RDH RDC r t, )15(
rft fr
Q of C f t, )16(
,
.
camt
ah ahc m h
Q AC XA a t, )17(
,
.
aqmt
qh qha m h
Q RC X q t, )18(
,
.
fdmt dh dh f m h
Q DC XD
d t, )19(,
.
armt m
qrt ra m q
102
rbt bt
Q C r b, )21(
,
dhd h
XD D )22(
,
aha h
XA A )23(
,
qhq h
X Q )24(
1
dhh
XD d )25(
1
ahh
XA a )26(
1
qhh
X q )27(
qh
XQ
,
XAah,
XDdh
0,1 )28(ijmt
Q
,Q
ijt, SDcmt,SG
gmt, Vcmt ,of
0
)29(In constraint (3), it has dealt with the fact that the amount of emission of carbon dioxide gas in recycling and remanufacturing processes should be lower than the amount allowed by the government. Equations (4) to (10) are the balancing constraints in the supply chain. Equation (4) states that customers tend to return a certain rate of their demand to the supply chain, from which the portion is collected by third-party logistics, transferred to collection centers, and the other portion is not collected. Equation (5) states that the total scrap products that are collected and transferred to each collection center are equal to the flow from this center to different facilities, including the flow towards the center of remanufacturing and recycling centers. The flow rate towards these centers can be seen in equations (6) to (10). The constraints of (11) and (12) are the constraints of demand for primary and secondary customers, respectively. Each unit that is processed in the manufacturing, remanufacturing and recycling centers involves part of the capacity of the center in terms of time. As a result, the total processing time on products must be less than an hourly load of the desired center. Equations (13) to (15), respectively, present these constraints of manufacturing, remanufacturing and recycling centers. Equations (16) to (21) show the constraints of the capacity of different facilities. The constraints (22) to (24) ensure that the number of established facilities including distribution, collection, and remanufacturing centers is not higher than the number specified in the parameters sections. However, in equations (25) to (27), each facility should be established only with one capacity level. In equations (28) and (29), the positive, and the binary variables are determined.
4-Solution procedure
In multi-objective problems with opposite functions, it is impossible to obtain an answer that satisfies all functions simultaneously. In such problems, the focus is on Pareto's solutions. In other words, there are solutions that don't improve any of the functions without at least one of the functions becomes worst. There are different approaches to solve multi-objective optimization problems such as weighting method, goal programming, etc., but for different reasons such as lack of access to weights defined by the determiner or lack of access to goals, these methods do not have the sufficient effectiveness (Rabbani et al. 2020). As a result, in this paper, an augmented epsilon-constraint method is used to solve the model. Mavrotas et al. (2009) presented the augmented epsilon-constraint method
103
to solve multi-objective problems. This method has been tried to solve the problems of conventional epsilon method.
The augmented epsilon-constraint method is amongst the most efficient and powerful multi-objective approaches (Mansouri 2015).
The advantage of this method is that it is not necessary to make different objective functions homogeneous, and no matter the difference between objective functions, the results are optimal. Also by changing epsilon we can create new spaces in the model solution and provide a variety of Pareto's solutions and finally sensitivity analysis. The approach of this method is that, in situations where the problem has multi solutions, we avoid these solutions. In this method, the model is converted to:
1x 1 2 p
2 x 2 2 3 x 3 3
x p p
Maz f +eps .(s + s + ....+ s )
s.t : f - s = ε
f - s = ε
. .
fp - s = ε
x s
In these equations, is a small constant number between and , which is used to remove units. Also, the s are also lack or surplus variables with a positive value. In this paper, we solve the model mentioned in Section 3-4 by the augmented epsilon-constraint method.
5-Case study
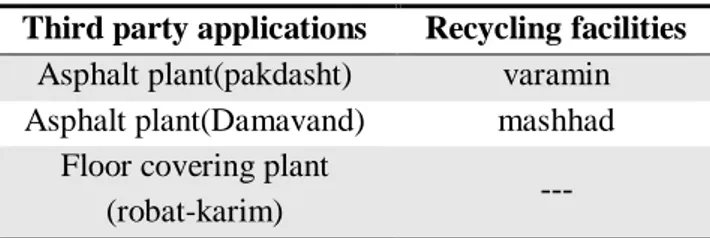
In this section, a supply chain of a tire producer in Iran is considered to produce two types of tires and outsources some of its forward and reverse logistics activities. Regarding customers, receiving or demand points, in this study is Tehran. The third-party logistics company, in this case study, has the responsibility of distributing products in forward flow according to the contract to its customers, while is responsible for the reverse flow of scrap tires includes recycling, remanufacturing, etc., as well as providing the inexpensive raw material that can be achieved by the recycling process for the producer. In addition, third-party logistics earn revenue by means of recycling or selling scrap tires. The information related to the producer, third-party logistics, candidate locations for the construction of facilities and other information required in this case study is obtained via the company, related sites, and queries from experts in this industry. As a result, the location of recycling centers is quite clear and does not need to be located. Also, the third-party applications of the model are shown in Table 1.
Table 1. Recycling facilities and third party applications
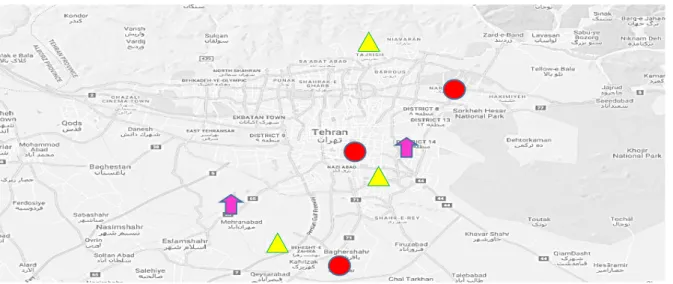
The next level consists of the distribution, the collection and the remanufacturing centers are located by the model. In order to obtain appropriate locations for each of the facilities in Tehran, three potential locations for distribution centers, 3 locations for centers of collection, and 2 locations for remanufacturing centers are considered each of which with two capacity levels, according to Figure 2:
Recycling facilities Third party applications
varamin Asphalt plant(pakdasht)
mashhad Asphalt plant(Damavand)
---Floor covering plant
104
Fig 2. Potential locations
The location of 16 points of demand and receive in Tehran city, each has certain demands, as well as their location from the pre-specified location is defined as Figure 3 on the map:
Fig 3. Customer zones
Since, one of the objective functions of the model consists of social factors, with the help of social experts and practitioners in the tire industry, the weight of each of the factors of occupational development, local development, and occupational damages are determined:
Table 2. Coefficients of social factors in the second objective function
Among the entire network levels, the facilities the model seeks to locate, each having the capacity, cost, and the scores of social dimensions are identified. The facilities available in the model are also accessible.
occupational development local development
occupational damages
1 W =0.5
2 W =0.3
3
W =0.2
Potential location for distribution center Potential location for collection center Potential location for remanufacturing center
105
The return rates of scrap tires from the receiving points, the appropriate rates of tires for recycling and remanufacturing centers which are obtained using research and interview with the municipal waste management organization of Tehran, the Iranian recycling community, experts and industry managers, and according to the statistics and used in the model is presented in the table 3:
Table 3. The assumed rates of the model
2
t
1
t Rate
0.8 0.9 rate of return of used tire
0.6 0.7 rate of used tire for remanufacturing process
0.4 0.3 rate of used tire for recycling process
To ensure about the model, these rates are considered as the intervals:
Table 4. The assumed rates of the model in forms of the interval
2
t
1
t Rate
(0.7,0.9) (0.8,0.9)
rate of return of used tire
(0.6,0.7) (0.7,0.8)
rate of used tire for remanufacturing process
(0.4,0.3) (0.3,0.2)
rate of used tire for recycling process
5-1- solution result
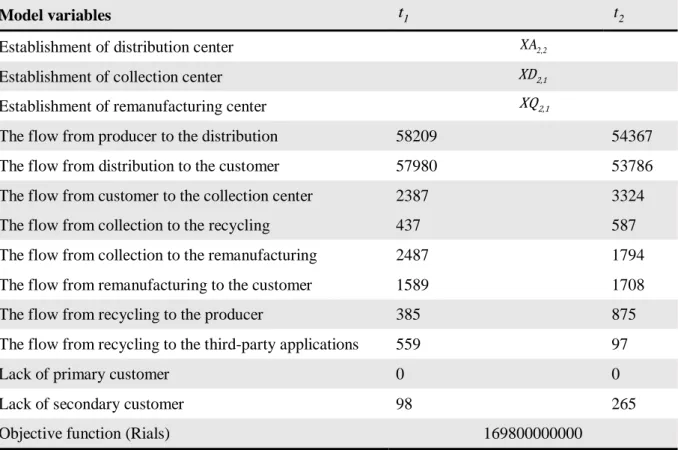
The model was solved with the aforementioned data by the augmented epsilon-constraints at the highest epsilon level by the GAMS software and the results were investigated. Also, all experimental tests were carried out using a laptop with the Core i7 CPU, 2.5 GHz, and 4 GB of RAM. The results are presented in the table 5:
Table 5. Solution Results: value of decision variables
Model variables t1 t2
Establishment of distribution center XA2,2 Establishment of collection center XD2,1
Establishment of remanufacturing center XQ2,1
The flow from producer to the distribution 58209 54367 The flow from distribution to the customer 57980 53786 The flow from customer to the collection center 2387 3324 The flow from collection to the recycling 437 587 The flow from collection to the remanufacturing 2487 1794 The flow from remanufacturing to the customer 1589 1708 The flow from recycling to the producer 385 875 The flow from recycling to the third-party applications 559 97
Lack of primary customer 0 0
Lack of secondary customer 98 265
106
One of the important sections in the studied supply chain is the supply of raw materials to the supplier from the recycling plant of the supply chain. Since the cost of supplying the raw material from the recycling facilities of the supply chain is far less than the cost of the raw supplying material from other suppliers. As a result, we observe that the flow from the recycling center to the supplier can be activated with a good numerical value. In addition, it is observed after solving the model that the demand for the secondary market, which is one of the main objectives of third-party logistics to earn revenue, is in the lowest amount of shortage according to table 5. This is an important result for this model, because retreated tires have lower prices than new tires, thus increasing customers' tendency to such tires. Also because the distribution and supply of demand of primary customers were outsourced and applied to third-party logistics, the shortage becomes zero. This result indicates that the main effect of using third-party logistics and outsourcing part of its logistical activities.
5-2- The contradiction to the objective functions
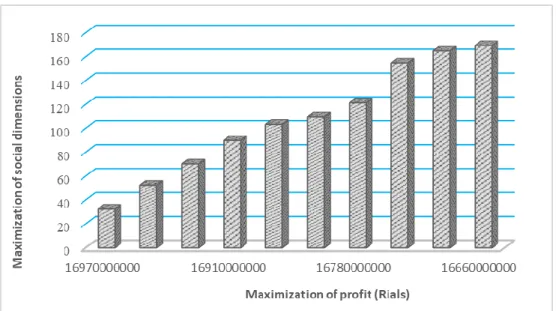
In the proposed model, two objective functions were introduced, in the first objective function, we tried to maximize the profits of the third-party logistics company and also maximize the social impact of the network in the second objective function that results in maximizing occupational and local development in facilities and minimize occupational damage. As in figure 4, which is plotted using different epsilons, the first objective function (profit maximization) and the second objective function (maximization of social dimension) are in contradiction with each other.
In the case of conflict between the two objective functions, the objective function of profit seeks to maximize the efforts to reduce the cost of the establishment of different facilities, but the social objective function tries to build more facilities because it tends to maximize the social impacts. When there are less active facilities in the first objective function, the amount of second objective function is reduced that includes occupational and local development resulting from the establishment of facilities, and the first objective function is reduced if there are more active facilities in the second objective function. In general, this contradiction is because the logistic model seeks to maximize occupation and development in locations that are less advanced and have poor technology and facilities, and there is more cost of establishment of facilities.
107
5-3-Verification, analysis of complexities and sensitivity of the model
5-3-1-VerificationIn this section, in order to validate the verify, the establishment of remanufacturing centers, which was evaluated in order to use scrap tires in the useful direction as well as supply secondary market demand in this study, and its location and optimal capacity was determined in the model, was eliminated from the model and the model was considered without the location of the remanufacturing centers. The results and the amount of objective function value are investigated; the objective function is presented in table 6.
As shown in table 6 with the elimination of remanufacturing centers، even though the cost of establishment is eliminated, however, the cost of the shortage of secondary market demand, the profits of subsidies that the government assigns to the remanufacturing for the supply chain, as well as the social advantages of the establishment of remanufacturing centers, was such that the objective function was converted to negative value. Thus, by comparing the main objective function with the new objective function, it can be concluded that the model has a high validation.
Table 6. Comparison between the supply chain total profit considering remanufacturing center
Objective function
without the remanufacturing center
Objective function with remanufacturing center
-1084500000 169800000000
5-3-2- Sensitivity analysis due to the variation of numbers of collecting, separation and inspect centers
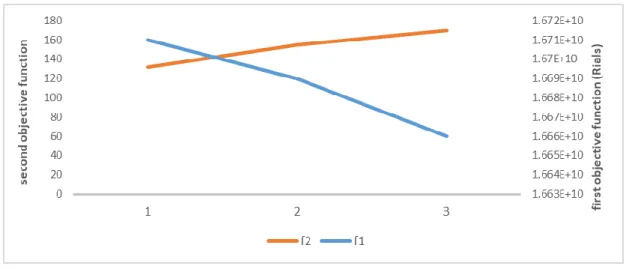
Figure 5 shows the sensitivity analysis of the number of potential locations to establish the collection centers under the first and second objective functions at the highest epsilon level. To this end, we have increased the number of collection centers from one to three. The results of the sensitivity analysis are shown in the diagram. As observed, by increasing the number of collection centers that can be established, the first objective function has been reduced and the second objective function has been increased. The main reason is that the more facilities are established, the more cost will be imposed on the model and as a result of the first objective function that is profit is reduced, while the more facilities are activated, the more social dimensions are activated, thus it is increasing.
5-3-3- Model complexity
The complexity and time required to solve the model depend on different factors. Key factors of the complexity of this model can be the number of time periods as well as the number of possible facilities for establishment. The proposed model is generated by random data, and by increasing the
108
mentioned items in the GAMS software was investigated. The results of complexity are shown in the table 7:
Table 7. Model complexity
Periods and potential location
1 20
50 100
Time solution
0.972 second 15
second 57
second 360
second
As shown in table 7, The results show increasing the number of periods and the number of proposed locations for the establishment of facilities, the solution time is increased in the software.
6-Conclusion and future research
As mentioned, due to population growth and greater utilization of the transport network, the depreciation of the subset of the tire is increasing and because the tire is a non-degradable product, the lack of attention to scrap tires and proper management can cause environmental damage. The landfilling has also been banned in many countries, including Iran. At the same time, with regard to environmental issues, utilization of different industries from scrap tires as raw materials or fuel, low price of remanufactures tires and market demand for this tire, creating employment, complexity of return flows and the importance of outsourcing can be an explanation of network creation to recycle and remanufacture of scrap tires. Therefore, in this paper, we tried to provide a logistical network for the providing companies of third-party logistics services of the tire industry with regard to different uses of scrap tires, as well as with economic issues, social dimensions of a supply chain are also considered. Therefore, in this study, a two-objective, multi-product and multi-period mathematical model was proposed for the design of closed-loop supply chain network in the tire industry, under the management of the third-party logistics. The proposed model aims to maximize profits from different processes and maximize the purposes of social sustainability. In order to solve the multi-objective model and obtain Pareto's optimal solutions, the augmented-epsilon constraints model is used.
In order to validate the proposed model, a case study is applied in the tire industry through which the validity and applicability of the presented model were represented and important managerial results were obtained. For example, tire industry manufacturers and other similar industries can be used to meet their customer's demands and minimize the lack of outsourcing services in different sectors and are successful in supply chain management. In addition, the third-party logistics service providers are capable of using the model and the results of this research in order to optimize its network design, which makes more revenue and competitive advantage than other competitors. According to the literature, different proposals can be offered for future research, some of which are mentioned below:
Applying uncertainty to problems and model such as uncertainty of the rates of scrap product return, rate of scrap products appropriate for remanufacturing, recycling, and landfilling.
Consider a lack of demand as lag.
Applying an inventory in different facilities in the model and therefore cost of maintenance etc.
Considering the radius covered for the distribution of products to customers in terms of distance or time.
Considering the social pollutants, such as visual, auditory etc.
References
Chang, S. Y., & Gronwald, F. (2016). A Multi-Criteria Evaluation of the Methods for Recycling Scrap Tires. The Journal of Solid Waste Technology and Management, 42(2), 145-156.
109
Dehghanian, F., & Mansour, S. (2009). Designing sustainable recovery network of end-of-life products using genetic algorithm. Resources, Conservation and Recycling, 53(10), 559-570.
de Souza, C. D. R., & Márcio de Almeida, D. A. (2013). Value chain analysis applied to the scrap tire reverse logistics chain: An applied study of co-processing in the cement industry. Resources, Conservation and Recycling, 78, 15-25.
de Souza Abdul-Kader Subulan, W., & Haque, M. S. (2011). Sustainable tyre remanufacturing: an agent-based simulation modelling approach. International Journal of Sustainable Engineering, 4(4), 330-347.
Karagiannidis, A., & Kasampalis, T. (2010). Resource recovery from end-of-life tyres in Greece: a field survey, state-of-art and trends. Waste Management & Research, 28(6), 520-532.
Ko, H. J., & Evans, G. W. (2007). A genetic algorithm-based heuristic for the dynamic integrated forward/reverse logistics network for 3PLs. Computers& Operations Research, 34, 346–366.
Lebreton, B., & Tama, A. (2006). A quantitative approach to assessing the profitability of car and truck tire remanufacturing. International Journal of production economics, 104(2), 639-652.
Malijonyte, V., Dace, E., Romagnoli, F., Kliopova, I., & Gedrovics, M. (2016). A comparative life cycle assessment of energy recovery from end-of-life tires and selected solid waste. Energy Procedia, 95, 257-264.
Mahmoudzadeh, M., Mansour, S., & Karimi, B. (2013). To develop a third-party reverse logistics network for end-of-life vehicles in Iran. Resources, Conservation and Recycling, 78, 1-14.
Rabbani, M., Hosseini-Mokhallesun, S. A. A., Ordibazar, A. H., & Farrokhi-Asl, H. (2020). A hybrid robust possibilistic approach for a sustainable supply chain location-allocation network design. International Journal of Systems Science: Operations & Logistics, 7(1), 60-75.
Mavrotas, G. (2009). Effective implementation of the ε-constraint method in multi-objective mathematical programming problems. Applied mathematics and computation, 213(2), 455-465. Torabi, S. A., Baghersad, M., & Mansouri, S. A. (2015). Resilient supplier selection and order allocation under operational and disruption risks. Transportation Research Part E: Logistics and Transportation Review, 79, 22-48.
Pedram, A., Yusoff, N. B., Udoncy, O. E., Mahat, A. B., Pedram, P., & Babalola, A. (2017). Integrated forward and reverse supply chain: A tire case study. Waste Management, 60, 460-470. Pishvaee, M. S., Farahani, R. Z., & Dullaert, W. (2010). A memetic algorithm for bi-objective integrated forward/reverse logistics network design. Computers & operations research, 37(6), 1100-1112.
Sellitto, M. A., Kadel Jr, N., Borchardt, M., Pereira, G. M., & Domingues, J. (2013). Rice husk and scrap tires co-processing and reverse logistics in cement manufacturing. Ambiente & Sociedade, 16(1), 141-162.
Subulan, K., Taşan, A. S., & Baykasoğlu, A. (2014). Designing an environmentally conscious tire closed-loop supply chain network with multiple recovery options using interactive fuzzy goal programming. Applied Mathematical Modelling, 39(9), 2661-2702.
110
Torretta, V., Rada, E. C., Ragazzi, M., Trulli, E., Istrate, I. A., & Cioca, L. I. (2015). Treatment and disposal of tyres: two EU approaches. A review. Waste Management, 45, 152-160.
Tezuka, K. (2011). Rationale for utilizing 3PL in supply chain management: A shippers' economic perspective. IATSS Research, 35(1), 24-29.
Yang, Y., Min, H., & Zhou, G. (2009). Theory of constraints for recycling automobile tyres in the reverse logistics system. International Journal of Integrated Supply Management, 5(2), 158-172. Zhang, Y., Xie, L., Hang, W., & Cui, X. (2007, August). A robust model for 3PLS to design a remanufacturing logistics network under the uncertain environment. In 2007 IEEE International Conference on Automation and Logistics (pp. 367-372). IEEE.