Building Bridges Between Toxicity Testing in the 21st Century and Regulatory Decision-making Through Interactive Web Applications
Sean Mackey Watford
A technical report submitted to the faculty of the University of North Carolina at Chapel Hill in partial fulfillment of the requirements for the degree of Master of Science in
Public Health in the Department of Environmental Sciences and Engineering.
Chapel Hill 2014
Approved By
ii Abstract Sean Watford
Building Bridges Between Toxicity Testing in the 21st Century and Regulatory Decision-making Through Interactive Web Applications (Under the direction of Matthew Martin
and Ivan Rusyn)
Risk assessments and regulations are informed largely from animal studies, which are low throughput, costly, and time consuming. Gathering toxicity data for decisions on the large number of chemicals manufactured and used in commerce is a difficult task for current goals in chemical testing and safety decisions. Alternative approaches include computer models informed by existing toxicity data and computational toxicology like high throughput screening (HTS). Aggregating the large quantity of data produced through alternative methods is a difficult task with large gaps between the analysis and interpretation. The United States Environmental Protection Agency’s (USEPA)
iii
Acknowledgements and Dedication
I would like to thank my mentor Dr. Matthew Martin for all the time taken to help create a path for me within computational toxicology. Dr. Martin was responsible for most of the data management for iCSS. I would also like to thank Jeff Edwards, who has given me the resources and knowledge to become a successful software developer. Without the work Jeff put into the project, it would not have been nearly as successful. Jeff is the project lead for iCSS and wrote and designed the middleware code for iCSS. I would also like to thank my advisor Dr. Ivan Rusyn for his great insight into toxicology and
v
Table of Contents
Abstract ... ii
Acknowledgements and Dedication ... iii
List of Tables and Figures ... vii
Chapter 1 Literature Review of Computational Toxicology ... 2
Purpose ... 2
Data Sources ... 1
Aggregated Computational Toxicity Reference (ACToR) ... 1
Comparative Toxicogenomics Database (CTD) ... 3
Carcinogenicity Potency Database (CPDB) ... 3
Chemical Effects in Biological Systems (CEBS) ... 4
Distributed Structure-Searchable Toxicity (DSSTox) ... 4
Models and Use of Computational Toxicology ... 5
Toxicity Forecaster (ToxCast) and Toxicity Testing in the 21st Century (Tox21) ... 5
Quantitative Structure Activity Relationship (QSAR) and Read-Across ... 6
Physiologically-Based Pharmacokinetic (PBPK) Models ... 6
Threshold of Toxicological Concern (TTC) ... 7
Challenges ... 8
Current Work ... 9
Chapter 2 Introduction: Bridging the Gap ... 8
Chapter 3 Materials and Methods ... 10
Dataset ... 10
Frameworks ... 13
Architecture ... 13
Front-End ... 13
Middle Ware ... 16
Chapter 4 Results ... 21
Interactive Chemical Safety for Sustainability (iCSS) Dashboard Beta Release ... 21
Home ... 22
Assay Selection ... 24
Use Case ... 24
Chemical Selection ... 26
Use Case ... 26
Assay Explorer ... 28
Use Case ... 28
Chemical Explorer ... 31
Use Case ... 31
Export ... 34
vi
Chapter 5 Discussion, Limitations, Conclusion, and Future Directions ... 37
Discussion ... 37
Limitations ... 39
Conclusion ... 41
Future Directions ... 42
Chapter 6 Practicum Report ... 44
vii
List of Tables and Figures
Figure 1 Assay, Assay Component, Assay Endpoint Example from ToxCast Assay
Annotation ... 12
Figure 2 Assay Endpoint Model Example ... 15
Figure 3 Software Architecture with Focus on Model View Controller Front-End ... 17
Table 1 List of Data Services ... 19
Table 2 List of Data Service Parameters ... 20
Figure 4 Home Mode ... 23
Figure 5 Assay Selection Mode ... 25
Figure 6 Chemical Selection Mode ... 27
Figure 7 Assay Explorer Mode ... 30
Figure 8 Chemical Explorer Mode ... 33
Figure 9 Export Prompt ... 35
Table 3 Excerpt from Export of Summary Hit Calls of 95 Chemicals and 17 Assays ... 36
2
Chapter 1 Literature Review of Computational Toxicology
Purpose
Current risk assessments and regulatory decisions are based largely on toxicity data from clinical trials, epidemiological studies, and animal studies (Demchuk et al., 2008; Houck & Kavlock, 2008). Human data from clinical trials and epidemiological studies are most relevant to humans, but are low throughput and do not provide insight on the mechanisms underlying toxicity (Cogliano et al., 2008). While animal studies are amenable to higher throughput, extrapolation to humans can confound results and leaves a degree of uncertainty (Demchuk et al., 2008; Houck & Kavlock, 2008).
With large numbers of chemicals being manufactured each year and limited existing toxicity data, current approaches are not meeting the requirements for data to support informed decision-making. With current advances in alternative models both in vitro and in silico provide novel avenues for estimating toxicity (Gibb, 2008).
1
toxicity (Collins, Gray, & Bucher, 2008; Demchuk et al., 2008; Dix et al., 2007; Gibb, 2008; Houck & Kavlock, 2008). Computational approaches
combine chemical information including physico-chemical and structural properties with in vivo and in vitro data, when available (Rusyn & Daston, 2010). For example, results
from previous and ongoing traditional approaches, in vitro high-throughput screening (HTS) biochemical assays, and ultra high-throughput data from microarrays can be incorporated into computational approaches. Finally, existing computer models like chemical docking can also be incorporated to produce predictive toxicity models for preliminary decision-making and toxicity analysis of existing and unknown chemicals (Kirchmair et al., 2012).
Data Sources
Aggregated Computational Toxicity Reference (ACToR)
The Aggregated Computational Toxicity Reference (ACToR) is a United States Environmental Protection Agency (USEPA) project that includes databases and tools to access and analyze toxicity data. The ACToR project includes the ACToR database, Toxicity Reference database (ToxRefDB), and Toxicity Forecaster database
(ToxCastDB) accessible through a web interface accessible at http://www.actor.epa.gov. The ACToR database a relational database adapted from the PubChem project where assay space and chemical space are linked through data. Currently data for over 500,000 chemicals from over 500 data sources resides in ACToR (R. S. Judson et al., 2012).
3
produce a predictive model for prioritization of chemicals based on aggregated
performance across the assays (Dix et al., 2007; Kavlock, Austin, & Tice, 2009; Rusyn & Daston, 2010). ToxCast currently consists of two phases of testing comprising over 1800 chemicals run across over 800 HTS assays ("EPA Releases Chemical Screening Data on 1,800 Chemicals/Agency improves access to chemical data and announces ToxCast Data Challenges," 2013). All of the ToxCast chemicals, assays and data are stored in
ToxCastDB.
ToxRefDB, which is another subset of ACToR database (R. S. Judson et al., 2012), contains data from guideline in vivo studies incorporating data from sub chronic, chronic, developmental, and reproductive toxicity studies as well as cancer bioassays from rats, mice, and rabbits. ToxRefDB is used to supplement Toxicity Forecaster (ToxCast) project for validation and generate hypotheses for proposed mechanisms of toxicity (Martin, Judson, Reif, Kavlock, & Dix, 2009).
Comparative Toxicogenomics Database (CTD)
The Comparative Toxicogenomics Database (CTD) contains literature linking chemicals to gene and protein interactions. The interactions are also linked to
corresponding disease outcomes creating a network of literature mapping chemicals to genes and genes to diseases. The literature is manually entered into the database so literature supporting each relationship is clearly defined. CTD functions as a hypothesis-generating tool focusing on environmental chemicals and their relationship to diseases (Davis et al., 2013; Davis et al., 2009; Mattingly, 2009).
Carcinogenicity Potency Database (CPDB)
4
negative chronic cancer studies ranging back to the 1950s. CPDB serves as a uniform resource to locate and compare results from a multitude of studies on over 1050 chemicals. The aggregation of data in CPDB enables reporting of qualitative and
quantitative information about the experiment, carcinogenic chemical ratios, associations between carcinogenic potency, and predictions of carcinogenicity in target organs across different species (Gold, Manley, Slone, Rohrbach, & Garfinkel, 2005; Gold et al., 1991).
Chemical Effects in Biological Systems (CEBS)
The Chemical Effects in Biological Systems (CEBS) database integrates toxicogenomics and proteomics data with gross observations, clinical chemistry, and other measurements from experiments in animals, cell cultures, and humans. Currently data for over 27 studies is available for search through the CEBS web interface,
accessible at http://www.niehs.nih.gov/research/resources/databases/cebs/, either by study conditions or subject responses with a goal of viewing integrated data to
hypothesize mechanisms associated with the observed biological responses (Waters et al., 2008).
Distributed Structure-Searchable Toxicity (DSSTox)
The Distributed Structure-Searchable Toxicity (DSSTox) database aggregates chemical structure data with toxic effects. Chemical structure data can be used in
5
Models and Use of Computational Toxicology
Computational toxicology has been used in many fields for predictive modeling and to supplement and support traditional toxicology findings. Within drug development, HTS has been used to discover chemicals best suited to treat a previously identified target where many different compounds are run against the same assay (Houck & Kavlock, 2008). Use of HTS assays for regulatory toxicity aims to discover or test known toxicity targets against chemicals in use (Gibb, 2008). HTS provides important mechanistic data to support postulated modes of action (MOA) (Houck & Kavlock, 2008; Rusyn & Daston, 2010) and molecular initiating events (MIE) to map out adverse outcome
pathways (AOP). Below are summaries on models informed by computational toxicology including the USEPA’s ToxCast project and Toxicity Testing in the 21st Century (Tox21) that have provided HTS data on numerous chemicals of interest.
Toxicity Forecaster (ToxCast) and Toxicity Testing in the 21st Century (Tox21)
The USEPA’s ToxCast project has now released two phases of HTS data on over 1800 chemicals and over 800 assays providing chemical performance across assays at multiple concentrations ("EPA Releases Chemical Screening Data on 1,800
6
(ToxPi) score can be calculated. Chemicals can then be prioritized based on ToxPi scores (Reif et al., 2013). Tox21 efforts are similar, but the chemical library is much larger consisting of over 10,000 chemicals across around 100 HTS assays (Gibb, 2008). For screening and regulatory purposes, toxicity of new chemicals can be predicted by using ToxCast and Tox21 data with QSAR and other structure related models (R. Judson et al., 2013).
Quantitative Structure Activity Relationship (QSAR) and Read-Across
Quantitative Structure Activity Relationship (QSAR) modeling uses congeneric chemicals to quantitatively predict properties and the biochemical activity of chemicals. Chemical analogs can be grouped together to highlight trends in similar qualitative and quantitative properties, even predicted properties from QSAR. The QSAR models associating one or many chemicals to certain toxic endpoints can be extended to assume the biochemical activity of a chemical with no toxicity data, this approach is called read-across. A chemical with no known bioactivity can have predicted properties based on structure relationships to chemicals with a wealth of toxicity data. The chemical properties can be used to match a group of analogs, such that the analogs have certain toxic endpoints therefore inferring unknown chemical has the same toxic endpoints (Barratt, 2003; Cherkasov et al., 2014; Patlewicz et al., 2013; Tropsha, 2012).
Physiologically-Based Pharmacokinetic (PBPK) Models
7
used in risk assessment and exposure models. Data from computational approaches can be used to develop and refine PBPK models and support different AOPs by defining specific MOA and MIE ultimately mapping to larger biological responses and disease. PBPK models are used in regulatory toxicology for predicting safe levels of exposure, and understanding metabolism and distribution of chemicals in living organisms (Andersen, 2003).
Threshold of Toxicological Concern (TTC)
Thresholds of Toxicological Concern (TTC) were originally developed in the 1980’s by the United States Food and Drug Administration (FDA) to establish safe levels of exposure to chemicals found in food products that have little to no toxicity data
8
Challenges
Although computational approaches to toxicology solve problems of throughput and time efficiency, the data needs even further extrapolation to humans than animal studies. Animal studies have been, and continue to be, instrumental in the discovery of disease targets, toxic endpoints, and reference doses for risk assessments. However, animals are not always sufficient to provide data relevant to humans (Ennever & Lave, 2003). Mechanistic data from in vitro studies and computer models face the same criticism due to an even higher level of extrapolation from a single molecule, cell, or culture to a larger biological response or disease.
A wealth of data is being produced, and advanced statistical methods are available for analyzing the large datasets. The large uncertainty inherently associated with HTS due to the nature of reporting and result interpretation remains a challenge for the use of these data. Ultimately, the combination of human, animal, HTS, and computational data is extremely powerful.
Computational approaches to toxicology produce a wealth of heterogeneous data related to existing data across multiple disciplines. Proper access, storage, and
9
Current Work
8
Chapter 2 Introduction: Bridging the Gap
Computational toxicology approaches are not traditionally used for decision-making due to the gap between analysis and interpretation of data for regulatory
purposes. Through the CSS project, many efforts are being made to develop new models and incorporate computational data into existing models for decision support and new screening processes. A key goal of the project is to facilitate communication between different fields so that bridging the gap in understanding between different sources of data is easier. The Interactive Chemical Safety for Sustainability (iCSS) Dashboard project is key to achieving the CSS goals by providing a portal for easier access to data from the ToxCast project as well as tools to aid in understanding the analysis for interpretation.
Feedback obtained from ongoing discussions with USEPA program offices and stakeholders, including decision-makers, about ToxCast is consistent: the data is difficult to understand due to the quantity of data, lack of descriptions surrounding the assays, and lack of explanations and examples of how to interpret the results. iCSS addresses
9
10
Chapter 3 Materials and Methods
Dataset
The dataset for the beta release of iCSS is from the most recent release of ToxCast that includes 1858 chemicals and 821 assays. The chemicals are from ToxCast phases I and II and e1k. A custom database, iCSSDB, was created to meet the specific needs of the application. Summary hit calls including tested and modeled responses each as individual coordinate pairs; concentration at 50% maximum response (AC50);
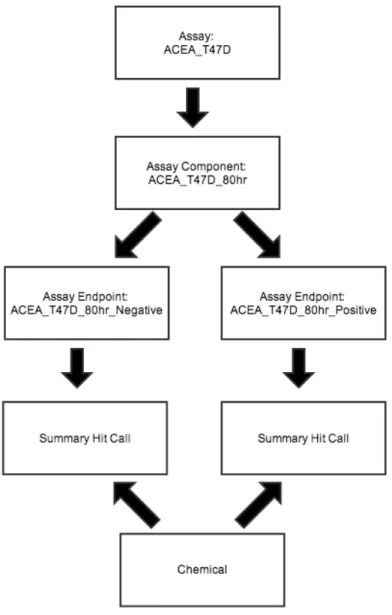
concentration at the maximum response (Emax); and hill curve parameters, bottom of curve (B), top of curve (T), and slope of curve (W) are accessible through iCSS. The assay descriptions are from ToxCast Assay Annotation, an ontology surrounding the ToxCast assays and adapted from BioAssay Ontology (Phuong, 2014). Figure 1 is an example of the hierarchy used in ToxCast Assay Annotation to describe an assay and link a specific assay endpoint to a summary hit call. The chemical descriptors consist of general properties surrounding each chemical adapted from data in DSSTox. No documentation is currently accessible through the application for each assay annotation and chemical descriptor.
11
12
Figure 1 Assay, Assay Component, Assay Endpoint Example from ToxCast Assay Annotation
Figure 1: Assay, Assay Component, Assay Endpoint Example from ToxCast Assay Annotation
This figure describes the hierarchy to represent the ToxCast assays with an assay as the most generic descriptor to an assay component to an assay endpoint. An assay can have one to many assay components; an assay component can have one to two assay
13
Frameworks
Sencha’s Ext JS 4.2.x is JavaScript-based framework used to develop the front-end client. Ext JS 4.2.x provides standards for developing an application supporting a model view controller (MVC) architecture. MVC is a common architecture used for development of many different applications. Conceptually, the model is the data to be displayed through a view, and controllers that keep the model and views synchronized by managing interactions by the user through the view. More details about the MVC
architecture specific to the front end are provided below in the first Architecture section and generically represented in Figure 3-A.
Zendframework 2.0 is a php framework that also utilizes MVC architecture. The middle-ware that brokers information from the backend database to the client via data services (Table 1) is provided through Zendframework 2.0. The data model is abstracted through an object relational mapper (ORM), and business logic is applied to the
corresponding objects for efficient representation on the client.
Architecture
Front-End
The major base classes in Ext JS 4.2.x are Model, Store, Proxy, Component and Controller. The Model class stores one piece of data like a single assay or single
14
master object serves as the authoritative source and manages all aspects of corresponding slave objects. For example, the master Chemical Store has information for all 1858 chemicals, but chemicals can be excluded from viewing forming a smaller subset of chemicals. A slave Chemical Store is created that only contains Models for the smaller subset of chemicals. The client only interacts directly with the view that has the slave store registered with it. As decisions are made for subsets of chemicals, the changes are first written to the master Store then the slave store is subsequently reloaded with the changes.
A Proxy manages how a Store is loaded with Models. Within the context of iCSS, the Proxy loads Models from locally stored data. Asynchronous JavaScript and XML (AJAX) calls are made by the Ext JS global AJAX method to data services, and the JavaScript Object Notation (JSON) response is stored locally within an object that is read into the store through custom load methods.
15
Figure 2 Assay Endpoint Model Example
Figure 2: Assay Endpoint Model Example
16
Middle Ware
ZendFramework 2.0, similar to Sencha’s Ext JS, is an MVC architecture that populates a server side object model from the data model, which is the schema for iCSSDB. The abstraction from the data model to the object model is accomplished with Doctrine, an object relational mapper (ORM). Business logic, like paging, is applied to the result sets from the database to load the object model in an appropriate format for the client.
17
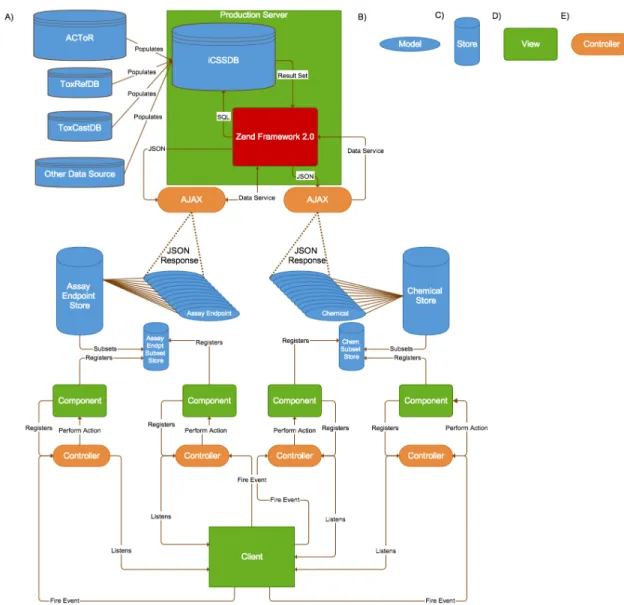
Figure 3 Software Architecture with Focus on Model View Controller Front-End
Figure 3: Software Architecture with Focus on Model View Controller Front-End
Model View Controller (MVC) architecture is an application design concept that separates the data from the visualization. (A) The basic architecture of the web application displayed as a flow from the backend databases to the middleware Zend Framework 2.0 (MVC architecture) to the frontend Sencha Ext JS (MVC architecture) to the client. (B) A model represents data for visualization. (C) A store aggregates a
18
19
Table 1 List of Data Services
Name Example Parameters
Assay Selection http://actor.epa.gov/dashboard/data- service/data-selection/index?page=1&itemsPerPage=4&fie ld=analysis_direction&name=negative page parameter_field parameter_name parameter_value ItemsPerPage sort meta Chemical Selection http://actor.epa.gov/dashboard/data- service/chemical-selection/index?page=1&name=PISA&vMin =0&vMax=555.5 page parameter_field parameter_name parameter_value ItemsPerPage sort meta Assay Explorer http://actor.epa.gov/dashboard/data- service/data-explorer/index?itemsPerPage=10000&assay_ endpoint=ACEA_T47D_80hr_Positive&page =1&activity_call=active page assay_endpoint activity_call ItemsPerPage sort meta Chemical Explorer http://actor.epa.gov/dashboard/data- service/chemical-explorer/index?itemsPerPage=10000&casrn= 100-01-6&page=1&activity_call=active page casrn activity_call ItemsPerPage sort meta Concentratio n Response http://actor.epa.gov/dashboard/data- service/conc-response/index?casrn=80-05-7&assay_name=ATG_ERa_TRANS&page=1 page casrn assay_name
Table 1: List of Data Services
20
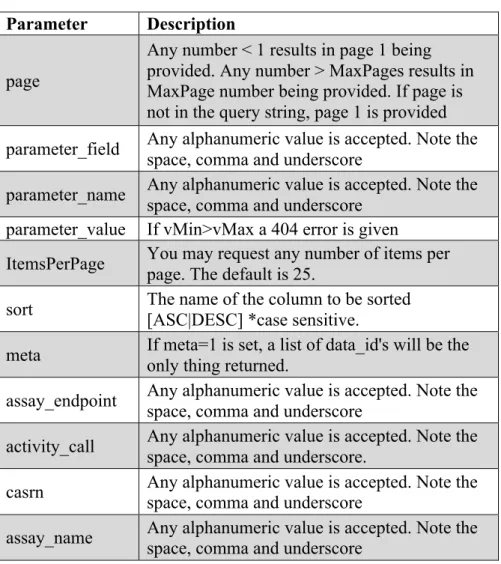
Table 2 List of Data Service Parameters
Parameter Description
page
Any number < 1 results in page 1 being provided. Any number > MaxPages results in MaxPage number being provided. If page is not in the query string, page 1 is provided parameter_field Any alphanumeric value is accepted. Note the space, comma and underscore
parameter_name Any alphanumeric value is accepted. Note the space, comma and underscore
parameter_value If vMin>vMax a 404 error is given
ItemsPerPage You may request any number of items per page. The default is 25.
sort The name of the column to be sorted [ASC|DESC] *case sensitive.
meta If meta=1 is set, a list of data_id's will be the only thing returned.
assay_endpoint Any alphanumeric value is accepted. Note the space, comma and underscore
activity_call Any alphanumeric value is accepted. Note the space, comma and underscore.
casrn Any alphanumeric value is accepted. Note the space, comma and underscore
assay_name Any alphanumeric value is accepted. Note the space, comma and underscore
Table 2: List of Data Service Parameters
21
Chapter 4 Results
Interactive Chemical Safety for Sustainability (iCSS) Dashboard Beta Release
The beta release of the application is currently public and accessible at http://actor.epa.gov/dashboard. The beta release serves as a browser of the ToxCast assays and chemicals as well as the summary hit calls for each chemical across the assays. Chemicals and assays can be subsetted by annotations surrounding the assays and chemicals. Full assay descriptions as well as data from result sets with replicates, not only summary activity calls, are available in the ToxCast data files downloadable at
http://www.epa.gov/ncct/toxcast/data.html.
22
Home
23
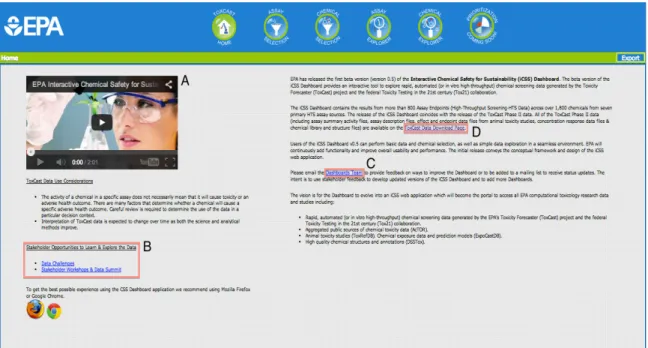
Figure 4 Home Mode
Figure 4: Home Mode
24
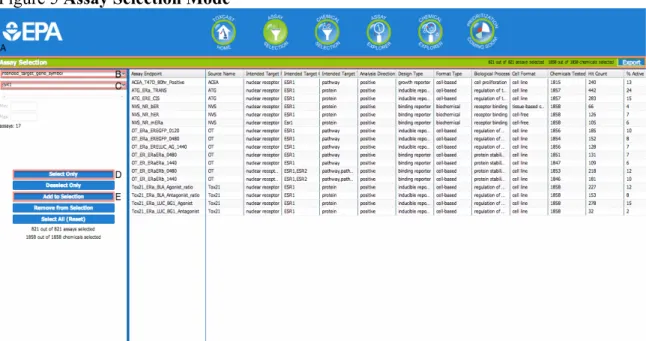
Assay Selection
Assay Selection mode is the recommended first mode to access, although any mode is accessible because no set workflow is implemented. Assay selection provides a list of all of the assays with all of the assay descriptions from ToxCast Assay Annotation database. Subsets of assays are grouped by the descriptors. A single assay or an existing subset of assays can be selected, added to a current subset, or removed from a current subset.
Use Case
To select only the estrogen assays, select the field,
“intended_target_gene_symbol” from the first drop down menu (Figure 5-B). Next, type “ESR1” into the second drop down menu (Figure 5-C) and click “ESR1” to select the symbol of the gene. The result will be 17 assays all involved with the estrogen receptor. To select only the 17 assays, press the “Select Only” button (Figure 5-D). If a subset of assays already exists, and the 17 estrogen assays need to be added to the subset, then press the “Add to Selection” button (Figure 3-E). Ultimately, the numbers of assays that have been selected will be updated according to the button selected and the numbers will be reflected in both Chemical and Assay Selection modes as well as the green
25 Figure 5 Assay Selection Mode
Figure 5: Assay Selection Mode
26
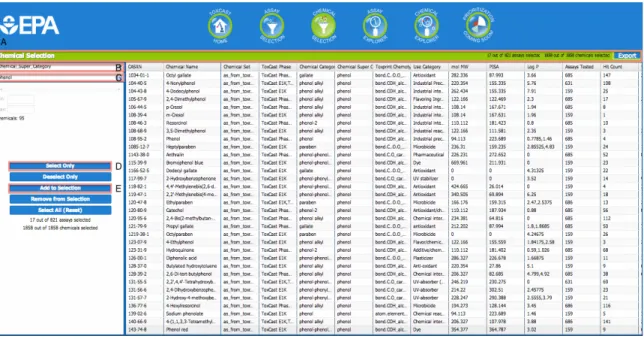
Chemical Selection
The Chemical Selection mode is very similar to the Assay Selection mode except this mode allows the user to select subsets of chemicals. Chemical descriptors from DSSTox are used to subset the chemicals just as the assay descriptions from ToxCast Assay Annotation database are used to subset the assays.
Use Case
To select only the phenols from the full chemical set, first select
27
Figure 6 Chemical Selection Mode
Figure 6: Chemical Selection Mode
28
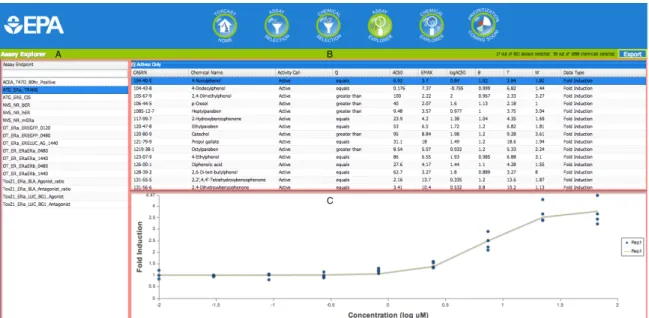
Assay Explorer
Assay Explorer mode allows the user to select a single assay from the Assays Only Grid (Figure 7-A) to populate the Assay Explorer Grid (Figure 7-B) with the summary hit calls for the selected assay across all the chemicals that have been subsetted in Chemical Selection mode (or all of the chemicals if no chemical subset has been selected). The Assays Only Grid is searchable and sortable by assay endpoint and is not case sensitive. Only the subset of assays, or all the assays if no subset was selected, appear in the Assays Only Grid. With the summary hit calls loaded into the Assay
Explorer Grid, a row can be selected to draw the concentration response plot (Figure 7-C) for that particular chemical and assay summary hit call. The concentration response plots reflect the parameters used to draw the hill curve (B, T, W, AC50, Emax) provided in the Assay Explorer Grid along with individual points used to produce the modeled response. The units for all of the concentrations reported are micro-Molar (uM). Currently, the units are only available through the concentration response plots but will be added to the Assay Explorer and Chemical Explorer Grids in the coming updates.
Use Case
Continuing with the subset of 17 estrogen assays along with 95 phenols from the above use cases, the user will only be able to choose one of the 17 assays from the Assays Only Grid. By clicking on the “ATG_ERa_TRANS” assay endpoint from the grid, the Assay Explorer Grid is populated with the summary hit calls for
29
can be sorted by clicking on the header of the column. By clicking the “CASRN” column on the summary hit call grid with the “actives only” checkbox checked, the rows are sorted ascending by CASRN. Selecting the second chemical, 4-Nonylphenol (CASRN 104-40-5), the concentration response plot (Figure 7-C) is drawn below the summary hit call grid. The parameters to fit the model and reasoning for the active hit call can be seen in the concentration response plot that is drawn. The logAC50 value in the Assay
30
Figure 7 Assay Explorer Mode
Figure 7: Assay Explorer Mode
31
Chemical Explorer
Most users are interested in the performance of either a single chemical or a small subset of chemicals across the ToxCast assays. The Chemicals Only Grid (Figure 8-A) is searchable by either CASRN or chemical name and is not case sensitive. The
recommended search is by CASRN since chemical names are not unique, but uniqueness of CASRN is preserved within the ToxCast chemicals. The CASRN search matches any CASRN within the subset of chemicals selected from Chemical Selection mode, but hyphens must be included in the search. For example, to find Bisphenol A (80-05-7) by CASRN “-05-”, “80-0”, or “80-05-7” will have Bisphenol A in the results; Alternatively, “8005” or “057” will not have Bisphenol A in the results. Searching by chemical name does not search synonyms, but only the exact chemical name within iCSSDB. With updates, the chemical search will include synonyms, including alternate CASRNs. Once a chemical is selected from the Chemicals Only Grid, the summary hit calls for the selected chemical across all of the assays or the subset of assays from the Assay Selection mode populate the Chemical Explorer Grid (Figure 8-B). Once a specific row from the Chemical Explorer Grid is selected, the concentration response plot (Figure 8-C) corresponding to the summary hit call is drawn below the Chemical Explorer Grid.
Use Case
32
typing the CASRN “104-40-5” into the text box below the “CASRN” column header. Clicking on 4-Nonylphenol populates the Chemical Explorer Grid with the hit calls across the 17 estrogen assays selected from Assay Selection mode. To view only the assays that are active, check the “actives only” checkbox located within the header within the Chemical Explorer Grid. The grid is reloaded with 6 assays including
“ATG_ERa_TRANS” from the Assay Explorer mode use case. Selecting
33
Figure 8 Chemical Explorer Mode
Figure 8: Chemical Explorer Mode
34
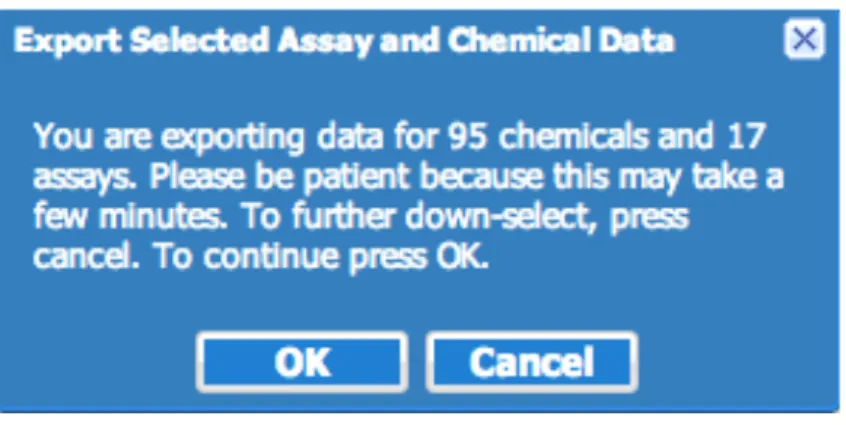
Export
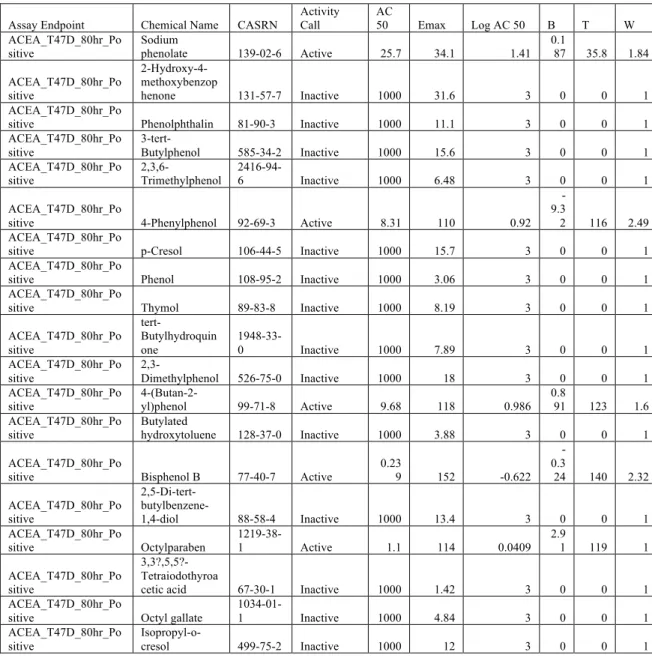
The summary hit call data seen in both Assay Explorer Grid and Chemical Explorer Grid is available for export. When the “Export” button is clicked, the export prompt (Figure 9) is presented to the user before the data is generated and downloaded. The prompt informs the user of the number of chemicals and assays the export will contain. Once the user clicks the “OK” button, the file containing the summary hit calls for the subset of
35
Figure 9 Export Prompt
Figure 9: Export Prompt
36
Table 3 Excerpt from Export of Summary Hit Calls of 95 Chemicals and 17 Assays
Assay Endpoint Chemical Name CASRN Activity Call AC 50 Emax Log AC 50 B T W
ACEA_T47D_80hr_Po sitive
Sodium
phenolate 139-02-6 Active 25.7 34.1 1.41
0.1
87 35.8 1.84
ACEA_T47D_80hr_Po sitive
2-Hydroxy-4-methoxybenzop
henone 131-57-7 Inactive 1000 31.6 3 0 0 1
ACEA_T47D_80hr_Po
sitive Phenolphthalin 81-90-3 Inactive 1000 11.1 3 0 0 1
ACEA_T47D_80hr_Po sitive
3-tert-Butylphenol 585-34-2 Inactive 1000 15.6 3 0 0 1
ACEA_T47D_80hr_Po sitive
2,3,6-Trimethylphenol
2416-94-6 Inactive 1000 6.48 3 0 0 1
ACEA_T47D_80hr_Po
sitive 4-Phenylphenol 92-69-3 Active 8.31 110 0.92
-9.3
2 116 2.49
ACEA_T47D_80hr_Po
sitive p-Cresol 106-44-5 Inactive 1000 15.7 3 0 0 1
ACEA_T47D_80hr_Po
sitive Phenol 108-95-2 Inactive 1000 3.06 3 0 0 1
ACEA_T47D_80hr_Po
sitive Thymol 89-83-8 Inactive 1000 8.19 3 0 0 1
ACEA_T47D_80hr_Po sitive tert-Butylhydroquin one
1948-33-0 Inactive 1000 7.89 3 0 0 1
ACEA_T47D_80hr_Po sitive
2,3-Dimethylphenol 526-75-0 Inactive 1000 18 3 0 0 1
ACEA_T47D_80hr_Po sitive
4-(Butan-2-yl)phenol 99-71-8 Active 9.68 118 0.986
0.8
91 123 1.6
ACEA_T47D_80hr_Po
sitive Butylated hydroxytoluene 128-37-0 Inactive 1000 3.88 3 0 0 1
ACEA_T47D_80hr_Po
sitive Bisphenol B 77-40-7 Active 0.239 152 -0.622
-0.3
24 140 2.32
ACEA_T47D_80hr_Po sitive
2,5-Di-tert-
butylbenzene-1,4-diol 88-58-4 Inactive 1000 13.4 3 0 0 1
ACEA_T47D_80hr_Po
sitive Octylparaben
1219-38-1 Active 1.1 114 0.0409
2.9
1 119 1
ACEA_T47D_80hr_Po sitive
3,3?,5,5?-Tetraiodothyroa
cetic acid 67-30-1 Inactive 1000 1.42 3 0 0 1
ACEA_T47D_80hr_Po
sitive Octyl gallate
1034-01-1 Inactive 1000 4.84 3 0 0 1
ACEA_T47D_80hr_Po sitive
Isopropyl-o-cresol 499-75-2 Inactive 1000 12 3 0 0 1
Table 3: Excerpt from Export of Summary Hit Calls of 95 Chemicals and 17 Assays
37
Chapter 5 Discussion, Limitations, Conclusion, and Future Directions
Discussion
Research in toxicology is being driven towards computational approaches because current goals in risk assessment and regulation are not being met by traditional methods in toxicology. Computational approaches produce large amounts of data in a short amount time, but large gaps exists between analysis and interpretation of data. Currently several large sources of computational toxicology data exists and are largely accessible through web applications. Although the data is accessible, criticism remains the same: too much data exists to mine and examples of how the data has been analyzed, can be used and subsequently interpreted are lacking. To further utilize computational data within regulations these concerns must be addressed.
Through continued, open communication with stakeholders and decision-makers, including USEPA program offices, feedback is being assessed to develop applications to meet the needs of all stakeholders wanting to use these data. The iCSS project
38
each chemical and assay intersection summarizes the activity with the parameters to fit a four-parameter hill curve. The summary hit calls for the subset of chemicals and assays can be exported for further review and serve as a reference when looking though the ToxCast data files for all the result sets with replicates.
ToxCast assays can be aggregated together into data classes to produce a
biological read across model by scoring a chemical’s performance across each data class and ranking the chemicals. Using Toxicity Priority Index (ToxPi), data classes and the corresponding scores can be visualized for a clearer understanding of a chemical’s performance across specific subsets of assays. For example, estrogen, androgen, thyroid, and steroidogensis are data classes for ranking chemicals according to endocrine
disruption potential. Each chemical can be scored across these data classes to be ranked based on individual endpoints (estrogenic, androgenic, thyrogenic, and/or steroidogenic) or collectively against all endpoints (overall endocrine disruption potential), which is the ToxPi score. Individually, the assays do not provide information about the overall toxicity endpoints, but aggregating the assays together in data classes provides a more holistic view of a chemicals behavior across specific toxicity pathways because each assay provides information about chemical performance across a snapshot of a toxicity pathway. Prioritization mode for iCSS, which is currently not implemented, would utilize data classes and ToxPi for biological read across using ToxCast assays and chemicals.
39
expedite and support Tier 1 screening decisions, which identifies chemicals with the potential to be an endocrine disruptor. Information from the biological read across would also provide information for Tier 2 screening decisions, which identify a chemical’s specific endocrine disruption endpoints, by narrowing down the specific endocrine pathways that could possibly be affected to result in the endpoint.
Ultimately, implementing Prioritization mode will help translate chemical performance across assays to toxicity endpoints bridging the gap between analysis and interpretation of computational toxicity data because the large amount of data can be collectively quantified and visualized. With clearer interpretations of chemical
performance combined with effective features to subset assays for aggregation into data classes, which is also a task mentioned in future directions, iCSS will become a more effective tool for hazard characterization for chemical safety decisions to increase the user base. Increasing the user base not only drives the development of the application through demand and feedback, but, also, helps validate ToxCast and any other data and models incorporated through updates and future versions.
Limitations
The major limitations faced with the development and release of the beta version of iCSS surround user needs, data needs, and technological needs. Although user
40
assay. Descriptions in sentence form are available through the data files, but currently, no sentence descriptions are available for each assay endpoint through iCSS. Documentation surrounding the data and how to use it is lacking and has contributed to the gap between analysis and interpretation of the data. Despite having annotations from ToxCast Assay Annotation available for each assay in Assay Selection mode, users have a difficult time interpreting the annotations because no documentation is provided through iCSS. For example, users have trouble understanding the difference between technological and intended targets. The technological target is the target being measured from the assay, and the intended target is the target that describes the biological process being captured. For example, the assay endpoint ATG_ERa_TRANS has a technological target of mRNA and an intended target of transcription factor with both targets mapped to the gene ESR1 (gene id 2099). Both targets along with the gene effectively describe the biological process that is captured within the assay: measuring mRNA from transcription of the gene ESR1 describes transcription factor regulation of the gene ESR1.
Users have also commented that they are not able to use the application because iCSS cannot perform a specific function they need. For example, many users would like to export only the active summary hit calls for a subset of assays and chemicals. Also, users would like to export all the descriptions, or annotations, for a subset of assays and a subset of chemicals. The only export currently available is all of the summary hit calls for the subset of assays and subset of chemicals from Assay Selection and Chemical
Selection modes.
41
data from other sources like ToxRefDB would break the current schema for iCSSDB. Storing heterogeneous data within a schema is extremely difficult due to the inherent complexity of the data itself, but also the complex relationships between data from multiple sources. Other solutions for storing heterogeneous data are available, like graph databases that do not require a schema, but are currently not in use because of the time required to map existing data into an entirely new backend then rebuild the middleware for support to the client.
A technological need, along with alternative database solutions to support other data sources, is browser support for older versions of Mozilla Firefox and Internet Explorer. Currently, iCSS browser support is limited to only the most recent versions of Google Chrome and Mozilla Firefox. Developing a web application to work across all platforms is a huge task because the application needs to be compatible with the user base’s browsers including the correct version. Each browser uses JavaScript and styles in different ways, so development to meet all users’ needs is challenging.
Conclusion
42
Future Directions
Through continued development driven by ongoing communication between stakeholders, including USEPA program offices and decision-makers, future versions will include a prioritization mode, data from other sources driving the development of a new schema or schema free solution, other features and tools to create a better user experience and effectively navigate the large amount of data, and documentation including examples detailing specific use cases for the application.
The first major step in development is implementing Prioritization mode. As mentioned in the discussion, Prioritization mode will incorporate data classes, aggregates of assays by toxicity pathways or endpoints, and ToxPi to score, rank, and visualize chemical performance across assays for clearer interpretation of the data.
Incorporating data from other sources like ToxRefDB Exposure Forecaster Database (ExpoCastDB) and ACToR requires a new schema for iCSSDB because the schema is currently specific to ToxCast data. Creating a schema to represent
heterogeneous data is difficult because relationships between the data cannot be
efficiently stored within a tabular structure. A new schema that captures all the data and relationships between the data and able to be quickly queried is needed to maintain usability of the application. Other solutions exist like graph databases, which do not have schemas and efficiently store extremely large amounts of data along with capturing complex relationships. The first goal is create a schema to support data from both
43
Other features currently in development are history support, user logs, better tools to navigate the data like 2D structure similarity search, and a more user-friendly
interface. With history support, users can more effectively navigate the application by undoing actions. Currently, if the page is refreshed or the user clicks the back button, the application will restart losing all progress. History support will prevent any loss of progress or premature exiting of the application. User logs would save all the actions from a session and be available for export along with any other information from the application, so another user can replicate the process to observe the same data. Tools specific for navigating the assay space and chemical space are currently in development. For example, the 2D structure similarity search allows users to find chemicals of a similar structure to compare performance across assays. The new tools will be implemented in user friendly visualizations with interactions like drag-and-drop rather than large tables and drop down menus with basic interactions.
44
Chapter 6 Practicum Report
In partial requirement for the Master of Science in Public Health, I completed my practicum at USEPA’s Office of Chemical Safety and Pollution Prevention, Office of Pollutions Prevention and Toxics, Information Management Division
(USEPA/OCSPP/OPPT/IMD) under direction of Matthew Leopard, the director of IMD. The goal of the practicum was to work with members of OPPT involved with the Toxic Substances Control Act (TSCA) in order to expand my knowledge of risk
characterization of chemicals. In order to look at data submitted to TSCA for risk characterization, I had to get clearance for Confidential Business Information (CBI). I was denied clearance because I was not a Federal employee, but I was still able to meet the competencies required for completion of the practicum requirement. Summarized below are descriptions of how each competency was met.
45
ChemView, so I was able to participate in discussions in other meetings. The next meeting was with the contractors, who gave me a brief overview of the software architecture and then focused on how the data is displayed. Adding computational toxicology data is a high goal for ChemView, so I was able to talk to the developers about the use of computational toxicology data as well as how it relates to the toxicity data provided through ChemView, which is data from traditional toxicology approaches and/or environmental and ecotoxicology studies. The last meeting was with again with OPPT Division Directors and focused mainly on how to use computational toxicology data and how to incorporate it into ChemView. I was able to effectively communicate the use of ToxCast data to support risk characterizations of chemicals because of the
knowledge gained through the other meetings as well through reading documentation detailing TSCA methodologies. Through these meetings I completed the Communication and Informatics, Diversity and Culture, and Leadership competencies.
I also met with scientists involved with the receipt and storage of data provided to TSCA. Through these meetings, I was given demos of the data available through
46
Table 4 Competencies Met for Practicum
Competency How to meet competency How Competency was Met
Communication and Informatics
Use information technology tools effectively in core public health functions such as retrieval of institutional and online public health data and dissemination of public health information
Successfully used ChemView as a tool for accessing information surrounding a chemical’s toxic endpoint
Engage in collective information sharing,
discussion and problem solving Actively participated in meetings discussing data needs from different research programs for a more successful risk characterization process
Diversity and Culture
Show effective and productive skills in working with diverse individuals including co-workers, partners, stakeholders, and/or clients
Leadership
Create a climate of trust, transparency, mutual cooperation, continuous learning, and openness for suggestion and input with co-workers, partners, other stakeholders, and/or clients
Opened up communication with OPPT about future collaborations with TSCA for continued support of computational toxicology data
Develop knowledge of one's individual strengths and challenges, as well as mechanisms for continued personal and professional development
Discovered my expertise has been shifted towards the computer science field and need to expand my knowledge about regulatory toxicology
Program Planning Identify needed resources for public health programs or research Learned more about the data used for risk characterizations and chemical safety decisions
Systems Thinking
Identify characteristics of a system Worked across multiple offices within a highly structured agency, which is a system
Respond to identified public health needs within their appropriate contextual setting
Attended meetings that addressed the needs of different communities: scientists and the general public
Environmental Sciences
Describe federal and state regulatory programs, guidelines and authorities that control
environmental health issues
Reviewed TSCA methodologies with those who collect TSCA data Specify current environmental risk assessment
methods
Specify approaches for assessing, preventing and controlling environmental hazards that pose risks to human health and safety
Table 4 : Competencies Met for Practicum
47
References
Andersen, M. E. (2003). Toxicokinetic modeling and its applications in chemical risk assessment. Toxicol Lett, 138(1-2), 9-27.
Barratt, M. D. (2003). QSAR, Read-across and REACH. Altern Lab Anim, 31(5), 463-465.
Cherkasov, A., Muratov, E. N., Fourches, D., Varnek, A., Baskin, II, Cronin, M., . . . Tropsha, A. (2014). QSAR Modeling: Where Have You Been? Where Are You Going To? J Med Chem. doi: 10.1021/jm4004285
Cogliano, V. J., Baan, R. A., Straif, K., Grosse, Y., Secretan, B., & El Ghissassi, F. (2008). Use of mechanistic data in IARC evaluations. Environ Mol Mutagen, 49(2), 100-109. doi: 10.1002/em.20370
Collins, F. S., Gray, G. M., & Bucher, J. R. (2008). Toxicology. Transforming environmental health protection. Science, 319(5865), 906-907. doi: 10.1126/science.1154619
Davis, A. P., Murphy, C. G., Johnson, R., Lay, J. M., Lennon-Hopkins, K., Saraceni-Richards, C., . . . Mattingly, C. J. (2013). The Comparative Toxicogenomics Database: update 2013. Nucleic Acids Res, 41(Database issue), D1104-1114. doi: 10.1093/nar/gks994
Davis, A. P., Murphy, C. G., Saraceni-Richards, C. A., Rosenstein, M. C., Wiegers, T. C., & Mattingly, C. J. (2009). Comparative Toxicogenomics Database: a
knowledgebase and discovery tool for chemical-gene-disease networks. Nucleic Acids Res, 37(Database issue), D786-792. doi: 10.1093/nar/gkn580
Demchuk, E., Ruiz, P., Wilson, J. D., Scinicariello, F., Pohl, H. R., Fay, M., . . . De Rosa, C. T. (2008). Computational toxicology methods in public health practice. Toxicol Mech Methods, 18(2-3), 119-135. doi: 10.1080/15376510701857148
Dewhurst, I., & Renwick, A. G. (2013). Evaluation of the Threshold of Toxicological Concern (TTC)--challenges and approaches. Regul Toxicol Pharmacol, 65(1), 168-177. doi: 10.1016/j.yrtph.2012.03.007
48
Ennever, F. K., & Lave, L. B. (2003). Implications of the lack of accuracy of the lifetime rodent bioassay for predicting human carcinogenicity. Regul Toxicol Pharmacol, 38(1), 52-57.
EPA Releases Chemical Screening Data on 1,800 Chemicals/Agency improves access to chemical data and announces ToxCast Data Challenges. (2013). [Press release]. Retrieved from
http://yosemite.epa.gov/opa/admpress.nsf/bd4379a92ceceeac8525735900400c27/ 38b102d67c6b9ee385257c4400732725!OpenDocument
Gibb, S. (2008). Toxicity testing in the 21st century: a vision and a strategy. Reprod Toxicol, 25(1), 136-138. doi: 10.1016/j.reprotox.2007.10.013
Gold, L. S., Manley, N. B., Slone, T. H., Rohrbach, L., & Garfinkel, G. B. (2005). Supplement to the Carcinogenic Potency Database (CPDB): results of animal bioassays published in the general literature through 1997 and by the National Toxicology Program in 1997-1998. Toxicol Sci, 85(2), 747-808. doi:
10.1093/toxsci/kfi161
Gold, L. S., Slone, T. H., Manley, N. B., Garfinkel, G. B., Hudes, E. S., Rohrbach, L., & Ames, B. N. (1991). The Carcinogenic Potency Database: analyses of 4000 chronic animal cancer experiments published in the general literature and by the U.S. National Cancer Institute/National Toxicology Program. Environ Health Perspect, 96, 11-15.
Houck, K. A., & Kavlock, R. J. (2008). Understanding mechanisms of toxicity: insights from drug discovery research. Toxicol Appl Pharmacol, 227(2), 163-178. doi: 10.1016/j.taap.2007.10.022
Judson, R., Kavlock, R., Martin, M., Reif, D., Houck, K., Knudsen, T., . . . Dix, D. (2013). Perspectives on validation of high-throughput assays supporting 21st century toxicity testing. ALTEX, 30(1), 51-56.
Judson, R. S., Martin, M. T., Egeghy, P., Gangwal, S., Reif, D. M., Kothiya, P., . . . Richard, A. M. (2012). Aggregating Data for Computational Toxicology Applications: The U.S. Environmental Protection Agency (EPA) Aggregated Computational Toxicology Resource (ACToR) System. Int J Mol Sci, 13(2), 1805-1831. doi: 10.3390/ijms13021805
49
Kirchmair, J., Williamson, M. J., Tyzack, J. D., Tan, L., Bond, P. J., Bender, A., & Glen, R. C. (2012). Computational prediction of metabolism: sites, products, SAR, P450 enzyme dynamics, and mechanisms. J Chem Inf Model, 52(3), 617-648. doi: 10.1021/ci200542m
Kroes, R., Kleiner, J., & Renwick, A. (2005). The threshold of toxicological concern concept in risk assessment. Toxicol Sci, 86(2), 226-230. doi:
10.1093/toxsci/kfi169
Martin, M. T., Judson, R. S., Reif, D. M., Kavlock, R. J., & Dix, D. J. (2009). Profiling chemicals based on chronic toxicity results from the U.S. EPA ToxRef Database. Environ Health Perspect, 117(3), 392-399. doi: 10.1289/ehp.0800074
Mattingly, C. J. (2009). Chemical databases for environmental health and clinical research. Toxicol Lett, 186(1), 62-65. doi: 10.1016/j.toxlet.2008.10.003 Munro, I. C., Renwick, A. G., & Danielewska-Nikiel, B. (2008). The Threshold of
Toxicological Concern (TTC) in risk assessment. Toxicol Lett, 180(2), 151-156. doi: 10.1016/j.toxlet.2008.05.006
Patlewicz, G., Ball, N., Booth, E. D., Hulzebos, E., Zvinavashe, E., & Hennes, C. (2013). Use of category approaches, read-across and (Q)SAR: general considerations. Regul Toxicol Pharmacol, 67(1), 1-12. doi: 10.1016/j.yrtph.2013.06.002
Phuong, J. (2014). Structured Application of Biological Ontologies to Annotate High-Throughput Screening Assays and their Targets of Activity.
Reif, D. M., Sypa, M., Lock, E. F., Wright, F. A., Wilson, A., Cathey, T., . . . Rusyn, I. (2013). ToxPi GUI: an interactive visualization tool for transparent integration of data from diverse sources of evidence. Bioinformatics, 29(3), 402-403. doi: 10.1093/bioinformatics/bts686
Richard, A. M., & Williams, C. R. (2002). Distributed structure-searchable toxicity (DSSTox) public database network: a proposal. Mutat Res, 499(1), 27-52.
Rusyn, I., & Daston, G. P. (2010). Computational toxicology: realizing the promise of the toxicity testing in the 21st century. Environ Health Perspect, 118(8), 1047-1050. doi: 10.1289/ehp.1001925
50
Waters, M., Stasiewicz, S., Merrick, B. A., Tomer, K., Bushel, P., Paules, R., . . . Fostel, J. (2008). CEBS--Chemical Effects in Biological Systems: a public data