Guiding digital transformation
Digital Density Index
A new way for government and business leaders
to understand, measure, and manage digital
strategies to drive growth and competitiveness
The Accenture Digital Density Index empirically shows
increased penetration of digital technologies in economic
activity can significantly lift productivity and GDP
growth—potentially driving
US$1.36 trillion
in additional
The key?
Understand what drives Digital Density,
measure it, and then manage it.
Introduction
Can digital technologies
help economies become
more competitive and
grow more strongly?
New research from
Accenture provides
empirical evidence
they can.
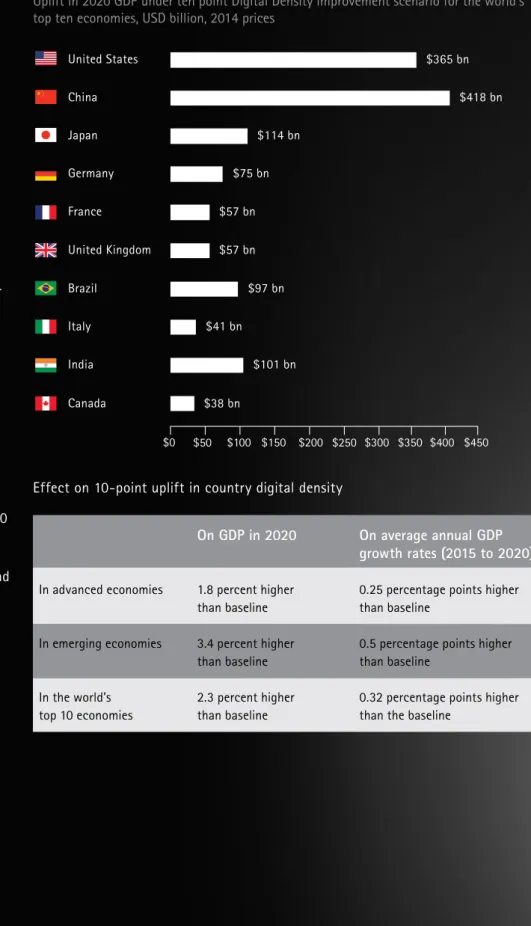
In a joint study, Accenture Strategy and Oxford Economics not only confirmed the link between increased use of digital technologies and greater productivity, but also quantified the resulting impact on competitiveness and economic growth (see “About the Research” for more details). According to our analysis, increased use of digital technology could add as much as US$1.36 trillion to the GDP of the world’s top 10 economies in 2020—which is 2.3 percent more than baseline forecasts (Figure 1). In this ambitious but achievable scenario, a 10 point improvement in Digital Density could raise annual average growth rates between now and 2020 by around 0.25 percentage points in advanced economies and around 0.5 percentage points in emerging markets.
Figure 1: Impact of a ten point boost in Digital Density to GDP levels in 2020.
Effect on 10-point uplift in country digital density
Uplift in 2020 GDP under ten point Digital Density improvement scenario for the world’s top ten economies, USD billion, 2014 prices
$0 $50 $100 $150 $200 $250 $300 $350 $400 $450 China $418 bn Brazil $97 bn Germany $75 bn France $57 bn Italy $41 bn United States $365 bn United Kingdom $57 bn Japan $114 bn India $101 bn Canada $38 bn On GDP in 2020 On average annual GDP growth rates (2015 to 2020)
In advanced economies 1.8 percent higher than baseline
0.25 percentage points higher than baseline
In emerging economies 3.4 percent higher than baseline
0.5 percentage points higher than baseline
In the world’s top 10 economies
2.3 percent higher than baseline
0.32 percentage points higher than the baseline
The Accenture Digital
Density Index is
a comprehensive
scorecard of what truly
matters to digitally led
economic productivity.
A higher score on the Digital Density Index reflects a broader and deeper adoption of digital technologies, as well as the skills, ways of working, and regulatory frameworks needed to realize their economic potential. Our analysis shows that boosting an economy’s score on the Accenture Digital Density
Index can lead to greater productivity and, other things being equal, faster GDP growth.
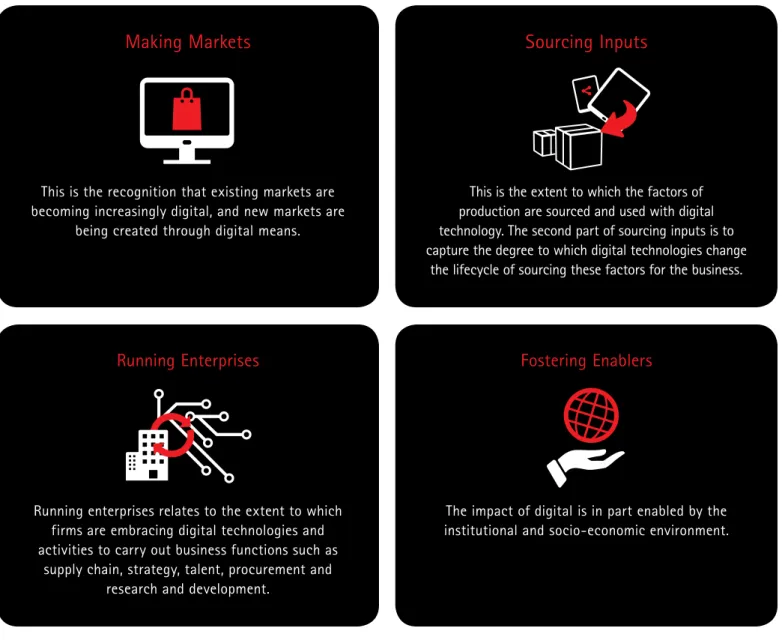
Reflecting the pervasive nature of digital technology, the index covers more than 50 indicators across four equally weighted areas of economic activity: Making Markets, Running Enterprises, Sourcing Inputs, and Fostering Enablers (Figure 2). These indicators range from the volume of transactions conducted online, the extent to which interactions between firms are automated, and the use of technologies such as the cloud to streamline processes; to the pervasiveness of technology skills in a
business, the use of digital platforms to access capital and talent, and government and business acceptance of new digitally driven business models.
Figure 2: Areas of economic activity measured by the Digital Density Index
Making Markets
Running Enterprises
This is the recognition that existing markets are becoming increasingly digital, and new markets are
being created through digital means.
Running enterprises relates to the extent to which firms are embracing digital technologies and activities to carry out business functions such as
supply chain, strategy, talent, procurement and research and development.
Sourcing Inputs
Fostering Enablers
This is the extent to which the factors of production are sourced and used with digital technology. The second part of sourcing inputs is to capture the degree to which digital technologies change
the lifecycle of sourcing these factors for the business.
The impact of digital is in part enabled by the institutional and socio-economic environment.
The Digital Density Index
can help to gauge the
current Digital Density of
an economy and guide
digital investments in
a business.
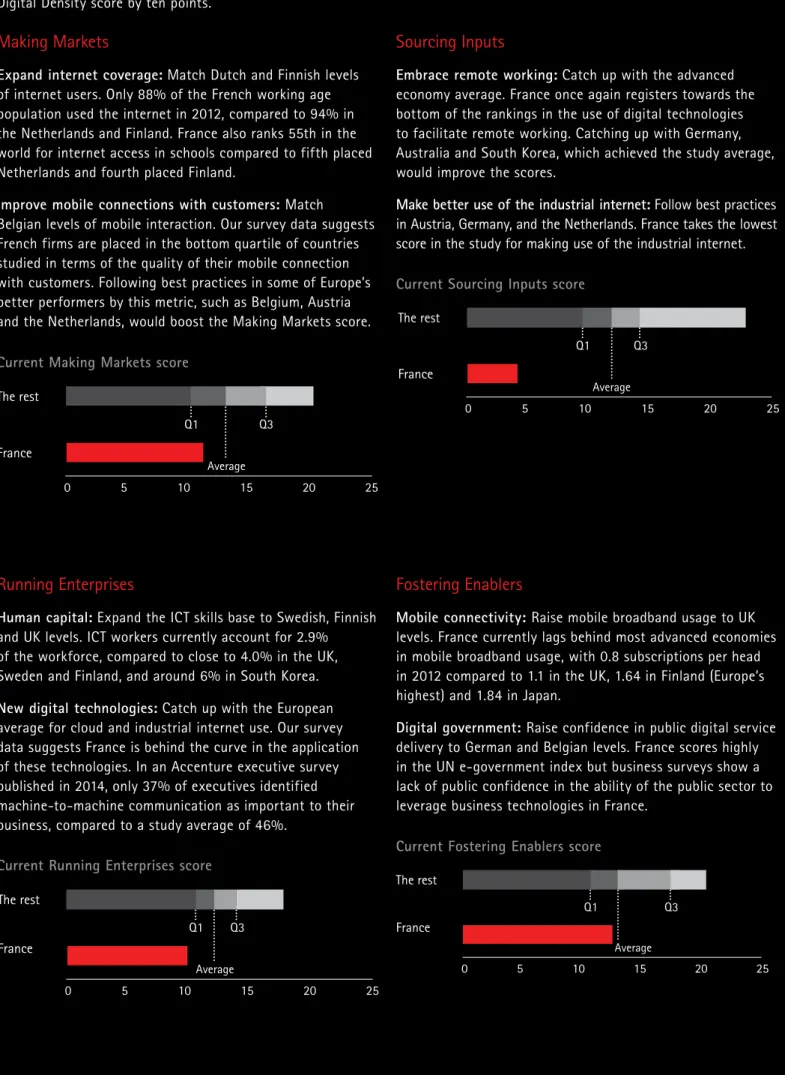
For example, Figure 3 shows 17 leading economies ranked according to their Digital Density scores, while Figure 4 illustrates the differences between the Digital Density profiles of the Netherlands (the Digital Density leader) and the world’s four largest economies (USA, China, Japan and Germany). Such profiles can be an important starting point for leaders as they shape and implement digital strategies and target specific opportunities for improvement. To illustrate, Figure 5 shows how France could raise its digital density by approximately 10 points through concerted efforts in eight areas and, according to our model, significantly boost productivity and growth over time.
According to our model, it can take up to six years for the full economic benefit of greater digital density to be felt, with productivity benefits feeding through fully into trend growth rates of GDP over this period. This insight should be a catalyst for governments and businesses to act now to increase the digital density of economies and organizations.
Figure 3: Digital Density scores for 17 leading economies (0-100)
Making Markets Running Enterprises Sourcing Inputs Fostering Enablers Germany UK US India Italy France Brazil Belgium China Austria Finland Netherlands Sweden South Korea Spain Australia Japan 0 10 20 30 40 50 60 70 80
Figure 4: Digital Density profiles of leading country the Netherlands and the world’s four largest economies, USA, China, Japan and Germany
Making Markets
Running Enterprises
Sourcing Inputs
Fostering Enablers
Bottom of range Mid-range Frontier Customer activity cycle
Digitally contestable markets
Interfirm collaboration
Bottom of range Mid-range Frontier Technology process Strategy process Business model Innovation Research and development spending Human capital
Bottom of range Mid-range Frontier Organizational flexibility Connectivity Government spending Ease of business Long-term regulatory outlook Attitudes in society
Bottom of range Mid-range Frontier Plant, property, equipment Labor Finance China USA
Figure 5: An illustrative combination of eight interventions that combined would help France increase its Digital Density score by ten points.
Making Markets
Expand internet coverage: Match Dutch and Finnish levels of internet users. Only 88% of the French working age population used the internet in 2012, compared to 94% in the Netherlands and Finland. France also ranks 55th in the world for internet access in schools compared to fifth placed Netherlands and fourth placed Finland.
Improve mobile connections with customers: Match Belgian levels of mobile interaction. Our survey data suggests French firms are placed in the bottom quartile of countries studied in terms of the quality of their mobile connection with customers. Following best practices in some of Europe’s better performers by this metric, such as Belgium, Austria and the Netherlands, would boost the Making Markets score.
Sourcing Inputs
Embrace remote working: Catch up with the advanced economy average. France once again registers towards the bottom of the rankings in the use of digital technologies to facilitate remote working. Catching up with Germany, Australia and South Korea, which achieved the study average, would improve the scores.
Make better use of the industrial internet: Follow best practices in Austria, Germany, and the Netherlands. France takes the lowest score in the study for making use of the industrial internet.
Running Enterprises
Human capital: Expand the ICT skills base to Swedish, Finnish and UK levels. ICT workers currently account for 2.9% of the workforce, compared to close to 4.0% in the UK, Sweden and Finland, and around 6% in South Korea.
New digital technologies: Catch up with the European average for cloud and industrial internet use. Our survey data suggests France is behind the curve in the application of these technologies. In an Accenture executive survey published in 2014, only 37% of executives identified machine-to-machine communication as important to their business, compared to a study average of 46%.
Fostering Enablers
Mobile connectivity: Raise mobile broadband usage to UK levels. France currently lags behind most advanced economies in mobile broadband usage, with 0.8 subscriptions per head in 2012 compared to 1.1 in the UK, 1.64 in Finland (Europe’s highest) and 1.84 in Japan.
Digital government: Raise confidence in public digital service delivery to German and Belgian levels. France scores highly in the UN e-government index but business surveys show a lack of public confidence in the ability of the public sector to leverage business technologies in France.
Current Fostering Enablers score Current Running Enterprises score
Current Making Markets score
The rest 0 5 10 15 20 25 Average Q3 Q1 France
Current Sourcing Inputs score
The rest 0 5 10 15 20 25 Average Q3 Q1 France The rest The rest
Beyond the technical model –
creating a new mindset
While the Digital Density Index’s indicators can
help pinpoint specific areas for improvement,
the broad areas of economic activity that the
model describes can also help government and
business leaders think differently about how digital
technology transforms business and economies
to capitalize on new growth opportunities.
Making Markets
Understand and support new
business models and markets
Governments need to rethink how they view disruptive new business models beyond outdated industry boundaries. For their part, businesses need to engage with governments in new ways. An example of business and government working together is the German “Smart Service World” program. Its aim is to determine how the business models of suppliers, manufacturers, and operators will be revolutionized by new types of products and services. This public—private partnership supports Germany’s goal to become the number-one country in Europe in terms of digital growth.1
Running Enterprises
Transform how
you operate
An original selling point of digital technologies was their ability to take time, cost, and distance out of an activity or process. That still holds true today. Companies and governments should increase their use of digital technologies to transform key business processes to create greater leaps in efficiency and productivity. Global mining company Rio Tinto, for example, has increased free cash flow in its copper mining operations by leveraging data streams from processing equipment to constantly optimize the production performance of the plant.2 In the U.S., the Internal
Revenue Service used predictive analytics to save $20 billion in tax fraud refunds in 2012,3 while the
General Services Administration’s Cloud First policy requires agencies to use cloud computing where possible to maximize capacity utilization, improve IT flexibility and responsiveness, and minimize cost.4
Sourcing Inputs
Think forward to the Industrial
Internet of Things
To keep growing and innovating, economies and businesses must use land, talent, capital, ideas, and other resources ever more effectively. The Industrial Internet of Things will further accelerate the digitalization of supply chains as objects interact with objects and humans to optimize processes or create new product and service hybrids.
For example, Michelin solutions’ EFFIFUEL solution™ uses high-tech and high-touch to reduce fuel consumption in truck fleets. Sensors inside vehicles collect data on fuel consumption, temperature, speed and location. Michelin solutions’ fuel experts analyze this data and recommend ways fleet managers and truck drivers can use less diesel fuel when driving. The savings can be as much as 2 liters of fuel for every 100 kilometers driven.5
Fostering Enablers
Look beyond
digital infrastructure
High-speed broadband is important. However, digital requires a much broader range of enabling factors beyond technology infrastructure. Governments and businesses must work together in at least four additional areas to create an environment in which digital can flourish.
The first is making it easier for entrepreneurs to launch digital businesses, which Italy did in 2014 by eliminating registration fees for startups and establishing a legal framework for crowdfunding. The second is streamlining and simplifying market rules to reflect the degree of commerce, online and offline, that now depends on digital. The European Union, for example, wants to put in place a “digital single market” of 500 million people, based on harmonized data protection rules, ecommerce, telecommunications, copyright and consumer protection.6
The third involves initiatives to develop digital skills, such as Estonia’s nationwide program called ProgeTiiger (Programming Tiger) to teach children aged seven to 19 how to write software code.7
The fourth is consumer and citizen trust that businesses and governments will use their personal data responsibly. Digital trust relies on secure infrastructure and appropriate data protection rules, as well as initiatives by businesses to become increasingly transparent with their customers as to how and why their data is used.
Considering digital
density in business
growth and
investment decisions
As businesses increase their use of digital technologies, they should consider the Digital Density of the countries and regions in which they operate, and target for new investments. The reason is intuitive: A company heavily reliant on digital for growth—for example, a bank that wants to drive aggressive adoption of its online banking capabilities— should favor countries with greater Digital Density.
In fact, a strong digital business infrastructure across a region’s markets, supply chains and talent has become a critical criterion for companies seeking to expand or relocate. It’s just as important as access to natural resources, a good transportation system, and skilled people. That’s especially true as governments begin to seek to actively boost Digital Density to increase growth and national competitiveness of economies. And for businesses whose prospects are closely tied to GDP, Digital
Conclusion
Government and business leaders know
they need to embrace digital technology as a
source of growth and increased competitiveness. Our
analysis confirms the benefit of doing so. But it also
reveals the time it takes for increased penetration
of digital technologies in economic activity to
translate into productivity and growth. That’s why
moving now, in a targeted way, to embrace digital
technologies is more critical than ever. Accenture’s
Digital Density Index can help leaders more
accurately determine how and where they should
invest to best leverage digital technologies to drive
competitiveness and economic growth, as well as
measure their progress along the way. The Index can
be a valuable guide for companies and countries
as they look to reshape themselves into the digital
powerhouses of the future.
Reference
1. For more information on the Smart Service Welt program see www.acatech.de/smart-service-welt 2. “Rio Tinto chief Sam Walsh hails $80 million cash flow boost from big data,” Peter Ker, Sydney Morning Herald, March 14, 2014. www.smh. com.au/business/rio-tinto-chief-sam- walsh-hails-80-million-cash-flow-boost-from-big-data-20140313-34pju. html#ixzz3LIOZdTKC
3. “IRS Combats Identity Theft and Refund Fraud on Many Fronts,” U.S. Internal Revenue Service website, www.irs.gov/uac/Newsroom/IRS- Combats-Identity-Theft-and-Refund-Fraud-on-Many-Fronts
4. U.S. General Services Administration website.
www.gsa.gov/portal/content/190333 5. Information provided by
Michelin solutions
6. European Commission, “An Investment Plan for Europe,” 2014. See: eur-lex. europa.eu/legal-content/EN/TXT/PDF/?ur i=CELEX:52014DC0903&from=EN 7. “To Get Kids Coding, Countries Should Follow Estonia’s Programming Tigers,” Greg Anderson, Arctic Startup, February 27, 2013. www.arcticstartup. com/2013/02/27/to-get-kids-coding- countries-should-follow-estonias-initiative
About the research
The Accenture and Oxford Economics study on Digital Density was based on three principal research components: 1. Collection of internationally comparable observations across hundreds of measures of digital technology and related indicators, from public and private sources. 2. From more than 50 of those indicators, the construction of a statistically tested composite Digital Density Index for 33 major economies, 16 of which included partially imputed scores.
3. Multivariate regression analysis to estimate equations that explain variation in countries’ total factor productivity by reference to their relative Digital Density Index scores. The study estimates only the effect of changes in total factor productivity on GDP. Expanding Digital Density likely will have additional positive GDP effects from factors including expansion of the digital/ICT sector and capital deepening across the economy. Further analysis could also consider other effects of expanding Digital Density, including effects on labor markets, public finances, and investment patterns.
About the Accenture Institute
for High Performance
The Accenture Institute for High Performance develops and publishes practical insights into critical management issues and global economic trends. Its worldwide team of researchers connects with Accenture’s consulting, technology and outsourcing leaders to demonstrate how organizations become and remain high performers through original, rigorous research and analysis. For more information, please visit: www.accenture.com/institute.
About Oxford Economics
Oxford Economics is one of the world’s foremost independent global advisory firms, providing reports, forecasts and analytical tools on 200 countries, 100 industrial sectors and over 3,000 cities. Headquartered in Oxford, England, with regional centres in London, New York, and Singapore, Oxford Economics has more than 100 economists and analysts—one of the largest economics teams in the private sector. For more information, visit www.oxfordeconomics.com.
For more information,
please contact the authors
Mauro Macchi [email protected] Bruno Berthon [email protected] Matthew Robinson [email protected]Contributors
Bernard Le Masson, James Lambert,
Mark Purdy, Gaurav Gujral, Mark McDonald, Daniel Benton, Narry Singh, Alice MacNeil
About Accenture Strategy
Accenture Strategy operates at the intersection of business and technology. We bring together our capabilities in business, technology, operations and function strategy to help our clients envision and execute industry-specific strategies that support enterprise wide transformation. Our focus on issues related to digital disruption, competitiveness, global operating models, talent and leadership help drive both efficiencies and growth. For more information, follow @AccentureStrat or visit www.accenture.com/strategy
About Accenture
Accenture is a global management consulting, technology services and outsourcing company, with approximately 319,000 people serving clients in more than 120 countries. Combining unparalleled experience, comprehensive capabilities across all industries and business functions, and extensive research on the world’s most successful companies, Accenture collaborates with clients to help them become high-performance businesses and governments. The company generated net revenues of US$30.0 billion for the fiscal year ended Aug. 31, 2014. Its home page is
www.accenture.com.