Server Load Balancing (SLB)
Testing
All rights reserved Ixia
26601 West Agoura Road, Calabasas, CA 91302 (877) FOR-IXIA
Server Load Balancer
Test Plan
Contents
Server Load Balancer Test Plan . . . 1
Background . . . 2
Performance Metrics . . . 2
1. Maximum Concurrent Connections Test . . . 3
Objective . . . 3
Setup . . . 3
Input Parameters . . . 4
Methodology . . . 5
Results . . . 6
2. Connection Setup Rate Test . . . 8
Objective . . . 8
Setup . . . 8
Input Parameters . . . 9
Methodology . . . 10
Results . . . 11
3. Protocol Latency Test . . . 12
Objective . . . 12
Setup . . . 12
Input Parameters . . . 13
Methodology . . . 14
Results . . . 15
4. Throughput Test . . . 16
Objective . . . 16
Setup . . . 16
Input Parameters . . . 17
Methodology . . . 18
Results . . . 19
5. DDoS and Multi-Protocol Stress Test . . . 21
Objective . . . 21
Background . . . 22
Setup . . . 23
Server Load Balancer
Test Plan
This test plan assists you in comprehensively testing the performance of your server load balancer (SLB) in handling various protocols using their stateful packet inspection and application-aware engines in both stressed and unstressed conditions.
The specific tests in this plan also provide comparative analyses to indicate how well the devices perform as more complex protocols are added to the test and as various application-aware functionalities are enabled, allowing them to perform deep packet inspection. The recommended testing methodology presented here is also meant to be used as a guideline to create more case-specific testing scenarios to further characterize the performance limits of the device under test (DUT) or system under test (SUT).
Background
Server load balancers and content switches are used extensively in web server farms to make it possible for Service Providers to offer highly-available web services to their clients, such as large enterprises that need to offer critical web services within their own organization or to their customers.
Server load balancers are protected using several firewall and security features that are either available in a single integrated platform or as tiered, multi-platform devices to protect and deliver critical services.
Performance Metrics
To validate the effectiveness of server load balancers, several essential performance metrics are used in this test plan:
Connection – A single TCP connection between two end hosts,
using connection establishment (3-way handshake).
Concurrent connections – Multiple TCP connections established
between two end hosts.
Connections-per-second – The rate at which new TCP connections
are initiated per second.
Throughput – The rate at which the DUT sends or receives data,
measured in bits per second.
Protocol latency – The time elapsed between a sending a
protocol request and receiving the reply. Refer to TTFB and TTLB for more information.
TTFB – Time to first byte – The time elapsed before the client receives the first byte of the HTTP response.
TTLB – Time to last byte – The time elapsed before the client receives the last byte of the HTTP response.
Other performance metrics may be of interest to the tester to characterize the firewall/SLB performance, and tests can be designed to meet these objectives.
1. Maximum Concurrent Connections Test
ObjectiveTo create a useful testing scenario, the basic operating limits of the DUT must be known.
Most performance characterizations use HTTP1.0/keep-alive or HTTP/1.1 traffic to establish this operating limit. A similar client traffic profile will be used for this test.
Performance metrics required: • Maximum concurrent connections
This metric has real-world significance in that it provides a raw performance metric of how well the DUT is able to scale and support a large number of TCP connections. For example, if the requirement for a web-server farm is to actively maintain 500,000 concurrent connections and each
server-load-balancer can support only 125,000 connections, it will require provisioning more server-load balancers to scale and handle the required load.
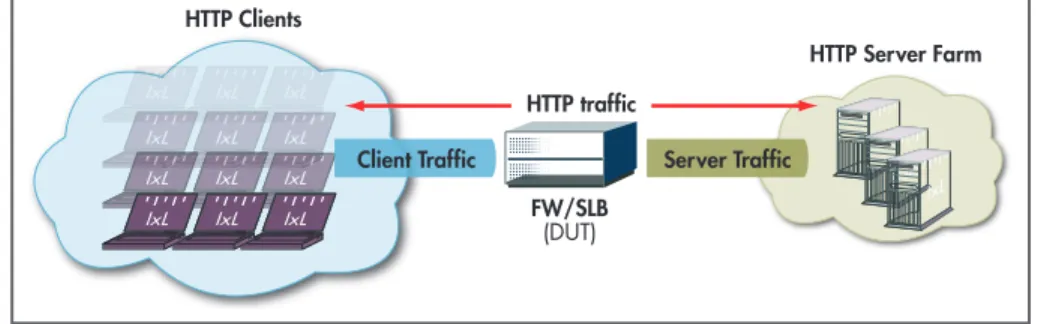
Setup
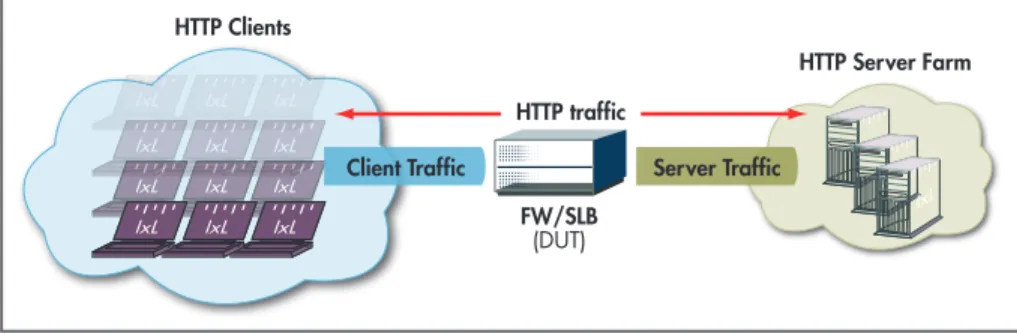
The setup requires at least one server and one client port. The HTTP client traffic will pass through the DUT to reach the HTTP server. The HTTP client and server must be connected to the DUT using a switched network.
HTTP Clients
HTTP Server Farm
FW/SLB
(DUT)
HTTP traffic
Client Traffic Server Traffic
Figure 1. Topology Setup for SLB Test Case 1 – Maximum Concurrent Connections
Input Parameters
Parameter Description
HTTP clients 100 IP addresses or more
HTTP client parameters HTTP 1.1 or HTTP1.0 with
keep-alive
10 TCP connections per user or more
Maximum transactions per TCP connection
HTTP client commands 1 GET command – payload
1 byte
Keep connection open – add “think” time
HTTP servers 1 or more
HTTP server parameters Random response delay –
0 – 20 ms
Response timeout – 300 ms
SLB packet filtering rule Configure NAT or PAT rules to
allow client network access to server(s) network - specifically only TCP/80 for HTTP
Configure SLB engine to allow access to HTTP server farms
SLB content inspection mode No advanced
application-aware inspection engines enabled
No IDS or threat prevention mechanisms enabled
No application-aware access-lists enabled
Test Objective Iterative method to determine
the maximum concurrent connections
Methodology
1. Before testing the DUT, set up a baseline test by running the test back-to-back with the test ports.
2. Once the baseline is established using the test ports, configure the DUT as outlined in the Input Parameters. 3. Set up the test, and configure the parameters for the
protocols as outlined in Input Parameters, including the command-list.
Ensure that there are sufficient ports to run the test. 4. Configure the test to ramp up the number of users at a
reasonable rate (e.g., 200 – 300 users per second). This rate allows the DUT/SUT enough time to attain steady state without getting overloaded due to the user ramp-up rates. 5. Run the test for few minutes. Begin by attempting to set up a
large number of concurrent connections through the DUT. If the published or expected value for maximum concurrent connections (MAX_CONN) for the device is known, this is a good starting point for MAX_CONN. The “expected value” is the targeted value for the test (TARGET_MAX_CONN). 6. Continue to monitor the DUT for any failure/error counters. 7. Monitor the ‘Concurrent TCP connections’ statistics on both
the client and server side.
These values must reach TARGET_MAX_CONN. If they do not, it indicates that the DUT capacity may have been reached.
8. Iterate through the test setting TARGET_MAX_CONN to the steady value attained during the previous run.
9. If TARGET_MAX_CONN was reached during the previous test run without any errors, MAX_CONN > TARGET_MAX_ CONN, iterate the test by trying to achieve a larger value for TARGET_MAX_CONN.
Results
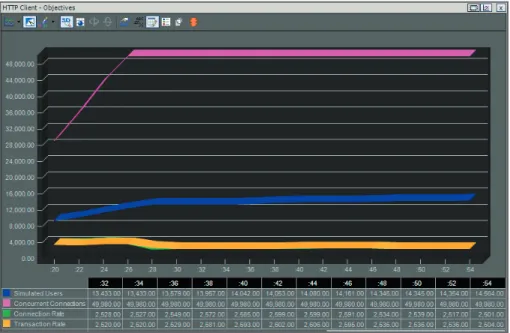
The objective of this test was to determine the DUT’s maximum concurrent connections. The following table summarizes how the DUT performed. IxLoad used an iterative process to ensure that the DUT was not being overwhelmed, i.e., ensuring that the number of TCP connections established by the HTTP Client matched that of the Server.
The graph below provides a view of the real-time statistics for the test. Real-time statistics provide instant access to key statistics to examine for any failures at the TCP and HTTP protocol level.
Figure 2. Real-time statistics for HTTP client in attaining maximum concurrent connections
Highlighted below is the maximum concurrent connections (CC) of 49,980 for the DUT without errors.
Figure 3. Maximum concurrent connections for the DUT with HTTP traffic
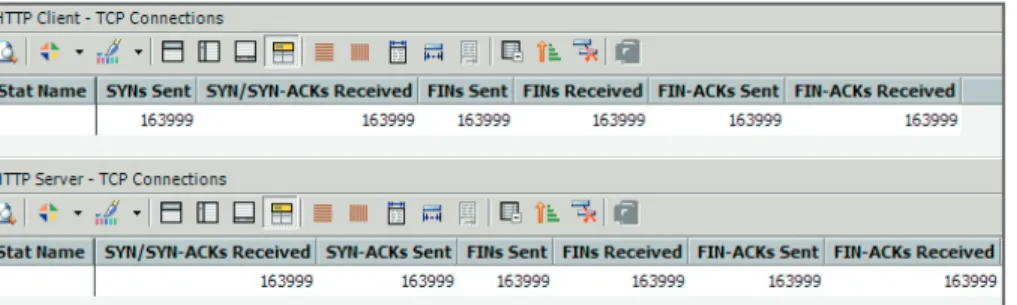
TCP setup and teardown details are listed below, and can be used to correlate HTTP client and server statistics and confirm that there are no failures.
Figure 4. HTTP client and server statistics for TCP setup and teardown
There are several other metrics of importance to validate the test results:
• TCP resets, timeout and listen queue drops • HTTP session requests sent and successful
• HTTP requests error condition including session timeouts, rejected connections, and abort conditions
2. Connection Setup Rate Test
ObjectiveThis test will establish the maximum connection setup rate/ connections-per-second (CPS), a key performance characteristic for the DUT.
Performance metrics required:
• Maximum connection setup rate/connections-per-second (CPS) This metric has real-world significance in that it characterizes how well the DUT is able to handle a steady TCP connection setup per second. It can isolate any bottlenecks on the network and help tune the performance of the DUT to operate optimally.
Setup
The setup requires at least one server and one client port. The HTTP client traffic will pass through the DUT to reach the HTTP server. The HTTP client and server must be connected to the DUT using a switched network.
HTTP Clients
HTTP Server Farm
FW/SLB
(DUT)
HTTP traffic
Client Traffic Server Traffic
Figure 5. Topology Setup for SLB Test Case 2 – Maximum Connections-Per-Second
Input Parameters
Parameter Description
HTTP clients 100 IP addresses or more
HTTP client parameters HTTP 1.1 or HTTP1.0 with
keep-alive
10 TCP connections per user or more
1 transaction per TCP connection
HTTP client commands 1 GET command – payload
1 byte
HTTP servers 1 or more
HTTP server parameters Random response delay –
0 – 20 ms
Response timeout – 300 ms
SLB packet filtering rule Configure NAT or PAT rules to
allow client network access to server(s) network – specifically only TCP/80 for HTTP
Configure SLB engine to allow access to HTTP server farms
SLB content inspection mode No advanced
application-aware inspection engines enabled
No IDS or threat prevention mechanisms enabled
No application-aware access-lists enabled
Test Objective Iterative method to determine
the maximum connections-per-second (CPS)
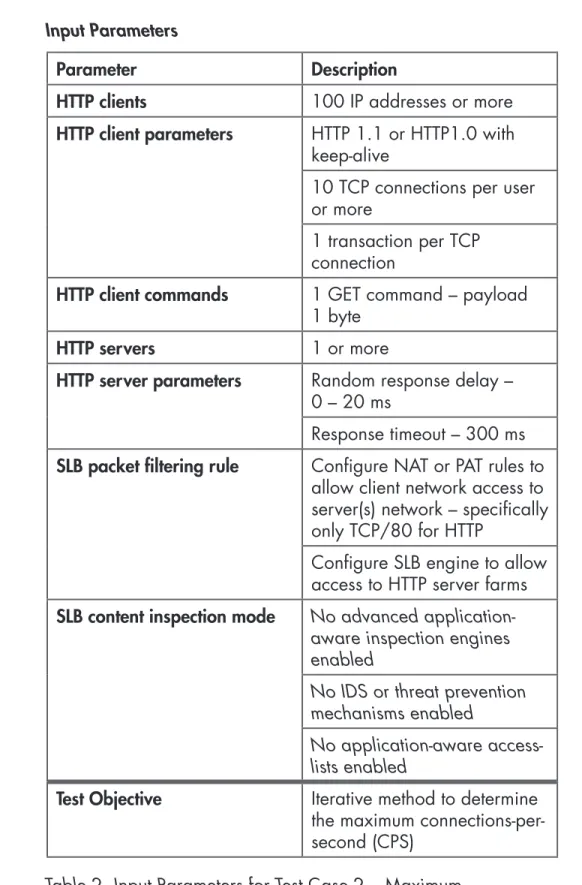
Table 2. Input Parameters for Test Case 2 – Maximum Connections-Per-Second
Methodology
1. Before testing the DUT, set up a baseline test by running the test back-to-back with the test ports.
2. Once the baseline is established using the test ports, configure the DUT as outlined in the Input Parameters.
3. Set up the test and configure the parameters for the protocols as outlined in Input Parameters including the command-list. Ensure that there are sufficient ports to run the test.
4. Configure the test to ramp up the number of users at a reasonable rate (e.g., 200 – 300 users per second).
This rate allows the DUT/SUT enough time to attain steady state without getting overloaded due to the user ramp-up rates.
5. Run the test for few minutes.
Begin by attempting to send a large number of connections per second through the DUT. If the published or expected value for MAX_RATE is known, this value is a good starting point for MAX_RATE, and will become the targeted value for the test (TARGET_MAX_RATE).
6. Continue to monitor the DUT for any failure/error counters. 7. Monitor the ‘TCP connections requested/sec’ statistics on both
the client and server side.
If the statistics are mismatched on the client and server sides, the DUT is overloaded.
The values for TCP connections requested/requests received per second must reach TARGET_MAX_RATE on both the client and server sides. If the value attained on the client side is lower than TARGET_MAX_RATE, then the DUT’s capacity may have been reached. Under these conditions, you must check the DUT for SYN overflow, packet drops, or similar statistics that indicate DUT failure.
8. Iterate through the test setting TARGET_MAX_RATE to the steady value attained during the previous run.
9. Once the rate of TCP connections requests has reached a steady value, check for any subsequent TCP connection requests that may be sent on the client side but not seen on the server side statistics.
These requests, which may be getting reset, could be lost because of SYN overflow errors, or they will eventually timeout and fail. This steady value attained is the maximum connection rate.
Results
The HTTP/TCP connection setup rate was derived iteratively to ensure there are no errors on the TCP or HTTP protocol level. The table below highlights the DUT’s maximum CPS at 3652 connections-per-second.
Figure 6. Maximum connections-per-second for the DUT with HTTP traffic
There are several other statistics used to validate the test results: • TCP setup (SYN/SYN-ACK/ACK).
• TCP resets, timeout and listen queue drops • HTTP session requests sent and successful
• HTTP requests error condition including session timeouts, rejected connections and abort conditions
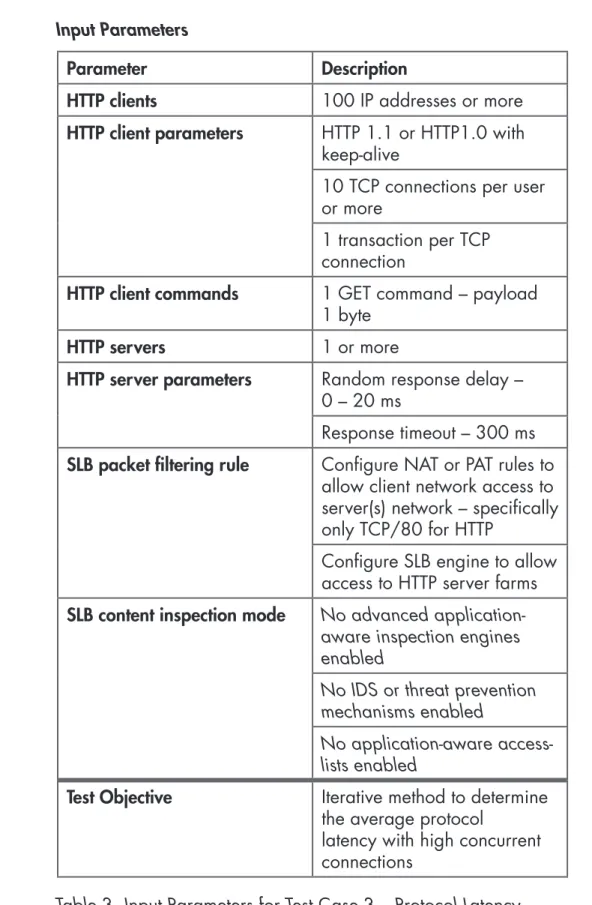
3. Protocol Latency Test
ObjectiveThis test will establish protocol latency, another key performance characteristic for the DUT.
Performance metrics required:
• Protocol latency – time to first byte and time to last byte This metric has real-world significance because it characterizes the user’s “feel” when interacting with various web services. For example, a network-based visualization web application requires a well-behaved (predictable), high-bandwidth, low latency, and low loss network. With high latency, even web pages that include several embedded objects can have noticeable performance degradation.
Setup
The setup requires at least one server and one client port. The HTTP client traffic will pass through the DUT to reach the HTTP server. The HTTP client and server must be connected to the DUT using a switched network.
HTTP Clients
HTTP Server Farm
FW/SLB
(DUT)
HTTP traffic
Client Traffic Server Traffic
Input Parameters
Parameter Description
HTTP clients 100 IP addresses or more
HTTP client parameters HTTP 1.1 or HTTP1.0 with
keep-alive
10 TCP connections per user or more
1 transaction per TCP connection
HTTP client commands 1 GET command – payload
1 byte
HTTP servers 1 or more
HTTP server parameters Random response delay –
0 – 20 ms
Response timeout – 300 ms
SLB packet filtering rule Configure NAT or PAT rules to
allow client network access to server(s) network – specifically only TCP/80 for HTTP
Configure SLB engine to allow access to HTTP server farms
SLB content inspection mode No advanced
application-aware inspection engines enabled
No IDS or threat prevention mechanisms enabled
No application-aware access-lists enabled
Test Objective Iterative method to determine
the average protocol
latency with high concurrent connections
Methodology
1. Begin by defining the load condition(s) under which the latency measurements must be assessed.
For example, measure the latency of a TCP connection when there are 40,000 established TCP connections.
2. Baseline the latency characteristics of the test setup without the DUT included in the test.
This baseline value is BASE_LAT.
3. Include the DUT in the test topology by configuring the DUT and the test parameters as outlined in the Input Parameters table.
4. Measure the response latency for a single connection under defined load conditions, TEST_LAT.
The difference between the TEST_LAT and the BASE_LAT values is the latency introduced by the DUT/SUT.
Results
To characterize the protocol latency introduced by the DUT for standard HTTP traffic, the following metrics are relevant:
• Connect time: the average time elapsed between when the client sends a SYN packet to the time it receives the SYN/ ACK.
• TTFB (time to first byte): the time elapsed before the client receives the first byte of the HTTP response.
• TTLB (time to last byte): the time elapsed before the client receives the last byte of the HTTP response.
The table below highlights IxLoad’s ability to measure the protocol latency in real-time.
Figure 8. HTTP protocol latency measurements for 49,980 concurrent connections
Ensure that there are no error conditions on the TCP and HTTP layer by referring to TCP and HTTP statistics highlighted in the prior baseline tests.
Important statistics include:
• TCP setup (SYN/SYN-ACK/ACK).
• TCP resets, timeout and listen queue drops • HTTP session requests sent and successful
• HTTP requests error condition including session timeouts, rejected connections and abort conditions
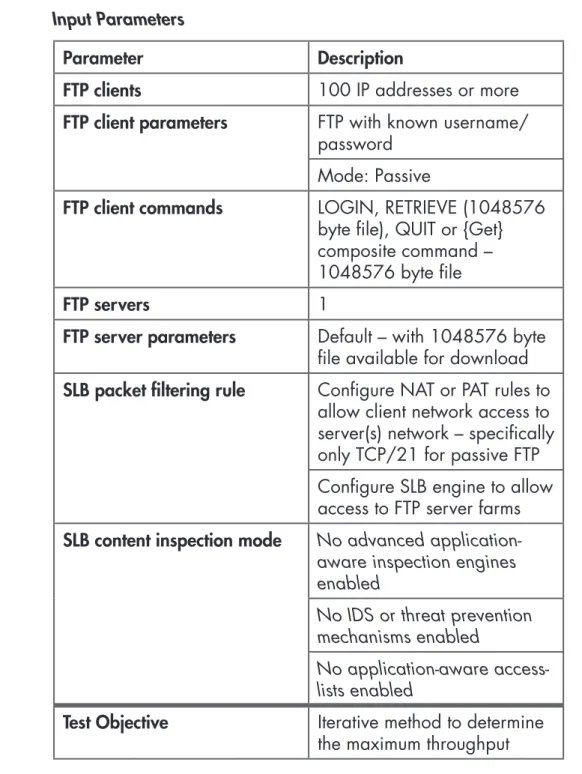
4. Throughput Test
ObjectiveThis test will establish Throughput performance, another key performance characteristic for the DUT.
Performance metrics required:
• Throughput – using active/passive FTP connections
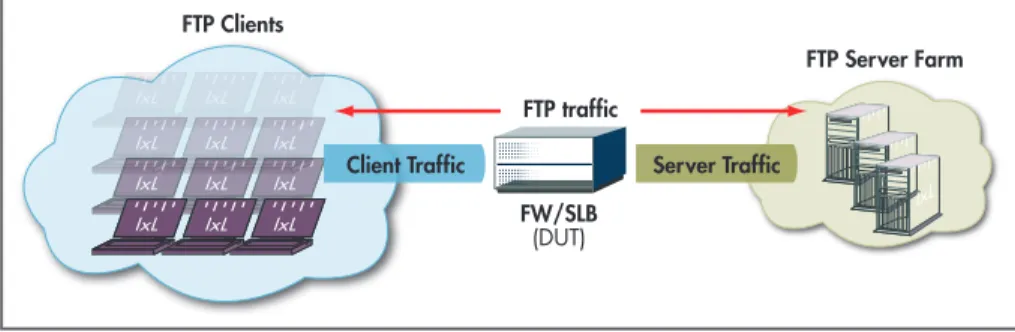
Setup
The setup requires at least one server and one client port. The FTP client traffic will pass through the DUT to reach the FTP server. The FTP client and server must be connected to the DUT using a switched network.
FTP Clients
FTP Server Farm
FW/SLB (DUT) FTP traffic
Client Traffic Server Traffic
Figure 9. Topology Setup for SLB Test Case 4 – Maximum Throughput
Input Parameters
Parameter Description
FTP clients 100 IP addresses or more
FTP client parameters FTP with known username/
password Mode: Passive
FTP client commands LOGIN, RETRIEVE (1048576
byte file), QUIT or {Get} composite command – 1048576 byte file
FTP servers 1
FTP server parameters Default – with 1048576 byte
file available for download
SLB packet filtering rule Configure NAT or PAT rules to
allow client network access to server(s) network – specifically only TCP/21 for passive FTP Configure SLB engine to allow access to FTP server farms
SLB content inspection mode No advanced
application-aware inspection engines enabled
No IDS or threat prevention mechanisms enabled
No application-aware access-lists enabled
Test Objective Iterative method to determine
the maximum throughput
Methodology
1. Before testing the DUT, set up a baseline test by running the test back-to-back with the test ports.
2. Once the baseline is established using the test ports, configure the DUT as outlined in the Input Parameters.
3. Set up the test and configure the parameters for the protocols as outlined in Input Parameters including the command-list. Ensure that there are sufficient ports to run the test.
4. Run the test for few minutes.
Begin by attempting to send a large amount of data through the DUT. If the published or expected value for maximum throughput (MAX_THRU) for the device is known, this is a good starting point for MAX_THUR. The “expected value” is the targeted value for the test (TARGET_MAX_THRU).
5. Continue to monitor the DUT for any failure/error counters. 6. Monitor the “Data Throughput” statistics on both the client
and server side.
These values must reach TARGET_MAX_THRU. If they do not, it indicates that the DUT capacity may have been reached. 7. Iterate through the test setting TARGET_MAX_THRU to the
steady value attained during the previous run.
8. If TARGET_MAX_THRU was reached during the previous test run without any errors, MAX_THRU > TARGET_MAX_ THRU, iterate the test by trying to achieve a larger value for TARGET_MAX_THRU.
9. Run the test with the new parameters.
Iterate until you achieve the intended throughput performance without any errors.
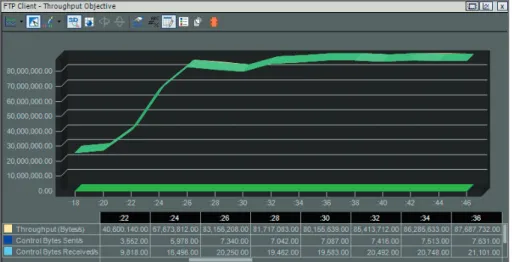
Results
As shown below, the maximum throughput achieved for the DUT was close to 710Mbps.
Figure 10. Real-time statistics for FTP client in attaining maximum throughput
Ensure no error conditions exist on the TCP and FTP layer by referring to the key TCP and FTP statistics listed below:
• TCP setup (SYN/SYN-ACK/ACK).
• TCP resets, timeout and listen queue drops • FTP control connections requested and successful
• FTP data connections, upload/download requested and successful
Figure 11 .FTP client and server control and data connection statistics
5. DDoS and Multi-Protocol Stress Test
ObjectiveServer-load balancers have evolved over the years to offer an integrated platform for doing business. For this reason, performing basic HTTP/TCP tests to determine raw performance is no longer sufficient. More application-layer protocols must be tested to truly characterize the performance of such devices. The first four tests that make up this section establish the raw TCP performance of the server-load balancer, which are usually the numbers published with such devices using very similar test profiles. This test will extend the breath of protocols in the traffic profile to simulate a more accurate and complete test cases. This test also assesses the SLB device’s ability to process legitimate traffic with deep IP packet inspection capabilities enabled and also work to prevent unwanted and malicious traffic (such as virus/spam/phishing attacks). In addition, the SLB will enable its IDS sensor capabilities to detect intrusion attempts and prevent attacks from overwhelming the serving of legitimate traffic.
To simulate adverse network conditions, data impairment at source (client and/or server) is used to emulate random packet drops, duplicate packets, or introduce jitter and latency (among other impairment characteristics). This brief analysis highlights the required sophistication of SLB and gateway devices to perform deep packet inspection to allow such communication. Some of the protocols used in this test plan include:
• Data protocols – HTTP over IPv6, FTP over IPv6, SMTP
• Streaming video – RTSP/RTP
• Voice over IP – SIP/RTP
Background
As SLB platforms become more intelligent, having the ability to decode and inspect deep into the IP payload and assessing its “performance” become much more complex. This is because the requirements of deep IP packet inspection performed by the SLB device translates to a fewer number of packets that it can process per second.
This performance impact is especially true for testing the performance of Voice over IP-enabled devices and protocols. For example, consider the Session Initiation Protocol (SIP), which is fast becoming a proven protocol for delivering voice and multimedia services on the Internet. The very nature of SIP mandates that L3/L4 information about the media stream (usually transported using RTP) be sent within the L7 signaling payload: in the Session Description Protocol (SDP). A SIP endpoint relays information about what IP:port it is expecting to receive the media stream on inside the L7 SIP payload to the remote SIP endpoint.
Most enterprises and customer premises equipment use NAT to assign IP addresses and conserve global IP addresses. This will break the end-to-end connectivity for initiating and terminating media streams as the IP:port included in the SDP payload will contain local and unreachable IP addresses (e.g. 192.168.100.5/24). Because of this, the remote endpoint will be unable to reach this IP destination. Obviously, this activity will severely impact performance characteristics of the network. Of course there are several solutions available today to address this specific problem: UPnP support on SIP endpoints and gateways or STUN support on gateway devices.
To further add to the processing overhead of such devices, they are also required to have resiliency from reconnaissance attacks, denial-of-service attacks, and vulnerability attacks that either try to “sneak” past the SLB’s intrusion detection filters or attack the SLB itself. All of which, require a range of features that can adversely affect simple performance assessments.
Setup
The setup requires at least one server and one client port. To test realistic network conditions, several protocols can be added. The topology below introduces data, voice, and video traffic to the traffic profile first. Then DDoS and malicious traffic is introduced with the appropriate inspection engines enabled on the DUT. Traffic impairment is also introduced to characterize the performance of the DUT under transient and adverse network conditions.
Data, Voice, Video Clients
Server Farm FW/SLB
(DUT)
Client Traffic Server Traffic
1.HTTPv6, FTPv6, SMTP, RTSP, SIP Traffic
2.DDoS + Malicious Traffic Added
3.Traffic Impairment Added
Figure 12. Topology Setup for SLB Test Case 5 – Multi-protocol Stress Test
Input Parameters
Parameter Description
Data clients 100 IP addresses or more
Data client parameters HTTP 1.1 or HTTP1.0 with
keep-alive over IPv6
FTP passive/active connections SMTP several payloads with varying content
Voice and video client
parameters SIP call setup – using UDP and/or TCP, and media negotiation such as voice codec
Streaming media – RTSP commands to request playback
Data servers 1 or more
Voice and streaming
video servers Voice – setup to accept calls as SIP Callee endpoints Video – various sample videos available
SLB packet filtering rule Configure NAT or PAT rules to
allow client network access to server(s) network for all protocols configured
Configure SLB engine to allow access to HTTP/FTP server farms
SLB content inspection mode Enable advanced
application-aware inspection engines (e.g. virus/spam and malformed L7 packets)
Enable IDS and/or threat prevention mechanisms
Enable application-aware access-lists to ensure traffic such as SIP and RTSP are correctly decoded and passed through
Test Objective Iterative method to determine
various performance metrics for each of the protocols, including CC, CPS, Latency and Throughput
Methodology
1. Baseline the various required metrics, such as CC, CPS, Throughput, and Latency, of the test setup without the DUT included in the test.
Note: There are several protocols used in this test plan. Use the first four test cases as a guideline on configuring protocol behavior to achieve the metrics. Some of the key protocols highlighted in this test plan include HTTP, FTP, SMTP, SIP/RTP, RTSP/RTP.
2. Include the DUT in the test topology.
Several DUT configuration options are required:
• Enable application-aware inspection engines which may be global parameters and/or access-lists
• Enable application-gateway or proxy services for specific protocols used in the test – e.g., SIP NAT traversal (STUN)
• For the first phase of this test case, do not enable any intrusion detection or threat mitigation engines
3. Measure the various performance metrics per protocol, ensuring that there are no protocol errors.
Refer to the first four test cases for TCP and other protocol-specific statistics and metrics relevant to ensuring a successful test.
4. Once the performance of the SLB is known with its
application-aware inspection engines enabled, move on to further stress the DUT.
• Enable intrusion detection and threat mitigation
• If not enabled previously, enable HTTP and SMTP packet inspection for virus, spam and phishing attacks
Enabling such filters on the SLB allows you to further stress test the DUT by sending malicious HTTP and SMTP payloads (such as virus/spam or objectionable content) and also using several DDoS attack signatures.
5. On the client traffic profile used to stress test the DUT, add relevant DDoS attack signatures and also add malicious and malformed packets on HTTP and/or SMTP and other data protocols.
Some of the DDoS attacks to consider:
• Evasive UDP, Ping sweep, SYN flood, TCP scan, Tear-drop
There are several L7 DOS attacks to consider. Use discretion on assembling the attacks to initiate against the servers or DUT.
6. Iteratively measure the performance metrics while the DUT is trying to service legitimate traffic while trying to cope with DDoS attacks and malicious/malformed data content. 7. Compare this performance to that previously attained with
no adverse conditions added.
It is expected that the DUT’s performance will degrade. 8. To complete the test case, add Impairment to the client and/
or server traffic profile.
9. Configure packet drops, duplicate packets or introduce latency and jitter to the client traffic.
10. Once again, run the test and derive at the operating limits of the DUT as it tries to cope with several network conditions normally present on real networks.
11. Compare the operating limits for all three runs to get a precise idea of the performance characteristic of the DUT as it moves from serving raw (and ideal) traffic to serving more realistic traffic that includes data, voice, and video traffic with adverse network conditions.
Results
The following reports provide data from various test runs. The report below is the aggregate TCP statistics showing no errors for HTTP traffic. This result is from the first iteration of the test case.
Figure 13. HTTP traffic statistics for the first run – with application-layer inspection engines enabled on the DUT
As shown below, the connections for HTTP traffic with the intrusion detection engine enabled on the DUT is noticeably lower, though there are no errors.
The performance impact of running multi-protocols with DDoS attacks has a 24% impact on successful connection establishment for HTTP traffic alone.
Figure 13. HTTP traffic statistics for the second run with
The reports below show the successful SIP voice calls. As expected, with DDoS attacks specifically targeted at the Callee (SIP endpoints expecting a call), the successful call capacity was reduced by 10%.
Figure 14. SIP call completions without DDoS attacks and no IDS engine enabled on the DUT
Figure 15. SIP call completions with DDoS attacks and IDS engine enabled on the DUT
___________________________________________________________
___________________________________________________________
___________________________________________________________
___________________________________________________________
___________________________________________________________
___________________________________________________________
___________________________________________________________
___________________________________________________________
___________________________________________________________
___________________________________________________________
___________________________________________________________
___________________________________________________________
___________________________________________________________
___________________________________________________________
___________________________________________________________
___________________________________________________________
___________________________________________________________
___________________________________________________________
___________________________________________________________
___________________________________________________________
___________________________________________________________
___________________________________________________________
___________________________________________________________
___________________________________________________________
___________________________________________________________
___________________________________________________________
___________________________________________________________
___________________________________________________________
___________________________________________________________
___________________________________________________________
___________________________________________________________
___________________________________________________________
___________________________________________________________
___________________________________________________________
___________________________________________________________
___________________________________________________________
___________________________________________________________
___________________________________________________________
___________________________________________________________
___________________________________________________________
___________________________________________________________
___________________________________________________________
___________________________________________________________
___________________________________________________________
___________________________________________________________
___________________________________________________________
___________________________________________________________
___________________________________________________________
___________________________________________________________
___________________________________________________________
___________________________________________________________
___________________________________________________________
___________________________________________________________
___________________________________________________________
___________________________________________________________
___________________________________________________________
___________________________________________________________
___________________________________________________________
___________________________________________________________
___________________________________________________________
___________________________________________________________
___________________________________________________________
___________________________________________________________
Ixia is a leading provider of performance test systems for IP-based infrastructure and services. Its highly scalable solutions generate, capture, characterize, and emulate network and application traffic, establishing definitive performance and conformance metrics of network devices or systems under test. Ixia’s test systems are used by Network and Telephony Equipment Manufacturers, Semiconductor Manufacturers, Service Providers, Governments, and Enterprises to validate the functionality and reliability of complex IP networks, devices, and applications. Ixia’s Triple Play test systems address the growing need to test voice, video, and data services and network capability under real-world conditions. Ixia’s vision is to be the real-world’s pre-eminent provider of solutions to enable testing of next generation IP Triple Play networks. Ixia’s test systems utilize a wide range of industry-standard interfaces, including Ethernet, SONET, ATM, and wireless connectivity, and are distinguished by their performance, accuracy, reliability, and adaptability to the industry’s constant evolution.
Ixia Worldwide Headquarters
Corporate Center26601 W. Agoura Rd. Calabasas, CA 91302 (Toll Free North America) 1.877.367.4942 (Outside North America) +1.818.871.1800 (Fax) 818.871.1805
www.ixiacom.com
Info: [email protected]
Investors: [email protected]
Renewals: [email protected]
Sales: [email protected]
Support: [email protected]
Training: [email protected]
Ixia USA Sales
Phone: 1.866.355.4942 Email: [email protected]
Ixia Canada Sales
Phone: 1.877.367.4942 Email: [email protected]
Ixia China Sales
Phone: +86.10.84549199 Email: [email protected]
Ixia Europe, Middle East, & Africa Sales
Phone: +44.1753.722056 Email: [email protected]
Ixia India Sales
Phone: +91.80.25633570 Email: [email protected]
Ixia Japan Sales
Phone: +81.3.5365.4690 Email: [email protected]
Ixia Oceania Sales
Phone: 1.818.292.1561 Email: [email protected]
Ixia South Korea
This publication may not be copied, in whole or in part, without Ixia’s consent.
Ixia and its licensors retain all intellectual property rights in all products identified in this publication. Such products may be covered by one or more patents and/or pending patent applications, including but not limited to the following U.S. patents: 6,717,917; 6,408,335; 6,397,359; 6,061,725; 5,937,165; 5,881,237; and 5,838,919. All software and related
documentation identified in this publication is licensed, not sold, pursuant to a separate license agreement between Ixia and the recipient. The recipient’s use of such software and documentation is subject to the terms of that agreement.
Restricted Rights Legend
Use, duplication, or disclosure by the U.S. Government is subject to the restrictions set forth in subparagraph (c)(1)(ii) of the Rights in Technical Data and Computer Software clause at DFARS 252.227-7013 and FAR 52.227-19.
THIS PUBLICATION IS PROVIDED “AS IS” AND WITHOUT ANY WARRANTIES OF ANY KIND, EITHER EXPRESS OR IMPLIED. IXIA SPECIFICALLY DISCLAIMS ANY IMPLIED WARRANTIES OF MERCHANTABILITY, FITNESS FOR A PARTICULAR PURPOSE, OR NONINFRINGEMENT. THE INFORMATION HEREIN IS FURNISHED FOR INFORMATIONAL USE ONLY, IS SUBJECT TO CHANGE BY IXIA WITHOUT NOTICE, AND SHOULD NOT BE CONSTRUED AS A COMMITMENT BY IXIA. IXIA ASSUMES NO RESPONSIBILITY OR LIABILITY FOR ANY ERRORS OR INACCURACIES CONTAINED IN THIS PUBLICATION.