NEUROIMMUNE CONSEQUENCES OF CHRONIC ALCOHOL EXPOSURE: RELATIONSHIP TO STRESS
Buddy A. Whitman
A dissertation submitted to the faculty of the University of North Carolina at Chapel Hill in partial fulfillment of the requirements for the degree of Doctor of Philosophy in the
Curriculum of Neurobiology
Chapel Hill 2012
Approved by:
ii ABSTRACT
BUDDY A. WHITMAN: Neuroimmune consequences of chronic alcohol exposure: relationship to stress.
(Under the Direction of Dr. George R. Breese)
Alcoholism is characterized by tolerance to alcohol, withdrawal signs or symptoms, and continued use despite detrimental physical or psychological consequences. Studies have illustrated the deleterious effects of prolonged and excessive alcohol use extend to many organs including the liver, lungs, stomach, and brain. While the brain represents the most important organ in the development and maintenance of alcoholism, the neurobiological mechanisms underlying its role are not sufficiently understood to permit effective and timely intervention. Recent work has demonstrated that alcohol-associated changes in
neuroimmune function may contribute to the progression of alcoholism. To better
understand the role of alcohol in neuroimmune system dysregulation, changes in cytokine expression were determined after alcohol exposure in rats. While acute alcohol
administration did not increase proinflammatory cytokines measured in the cerebral cortex, chronic alcohol administration produced a robust effect. Additionally, HMGB1, an
iii
brain cytokines. Because HMBG1 was elevated following chronic alcohol exposure, the possibility that stress was contributing to the release of HMGB1 was examined. Blockade of HMBG1 with two different antagonists reduced stress-induced increases in cytokines
iv
To three special people who helped me along this journey: the late Dr. Alfred M. Dufty Jr., and Drs. Ann Stuart and John Moore. I could not have accomplished this work without your
v
ACKNOWLEDGEMENTS
This work would not have been possible without the excellent support and dedication of members of Breese lab both past and present. Drs. George Breese and Darin Knapp have been my mentors throughout the many trials and tribulations of graduate school. The training they have provided me will serve me well in all of my future endeavors. Dr. Knapp has been a great resource and friend through many difficult times. His dedication to me and my success is greatly appreciated and his friendship will forever be cherished. Drs. Bonnie Blake, Hugh Criswell, Thomas McCown, Zhen Ming, and David Overstreet contributed greatly to my success in the lab. In particular, Dr. Blake was an excellent resource during our time together in the lab. I cannot thank her enough for always being there to lend an ear or helpful scientific suggestion. I thank Bob Angel, lab manager of the Breese lab, and Todd O’Buckley, lab manager of the Morrow lab, for their excellent help and skills in getting my projects up and running. Their assistance made my progress possible, and their friendship made my time in the lab more enjoyable. Dr. Dave Werner provided excellent mentorship and education on how to perform western blot analysis and qPCR. His help was invaluable.
vi
special thanks to Dr. Malanga. He was one of my first and biggest advocates in the program and has remained my friend and confidant during my entire tenure.
Drs. Ann Stuart and John Moore were a great inspiration to me throughout my tenure here at UNC. I will miss our many great conversations down at the lake. The late Dr. Alfred Dufty Jr. was my master’s thesis advisor at Boise State University (BSU) and a great mentor both while at I was at BSU and during my tenure here at UNC. His passing was a great lost to science as well as to the many young scientists he trained.
I would also like to extend my gratitude to Dr. Jane Saiers, Wayne Brinster, Tracy Dooley and Jason Payne who were remarkable in their ability to distract me from the woes of graduate school. My time here in North Carolina has been greatly enhanced by knowing them, and they will always hold a special place in my memory of the graduate school at UNC.
Also, I would like to thank my parents for the many years of unwavering support as I pursued this endeavor. They were there for me throughout many a tough time while here at UNC.
vii
TABLE OF CONTENTS
CHAPTER I: GENERAL INTRODUCTION... 1
The Neuroimmune System………...2
TLR4 and Alcohol ... 3
HMGB1... 4
Stress and the Neuroimmune System ... 6
Neuroimmune Sensitization ... 6
Research Objective ... 7
CHAPTER II: GENERAL METHODS...9
Animals ... 10
Liquid Diet ... 10
Acute Ethanol Protocol ... 10
Acute LPS Protocol... 10
Continuous Ethanol Protocol ... 10
Chronic LPS Protocol ... 10
Time Course Following Continuous Ethanol Protocol ... 11
Multiple Withdrawal Protocol ... 11
Continuous Ethanol with Stress Challenge Protocol ... 11
Acute Stress Time Course Protocol ... 11
viii
Drug Preparations ... 12
Brain Tissue Collection ... 12
Real-Time RT-PCR Analysis ... 12
Figures... 14
CHAPTER III: INCREASED CYTOKINE PRODUCTION IN BRAIN FOLLOWING CONTINUOUS ETHANOL EXPOSURE MAY BE MEDIATED BY HMGB1...16
Introduction ... 16
Materials and Methods ... 18
Results ... 19
Discussion ... 23
Figures... 29
CHAPTER IV: ACUTE STRESS FACILITATION OF BRAIN CYTOKINES AFTER CONTINUOUS ETHANOL EXPOSURE IS PREVENTED BY HMGB1 ANTAGONISTS...36
Introduction ... 36
Materials and Methods ... 37
Results ... 38
Discussion ... 42
Figures... 47
CHAPTER V: GENERAL DISCUSSION... 54
Future Work………56
ix
LIST OF FIGURES
Figure 2.1 Experimental protocols for Chapter III ...14 Figure 2.2 Experimental protocols for Chapter IV ...15 Figure 3.1 Effects of acute ethanol versus acute LPS administration
on mRNA for cytokines CCL2, IL1-β, TNFα and for TLR4s ...29 Figure 3.2 Time course following continuous ethanol administration
and the effects of continuous and cycled ethanol on mRNA
for cytokines CCL2, IL1-β, TNFα and for TLR4s ...30 Figure 3.3 Effects of continuous ethanol versus chronic LPS administration
on mRNA for cytokines CCL2, IL1-β, TNFα and for TLR4s ...31 Figure 3.4 Effects of continuous and cycled ethanol on mRNA for
signaling molecules HMGB1, MyD88 and NF-κB ...32 Figure 3.5 Effects of continuous ethanol versus chronic LPS administration
on mRNA for HMGB1, MyD88 and NF-κB ...33 Figure 3.6 Time course of changes to mRNA for HMGB1 and TLR4
following continuous ethanol. ...34 Figure 4.1 Time course of changes in mRNAs for CCL2, IL1-β, and
TNFα and for TLR4 receptors following 1-hr restraint stress. ...47 Figure 4.2 Time course of changes in mRNA for HMGB1 following
1-hr restraint stress………48 Figure 4.3 Effects of continuous ethanol and stress on mRNA for
cytokines CCL2, IL1-β, TNFα and for TLR4s ...49 Figure 4.4 Effects of continuous ethanol and stress on mRNA for HMGB1 ...50 Figure 4.5 Effect of HMGB1 blockade with ethyl pyruvate and glycyrrhizin
on mRNAs for CCL2, IL1-β and TNFα and for TLR4s following
a stress challenge after continuous ethanol exposure. ...51 Figure 4.6 Effect of HMGB1 blockade with ethyl pyruvate and
glycyrrhizin on mRNAs for HMGB1 following a stress challenge
after continuous ethanol exposure ...52 Figure 5.1 Models depicting the influence of HMGB1 on neuroimmune
x
LIST OF ABBREVIATIONS ANOVA analysis of variance
BAL blood alcohol levels
CCL2/MCP1 chemokine (C-C motif) ligand 2, or monocyte chemotactic protein-1
CD control diet
COX2 cyclooxygenase 2
CRF corticotropin releasing factor CRID cytokine release inhibitory drug DAMP damage-associated molecular patterns
DNA deoxyribonucleic acid
ED ethanol diet
ERK extracellular signal-related kinases fMRI functional magnetic resonance imaging HMGB1 high-mobility group protein B1
hr hour or hours
i.g. intragastric
i.p. intraperitoneal
IL1-β interleukin-1 beta
IL-6 interleukin-6
IRF interferon regulatory factor
LPS lipopolysaccharide
min minute or minutes
xi
MyD88 myeloid differentiation factor-88
NF-κB nuclear factor kappa-light-chain-enhancer of activated B cells
PAMP pathogen-associated molecular pattern
PRR pattern-recognizing receptor
qPCR quantitative real-time polymerase chain reaction
RAGE receptor for advanced glycation end product SEM standard error of the mean
TLR toll-like receptor
TLR4 toll-like receptor 4
TNFα tumor necrosis factor-alpha
CHAPTER I:
GENERAL INTRODUCTION
Current diagnostic criteria define alcohol dependence by the presence of at least three of the following criteria for more than a year: tolerance, alcohol withdrawal signs or
symptoms, drinking more than intended, unsuccessful attempts to reduce drinking, excessive time spent related to alcohol, impaired social or work activities due to alcohol and continued use despite physical or psychological consequences (DSM IV, 1994). Alcohol abuse is defined by the presence of a minimum of one of the following criteria for more than a year: role impairment, hazardous use, legal problems, or social or interpersonal problems due to alcohol (DSM IV, 1994). The lifetime prevalence of alcohol dependence is 12.5%; that of alcohol abuse is 17.8% (Hasin et al., 2007). According to the latest report from the World Health Organization, alcohol is responsible for 4.5% of the total disease burden worldwide (WHO, 2009). These statistics underscore the importance of research into the mechanisms underlying alcoholism.
2
reviewed in Breese et al., 2011), which may also involve the neuroimmune system (Breese et al., 2008; Knapp et al., 2011).
The Neuroimmune System
The innate immune response in brain consists of a rapid response to stimuli from microglia and infiltrating macrophages (Glezer et al., 2007). Microglia respond to various signals via specific pattern-recognizing receptors (PRR) including the pathogen-associated molecular pattern (PAMP) receptors such as the toll-like receptor (TLR). A key part of the innate immune response, TLRs are responsible for recognizing and responding to pathogens. Activation of toll-like receptor 4 (TLR4) induces a complex signaling cascade resulting in the recruitment of one of two major adaptor molecules myeloid differentiation factor-88 (MyD88) or TIR-domain-containing adaptor-inducing interferon-β (TRIF) (reviewed in Vartanian and Stenzel-Poore, 2010). Differential activation of each pathway is condition dependent and results in a wide array of potential responses (Vartanian and Stenzel-Poore, 2010). For example, recruitment of MyD88 can culminate in transcription of nuclear factor kappa-light-chain-enhancer of activated B cells (NF-κB), activation of which induces a proinflammatory response. Recruitment of TRIF can culminate in transcription of interferon regulatory factor (IRF), activation of which induces late-phase NF-κB activation and co-stimulatory molecules (Akira and Takeda, 2004).
Besides responding to exogenously introduced pathogens, TLRs recognize
3
et al., submitted; Pascual et al., 2011). Such changes are accompanied by the prolonged increase in cytokines observed following chronic ethanol exposure in mice (Qin et al., 2008) and human alcoholics (He and Crews, 2008).
TLR4 and Alcohol
Recent experimental studies demonstrate a link between alcohol and activation of the neuroimmune system via TLR4 signaling (Alfonso-Loeches et al., 2010; Blanco et al., 2005; Fernandez-Lizarbe et al., 2008; 2009; Wu et al., 2012). It has been proposed that ethanol’s action at TLR4 receptors is similar to that of lipopolysaccharide (LPS) agonist action on this receptor (Fernandez-Lizarbe et al., 2008). Specifically, Fernendez-Lizarbe et al. (2008) provide evidence that low to moderate concentrations of ethanol facilitate the recruitment of TLR4 receptors into lipid rafts in a manner similar to that of LPS stimulation (Triantafilou et al., 2002). The authors suggest that this mechanism is responsible for the increase in brain cytokines associated with TLR4 signaling.
4
interleukin-1 beta (IL1-β) response was potentiated. Considered in aggregate, these observations suggest multiple modes of neuroimmune action for acute ethanol.
In contrast to acute ethanol, chronic ethanol exposure is characterized by elevated levels of proinflammatory cytokines in the liver (Qin et al., 2008; Valles et al., 2003), brain (Qin et al., 2008), and serum (McClain and Cohen, 1989; McClain et al., 1999; Qin et al., 2008). Additionally, prior chronic ethanol exposure potentiates the effects of LPS challenge on cytokines (Crews et al., 2006; Qin et al., 2008).
Knockout mouse models of TLR4 exhibit protection from various consequences of chronic ethanol exposure in accord with a relationship to TLR4 function. For example, Uesugi et al. (2001) found TLR4-deficient mice to be protected against ethanol-induced liver injury. The protective nature of TLR4 knockout extends further to prevention of the
inflammatory response induced by ethanol in glia (Alfonso-Loeches et al., 2010; Fernandez-Lizabre et al., 2009) and protection from neurodegeneration induced by chronic ethanol intake (Alfonso-Loeches et al., 2010). Further, Pascual et al. (2011) found that the persistent memory deficits and anxiety-related behavioral impairment seen in wild-type mice following chronic ethanol exposure were not observed in TLR4 knockout mice. Wu et al. (2012) found that inhibition of the TLR signaling pathway either by knockout or pharmacological means reduced the sedation and motor impairment associated with ethanol. Taken together, these studies show a critical role of TLR4 signaling in the pathology associated with chronic ethanol exposure.
HMGB1
5
2000; Goodwin et al., 1973), high-mobility group protein B1 (HMGB1) has a second, extracellular role in the mediation of inflammation (Kim et al., 2006; Park et al., 2004; Yang et al., 2005). Extracellular HMGB1 has been implicated in the pathology of many diseases including liver and lung inflammation (Abraham et al., 2000), sepsis (Wang et al., 1999), arthritis (Lotze and Tracey 2005), cancer (Lotze and Tracey 2005), epilepsy (Maroso, et al., 2010), and multiple sclerosis (Andersson et al., 2008). HMGB1, a nuclear associated protein, is released from cells either passively (e.g., necrotic cells; Scaffidi et al., 2002) or actively [e.g., activated macrophages and monocytes (Wang et al., 1999) and neurons and astrocytes (Faraco et al., 2007)]. Active secretion of HMGB1 involves several steps: (1) HMGB1 exclusion from the nucleus due to hyper-acetylation (Palumbo et al., 2004); (2) sequestration into cytoplasmic secretary lysosomes; and (3) exocytosis (Gardella et al., 2002; Yang et al., 2011). Once released, extracellular HMGB1 can bind directly to TLR2/4 and to the receptor for advanced glycation end product (RAGE) to instigate inflammatory responses (Green et al., 2009; Park et al., 2006; Rovere-Querini et al., 2004; Yu et al., 2006). HMGB1 is a key regulator of the innate immune response and works in a feed-forward mechanism to activate RAGE, TLR2, and TLR4 (Yang et al., 2010). Activation of RAGE by HMGB1 leads to activation of ERK and p38 pathways to activate transcription factor NF-κB (Rauvala and Rouhiainen, 2007). Activation of TLR2 or TLR4 by HMGB1 also leads to the activation of NF-κB through the MyD88 pathway (Park et al, 2004). Evidence also suggests that HMGB1 functions as a universal sentinel for nucleic acid-mediated innate immune responses (e.g., nucleic-acid-sensing TLRs 3,7,9) (Yanai et al., 2009) and may also enhance
6 Stress and the Neuroimmune System
Stress differs from traditional pathogenic or traumatic mediators of neuroimmune activation in that it is a “sterile” stimulus. Little is known about this recently recognized role of stress as a “sterile” activator of the neuroimmune system (Andersson and Tracey, 2011). However, several studies have demonstrated that various acute stress protocols increase brain cytokines (Blandino et al., 2009; Deak et al., 2005). Knapp et al. (2011) documented that the protein levels of TNFα were elevated in whole brain 4.5 hr following a 1-hr restraint stress in adult rats. Similar results were obtained in adolescent rats. TNFα protein levels were
elevated 5 hr- after 45-min or 90-min restraint stress in adolescent rats (Knapp, unpublished data). Not all stressors activate a central proinflammatory response (Deak et al., 2003; Plata-Salaman et al., 2000), however. The effects of stress on neuroimmune function might differ as a function of factors such as duration, intensity, and type of stressor (Hueston et al., 2011). Sugama et al. (2009) showed that acute stress was associated with concomitant activation of microglia and neurons. This association of microglial activation with neuronal activation may explain the rapid activation of the neuroimmune system following stress.
Neuroimmune Sensitization
Results of several studies suggest that alterations in basal levels of regulatory elements of the neuroimmune system may underlie the increased sensitivity to subsequent neuroimmune system challenge. Barnum et al. (2008) were the first to report that individual differences in basal levels of cytokine expression in the brain predicted neuroimmune consequences to an acute stress challenge. Girotti et al. (2011) demonstrated that
7
of microglia resulting in exaggerated inflammatory responses to additional stimuli in aging. While neuroimmune sensitization has thus been consistently observed, the mechanisms of neuroimmune sensitization have not been elucidated to date.
Research Objective
Several lines of evidence suggest that neuroimmune activation and, ultimately, sensitization to such activation could be persistent consequences of continuous ethanol exposure. Ethanol has been shown to increase cytokines in vivo and in vitro in animal models. Zou and Crews (2010) showed induction of proinflammatory cytokines TNFα, MCP-1, and IL-1β in brain slice cultures exposed to ethanol. Ten days of ethanol exposure (5g/kg/day) significantly increased both messenger ribonucleic acid (mRNA) expression and protein levels of TNFα and interleukin-6 (IL-6) in mice (Crews et al., submitted). Human alcoholics have abnormalities in basal cytokine tone (He and Crews, 2008) and other
neuroimmune regulatory elements (Liu et al., 2006; Okvist et al., 2007). Furthermore, when presented with aversive imagery, abstinent alcoholics show enhanced neural activation compared to nondrinkers measured by functional magnetic resonance imaging (fMRI) (Gilman and Hommer, 2008), a finding consistent with the presence of central sensitization to neural activation. Breese et al., (2004) demonstrated a reemergence of anxiety-like behavior induced by a single acute restraint stress in rats 3 days following cessation of chronic ethanol treatment.
8
chronic ethanol exposure is not currently understood. The purpose of this research was to explore the means by which ethanol and stress alone and in combination influence
CHAPTER II: GENERAL METHODS
Animals
Adult male Sprague Dawley rats (Charles-River, Raleigh, NC) were obtained at 180-200g. Upon arrival, animals were group housed and fed RMH3000 rat chow (TestDiets, Richmond, IN) for 2-3 days prior to the start of the study to acclimate to the new
environment (temperatures 70-72˚ F; humidity 40-60% ; and light/dark cycle 12hr:12hr, lights on 7:00-19:00hrs). All animals were singly housed for the duration of the experiments herein. All study methods were approved by the University of North Carolina Chapel Hill Institutional Animal Care and Use Committee.
Liquid Diet
A nutritionally complete and calorically balanced liquid diet was made from a lactalbumin-dextrose-based mixture with added vitamins and minerals (Dyets, Bethlehem, PA) and used for the control diet (CD) or ethanol diet (ED) protocols as previously described and used routinely in the lab (e.g., Frye et al., 1983; Knapp et al., 1998; 2007a; 2011;
10
withdrawal when sacrificed, well beyond when blood alcohol levels (BALs) would have returned to zero (Overstreet et al., 2002).
Acute Ethanol Protocol
A single dose of ethanol was administered via oral gavage. The 2.75 g/kg oral dose was chosen (Fig. 2.1A) to approximate peak levels (≈185-200 mg% BAL) previously found with chronic ethanol diet protocols (Overstreet et al., 2002; Wills et al., 2008). Four hr following ethanol or saline administration, the rats were sacrificed and brains collected as described below.
Acute LPS Protocol
To determine the effects of a single exposure to LPS (Calbiochem, La Jolla, CA), rats were injected intraperitoneally (i.p.) (250μg/kg at 125 μg LPS/ml) and sacrificed 4 hr later (n=16, Fig. 2.1B). Brains were collected and tissue processed as described below.
Continuous Ethanol Protocol
To determine the effects of continuous ethanol exposure, rats were provided with liquid diet (7% wt/vol) for 15 continuous days (Frye et al., 1983) and sacrificed 24 hr into withdrawal (n=32, Fig. 2.1C). Brains were collected and processed for biochemistry as described below.
Chronic LPS Protocol
11
Time Course Following Continuous Ethanol Protocol
To determine the time of peak brain cytokine production and the duration of changes, animals were sacrificed 24, 48, and 72 hr and 7 days following withdrawal from the
continuous ethanol protocol (n=40, Fig. 2.1E). Brains were collected and processed as described below.
Multiple Withdrawal Protocol
To compare the effects of continuous ethanol exposure with those of cycled ethanol exposure, rats were exposed to three 5-day bouts of ED separated by 2 days of CD
(Overstreet et al., 2002) (n=28, Fig. 2.1F). The rats were sacrificed 24 hr into the third withdrawal period and the brains collected for cytokine measurement.
Continuous Ethanol with Stress Challenge Protocol
To determine the effects of stress following continuous ethanol exposure, rats were provided with ED (7% wt/vol) for 15 continuous days (Frye et al., 1983) and withdrawn for 24 hr prior to a 1-hr restraint stress. Four hr following the restraint stress, the animals were sacrificed and brains were immediately collected and frozen for later processing for
biochemistry as described below (n=64, Fig. 2.2A).
Acute Stress Time Course Protocol
To determine the time course of changes in cytokines following acute stress
application, rats were subjected to 1 hr of restraint stress and brains were collected 2, 4, 8, 24, and 48 hr later (n=40, Fig. 2.2B).
12
were treated with either glycyrrhizin or ethyl pyruvate. Four hr following the restraint stress, the animals were sacrificed and brains were collected and processed for biochemistry as described below (n=40, Fig. 2.2C).
Drug Preparations
LPS was prepared in a solution of sterile saline at 125 μg/ml and administered at 2 ml/kg to equal a dose of 250 μg/kg i.p. Glycyrrhizin was prepared in a solution of sterile saline at 25 mg/ml and administered at 2 ml/kg to equal a dose of 50 mg/kg i.p. (Ohnishi et al., 2011). Ethyl pyruvate was prepared in a solution of sterile saline at 37.5 mg/ml and administered at 2 ml/kg to equal a dose of 75 mg/kg i.p. (Su et al., 2011). All control subjects received i.p. injections of sterile saline at 2 ml/kg.
Brain Tissue Collection
All brains were collected following rapid decapitation. Whole brains were extracted and immediately frozen in isopentane at -25˚ C prior to storage at -80˚ C for later
microdissection of the cortex. Cortical tissue was divided into two halves to provide tissue for quantitative real-time polymerase chain reaction (qPCR) analysis.
Real-Time RT-PCR Analysis
Total RNA was extracted from homogenized microdissected cortex regions using Trizol (Invitrogen, Carlsbad, CA) and used for reverse transcription PCR analysis as described elsewhere (Qin et al., 2008). The following primer sequences were used: CCL2, 5'-
TCACGCTTCTGGGCCTGTTG-3' (forward) and 5'- CAGCCGACTCATTGGGATCATC-3' (reverse); IL1-β, 5'- GAAACAGCAATGGTCGGGAC-3' (forward) and 5'-
13
GCCGGAAAGTTATTGTGGTGGT-3’ (forward) and 5’-ATGGGTTTTAGGCGCAGAGTTT-3’ (reverse); NF-κB, 5'- GGCAGCACTCCTTATCAA -3' (forward) and 5'-
GGTGTCGTCCCATCGTAG -3' (reverse); MyD88, 5'- GGCAGGCTGCTAGAGTTGCT -3' (forward) and 5'- TGTGGGACACTGCTCTCCAC-3' (reverse); HMGB1, 5'-
GAGATCCTAAGAAGCCGAGA-3' (forward) and 5'- CTTCCTCATCCTCTTCATCC-3' (reverse);
β-actin, 5'- ATGGTGGGTATGGGTCAGAAGG -3' (forward) and 5'-
GCTCATTGTAGAAAGTGTGGTGCC-3' (reverse). SYBR green PCR master mix (Applied Biosystems, Foster City, CA) was used for qPCR analysis. The cycle time (CT) values were
normalized with β-actin to assess the relative differences in expression between groups. Calculated values were expressed as relative change compared to controls set as 100%.
Figur
Figur res
re 2.1: Schemmatics depiccting the diet
14
Figurre 2.2: Schemmatics depiccting the diet
15
CHAPTER III:
INCREASED CYTOKINE PRODUCTION IN BRAIN FOLLOWING CONTINUOUS ETHANOL EXPOSURE IS ASSOCIATED WITH ELEVATION OF HMGB1
Introduction
Although alcohol abuse affects many organs throughout the body, its effects on brain contribute most significantly to the pathology of abuse. Among several factors implicated in initiating and sustaining alcohol abuse and alcoholism, dysregulation of the neuroimmune system has recently come to light as playing a significant role in adaptive processes induced by continuous ethanol (Alfonso-Loeches et al., 2010; Breese et al., 2008; Crews et al., submitted; He and Crews 2008; Knapp et al., 2011; Pascual et al., 2011; Qin et al., 2008). Recent experimental studies have demonstrated a link between ethanol and the activation the neuroimmune system via TLR4 signaling (Alfonso-Loeches et al., 2010; Blanco et al., 2005; Fernandez-Lizarbe et al., 2008; Fernandez-Lizarbe et al., 2009; Wu et al., 2012). However, in vivo evidence of TLR4 signaling effects of acute and chronic ethanol compared with those
of LPS, the prototypical TLR4 ligand, is conflicting (Okun et al., 2009).
17
of ethanol facilitate the recruitment of TLR4 receptors into lipid rafts in a manner similar to that of LPS stimulation (Triantafilou et al., 2002). Crews et al. (submitted) found increased expression of TLR4 in post-mortem human alcoholic frontal cortex as well as in mice following extended continuous ethanol administration. Further, knockout mouse models of TLR4 have shown protection from various consequences of continuous ethanol exposure in accord with an involvement of TLR4 in ethanol action. For example, Uesugi et al. (2001) found that TLR4- deficient mice were protected from ethanol-induced liver injury. This protective effect of knocking out TLR4 extends to prevention of the inflammatory response induced by ethanol in glia (Alfonso-Loeches et al., 2010; Fernandez-Lizabre et al., 2009) and the neurodegeneration induced by chronic ethanol intake (Alfonso-Loeches et al., 2010). Pascual et al. (2011) found that the persistent memory deficits and anxiety-related behavioral impairment seen in wild-type mice following chronic ethanol exposure were not observed in TLR4 knockout mice. Taken together, these studies implicate TLR4 signaling in the
pathology associated with chronic ethanol exposure. Further, Wu et al. (2012) found that inhibition of the TLR signaling pathway either by knockout or pharmacological means reduced the sedation and motor impairment associated with acute ethanol administration. Collectively, these studies provide convincing evidence that TLR4 receptors contribute to ethanol action on brain.
Ethanol is unlikely to be a direct agonist for TLR4 signaling. To shed light on the mechanism of ethanol-initiated, TLR4-mediated changes in cytokines, the present
18 Materials and Methods
Animals
For standard animal housing and diet procedures, refer to General Methods (Chapter II).
Experimental Protocols
For detailed descriptions of experimental protocols, refer to General Methods (Chapter II). Briefly, acute ethanol exposure consisted of a dose of 2.75 g/kg administered via oral gavage (i.g.) of a 20% wt/vol ethanol and distilled water solution. Control animals for the acute ethanol study received an i.g. volume of water equivalent to the average volume of the ethanol-treated animals. Both control animals and ethanol-treated animals were sacrificed 4 hr following ethanol or water administration and brains collected immediately. For the acute LPS protocol, 250 μg/kg was administered via i.p. injection of 125 μg LPS/ml in sterile water. Control animals for the acute LPS protocol received an i.p. injection of sterile saline equivalent to the average volume of the LPS administered to the LPS treated animals in the study. Both control animals and LPS-treated animals were sacrificed 4 hr following LPS or water administration and brains collected immediately.
19
given to the LPS-treated animals. All animals in this experiment were sacrificed 24 hr following final LPS injection for brain collection. The protocol for the time course following continuous ethanol exposure is as described above with additional animals sacrificed at 24, 48, and 72 hr and 7 days following removal of ethanol after day 15. All animals were maintained on rat chow following the initial 24-hr withdrawal. Control animals were
sacrificed at each time point to account for any differences in age of animals. Animals in the multiple withdrawal experiment received ED for 3 cycles of 5 consecutive days with 2 days of CD between each cycle of ED and were sacrificed 24 hr after withdrawal from the third cycle of ED.
Statistical Analysis
All data were evaluated for statistical significance with student’s t-test or analysis of variance (ANOVA) as appropriate using Graph Pad Prism 4.0 (Graph Pad Software, Inc., San Diego, CA) and expressed as mean ± standard error of the mean (SEM). P-values < 0.05 were considered statistically significant.
Results
Comparison of Acute Ethanol to Acute LPS
20
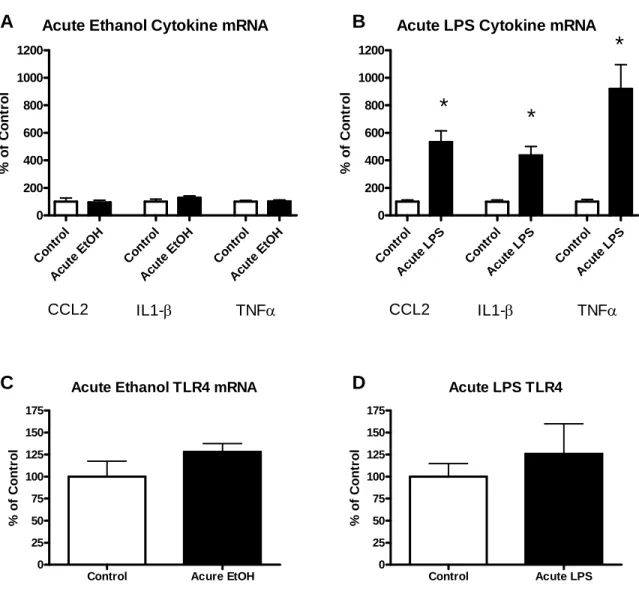
levels, an acute dose of LPS (250 μg/kg) caused a several-fold increase in CCL2 (432%), IL1-β (337%), and TNFα (920%) mRNAs (all p<0.0001 Fig. 3.2B). Neither an acute dose of ethanol nor an acute dose of LPS increased TLR4 mRNA at 4 hr (all p>0.05; Fig. 3.1C & 3.1D). Thus, while acute ethanol exposure did not affect cytokine mRNAs at 4 or 24 hr after the exposure, acute LPS caused a several-fold increase in mRNAs for CCL2, IL1-β, and TNFα at 4 hr. Neither exposure affected TLR4 mRNA. The effects of acute ethanol on cytokine mRNAs, thus, clearly differ from those of acute LPS.
Comparison of Continuous Ethanol to Chronic LPS
To assess potential differences in the effect of continuous ethanol and chronic LPS exposure on cytokines in brain, mRNAs for CCL2, IL1-β, and TNFα were measured 24 hr following 15 consecutive days of ethanol exposure (7% ethanol wt/vol in liquid diet) or following 10 daily doses (250 μg/kg) of LPS. The mRNAs for all cytokines showed
significant increases over controls (CCL2, 144.9%; IL1-β 97.3%; TNFα 125.0%; all p<0.05, Fig. 3.2A) 24 hr following the continuous ethanol protocol. In contrast, 24 hr after the chronic LPS protocol, no significant increases were observed for any of these cytokine mRNAs (all p>0.05; Fig. 3.2B). A significant increase in TLR4 mRNA was found 24 hr after both the continuous ethanol protocol (63.3% increase) and the chronic LPS (79.2% increase) protocol (all p<0.05, Fig. 3C & 3D, respectively). The effects of continuous ethanol on cytokine mRNAs, thus, clearly differ from those of chronic LPS.
Time Course of Changes in Cytokines Following Continuous Ethanol
21
expression 24 hr after the last exposure (Pascual et al., 2007; Qin, et al., 2008). In rats, 16 hr of abstinence from chronic ethanol exposure was associated with induction of a peak
expression of cyclooxygenase 2 (COX2), a proinflammatory oxidase (Knapp and Crews, 1999).
Based upon these previous findings, mRNA expression for CCL2, IL1-β, and TNFα
was measured in brain at various times (0 and 24 hr and 3 and 7 days) after 15 days of continuous ED (Fig. 2.1C). No change in cytokines was observed in the rats sacrificed while still exposed to ethanol, (i.e., T=0; no abstinence; Fig. 3.3). However, after 24 hr of
abstinence, expression of CCL2 increased by 102%, IL1-β by 93.8%, and TNFα by 107% (all p<0.05)—findings in agreement with results in Fig. 3.2. Following the increase after 24 hr of ethanol abstinence, cytokine mRNAs gradually declined toward control levels by 3 days (72 hrs.); CCL2= 67.7%, IL1-β=100.9%, and TNFα=60.7% increase over contols (Fig. 3.3). The mRNA levels for all cytokines had returned to control levels by 7 days (Fig. 3.3). These findings confirm that continuous ethanol exposure followed by abstinence for 24 hr increases mRNA expression of CCL2, IL1-β, and TNFα in brain. Values peak at 24 hr, and changes do not persist beyond 7 days.
Comparison of Continuous and Cycled Ethanol
Cycled ethanol exposure increase withdrawal symptoms such as susceptibility to seizures and anxiety-like behavior more than a comparable continuous alcohol exposure does (McCown and Breese, 1990; Overstreet et al., 2002). This observation prompted studies to determine if differences in proinflammatory gene induction are observed after these different modes of chronic ethanol exposure (Breese et al., 2005, 2011). It was found that CCL2,
22
(CCL2, 79.8% increase; IL1-β, 102.3% increase; TNFα, 96.2%) and cycled ethanol exposure (CCL2, 70.5% increase; IL1-β, 82.0% increase; TNFα, 108.4%) 24 hr after ethanol
withdrawal (all p<0.05 vs. control; Fig. 3.4A). However, no difference between the continuous ethanol group and the cycled ethanol was observed (p>0.05; continuous vs. cycled ethanol). Like the cytokine mRNAs, TLR4 mRNA was increased by both the
continuous ethanol exposure (122.6%) and the intermittent cycled ethanol exposure (85.2%) (p<0.05), but the increases did not differ between groups (p>0.05; Fig. 3.4B). Data from this study replicate results from the continuous ethanol investigation (Fig. 3.2), in which CCL2, IL1-β, TNFα, and TLR4 mRNAs were initially found to be increased 24 hr after ethanol withdrawal. Continuous ED and cycled ED increased expression of brain CCL2, IL1-β, TNFα and TLR4 mRNA to similar degrees after 24 hr of abstinence from ethanol. Effects of Continuous and Cycled Ethanol on HMGB1, My88, and NFκB
In addition to determining mRNAs for cytokines for both continuous and cycled ethanol (Fig. 3.4A), mRNA changes in TLR4 (Fig. 3.4B) and the mRNAs for HMBG1, MyD88 and NFκB (Fig. 3.4C) were determined in these groups. The mRNA for TLR4 was increased by both ethanol protocols (Fig. 3.4B) as was the mRNA for HMGB1 (continuous ethanol, 64.4%; cycled ethanol, 57.3%; p<0.05; Fig. 3.4C). However, the difference between the continuous ethanol group and the cycled ethanol group in changes in mRNA for HMGB1 was not statistically significant (p>0.05). Further, neither continuous nor cycled ethanol caused a significant change in levels of MyD88 or NF-κB mRNA (p>0.05; Fig. 3.4C). Thus, both the continuous and cycled ethanol protocols increased expression of the mRNA for HMGB1, an agonist for TLR4, as well as the mRNA for the TLR4 in brain.
23
Whether the increase in HMGB1 by the continuous ethanol protocol would also be observed after chronic LPS exposure was investigated in a study comparing HMBG1
response after continuous ethanol versus chronic LPS. Consistent with results shown in Fig. 3.4C, the continuous ethanol exposure significantly elevated HMGB1 mRNA by 102.8% (Fig. 3.5A) (p<0.05) without inducing a significant change in either MyD88 or NF-κB (p>0.05) (Fig. 3.5A). Unlike continuous ethanol, chronic LPS did not increase HMGB1, MyD88, or NF-κB (all p>0.05) (Fig. 3.5B).
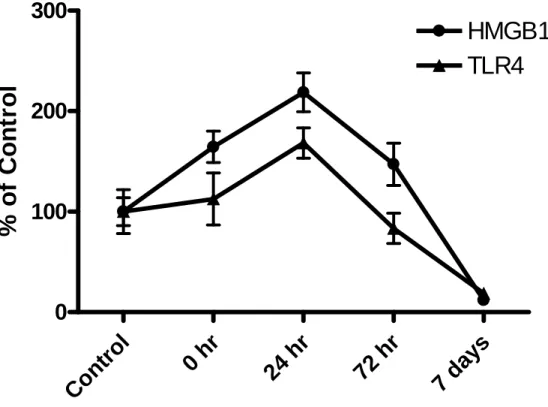
The time course of the HMGB1 change was determined from the tissue utilized in the experiment described in Fig. 3.4. At the time prior to ethanol removal (T=0), the level of HMGB1 was elevated by 65% (Fig. 3.6). By 24 hr, the HMGB1 was significantly elevated to 119% of control (p<0.05) in agreement with the increase noted in Fig. 3.5B.
Subsequently, HMGB1 mRNA levels decreased to control levels by 72 hr and were 88% below control levels by 7 days after ethanol removal (p<0.05; Fig. 3.6). While TLR4 expression was not elevated at T=0 in the rats that received continuous ethanol exposure (Fig.3.6), the TLR4 level was elevated by 68.3% 24 hr after withdrawal from ethanol (p<0.05, Fig.3.6) in corroboration of data in Fig. 3.2C. TLR4 mRNA returned to control levels by 72 hr and was 81% below control levels by 7 days (p<0.05; Fig. 3.6).
Discussion
24
brain (Alfonso-Loeches et al., 2010). TLR4 knockout mice also show altered acute ethanol responses (Wu et al., 2012). Fernendez-Lizarbe et al. (2008) suggested that ethanol induces cytokines in brain by causing accumulation of TLR4s and related signaling molecules into lipid rafts to induce signaling through TLR4s. This hypothesis is compelling but incomplete. The mechanism by which continuous ethanol involves TLR4 function to increase cytokines in brain remains unclear, particularly because ethanol cannot act as an agonist on TLR4s. The present studies were undertaken to explore possible mechanisms by which chronic alcohol might influence TLR4 signaling to increase cytokines in brain. Effects on
proinflammatory gene expression and signaling proteins of LPS, the prototype TLR4 direct agonist, were compared with those of acute and continuous ethanol.
The results show that an intoxicating acute dose of ethanol did not increase mRNA for CCL2, TNFα, IL1-β, or TLR4 in cortex of Sprague-Dawley rats 4 or 24 hr after
administration. Consistent with these findings, Buck et al. (2011) found no increase in mRNAs for IL-6 or IL1-β in Sprague-Dawley rats 12 hr after 4 g/kg of ethanol. However, Qin et al. (2008) found increased mRNAs for TNFα and CCL2, but not IL1β, 24 hr after a single 5 g/kg oral dose of ethanol. The discrepant results of Qin et al. (2008) might be explained by the use of mice rather than rats and/or by use of a higher dose of ethanol in the mouse studies than in the rat studies.
Unlike acute ethanol, which did not cause acute cytokine changes, acute
25
blood-borne TNFα into the brain, where it contributes to the cytokine increase by LPS. Whether this mechanism of TNFα entrance from the periphery to brain is critically
responsible for the LPS-induced changes observed in the present study could be determined by administering LPS into brain. Regardless, the present findings provide clear evidence for a fundamental difference between the effects of acute LPS on brain cytokine changes and those of acute ethanol at the doses studied.
Unlike acute ethanol, which did not cause acute cytokine changes, continuous ethanol exposure (continuous 7% alcohol diet for 15 days) approximately doubled CCL2, IL1-β, and TNFα in the cortex of rats 24 hr after ethanol removal (Fig. 3). TLR4 levels were also increased after this continuous ethanol protocol. Previous studies in C57Bl/6 mice found that chronic administration of ethanol (5 g/kg, i.g.) for 10 days followed by 24 hr of ethanol abstinence increased brain CCL2 and TNFα but not IL1-β or other cytokine mRNAs (Qin et al., 2008).
Unlike continuous ethanol, chronic LPS (250 µg/kg daily for 10 days) produced no change in CCL2, IL1β, and TNFα mRNA in the cortex of the rats 24 hr after the final LPS dose. Like continuous ethanol, however, chronic LPS induced a significant increase in TLR4. Thus, continuous ethanol differed from chronic LPS in effects on mRNA changes in cytokines although both increased TLR4 mRNA in brain.
26
by 7 days after cessation of continuous ethanol exposure. These findings indicate that chronic 7% ED increases CCL2, IL1β, TNFα, and TLR4 mRNA in brain with peak effects approximately 24 hr after abstinence from ethanol.
27
In the current investigation, mRNA for the endogenous agonist for TLR4s, HMGB1 (Andersson and Tracey, 2011; Lin et al., 2011), was elevated by both continuous and cycled ethanol protocols without significant changes in mRNAs for MyD88 (Janssens and Beyaert, 2002) or NF-κB (Baeuerle and Henkel, 1994; Fitzgerald et al., 2003)—signaling proteins linked to TLR4 function (Fig.3.5C). Based upon the finding that HMGB1 mRNA was nearly doubled 24 hr after the two modes of chronic alcohol exposure, an investigation was initiated to assess HMGB1 mRNA changes over time during and after the continuous chronic alcohol protocol. HMGB1 mRNA was moderately elevated prior to cessation of the chronic alcohol diet (T=0)—a time when TLR4 and cytokine mRNAs were not different from control (Fig.3.6). By 24 hr after cessation of chronic alcohol, the mRNA for HMGB1 was significantly elevated (Fig.3.6) as were the mRNAs for cytokines (Fig. 3.3). HMGB1 and TLR4 mRNAs gradually fell to control levels by 3 days and were below control levels by 7 days after ethanol removal (Fig. 3.6). The time course, prior to and after the continuous ethanol exposure, of the change in HMGB1 mRNA was similar to the time courses of the changes in the cytokine mRNAs. These changes occurred in the absence of effects on MyD88 or NF-κB 24 hr after cessation of continuous ethanol exposure (Fig. 3.5C). This continuous-ethanol-induced increase in HMGB1 and TLR4s possibly explain the ethanol induction of brain TNF, CCL2, and IL1-β.
Although both continuous ethanol and chronic LPS increased TLR4 mRNA in brain, chronic LPS, unlike continuous ethanol, did not significantly change CCL2, IL1β, or TNFα
28
intriguing possibility that HMGB1 released onto TLR4s during withdrawal from chronic alcohol may be responsible for the increase in brain cytokines would help to explain earlier findings relevant to TLR4s and ethanol action (Alfonso-Loeches et al., 2010; Blanco et al., 2005; Fernandez-Lizarbe et al., 2008; 2009; Valles et al., 2004).
The capacity for HMGB1 to induce cytokines is documented in the literature (Faraco et al., 2007; Lin et al., 2012; Andersson and Tracy, 2011; Mϋller et al., 2001; Yang et al., 2005). In a recent study, Crews et al. (submitted) observed that HMGB1 neutralizing antibodies added to brain slice cultures blunted the ability of ethanol to induce IL1-β, a finding consistent with the possibility that ethanol activation of IL1-β occurs through
29 Figures
Acute Ethanol Cytokine mRNA
Cont rol Acute EtO H Cont rol Acute EtO H Cont rol Acute EtOH 0 200 400 600 800 1000 1200
CCL2 IL1-β TNFα
% o f C o n tr o l
Acute LPS Cytokine mRNA
Cont rol Acut e L PS Cont rol Acute LP S Cont rol Acute LP S 0 200 400 600 800 1000 1200
CCL2 IL1-β TNFα
*
*
*
% o f C o n tr o lAcute Ethanol TLR4 mRNA
Control Acure EtOH
0 25 50 75 100 125 150 175 % of Cont ro l
Acute LPS TLR4
Control Acute LPS
0 25 50 75 100 125 150 175 % of Cont ro l D A B C
Figure 3.1: Effects of acute ethanol versus acute LPS administration on mRNA for cytokines CCL2, IL1-β, TNFα and for TLR4s in cortex. Cytokine induction was observed following acute LPS (250 mg/kg) but not acute ethanol (2.75 g/kg). A) An acute single dose of ethanol resulted in no significant increase in mRNA of cytokines CCL2, IL1-β, or TNFα (all p>0.05) at 4 hr post administration. B) An acute single dose of LPS at 250 mg/kg increased mRNA of cytokines CCL2, IL1-β, and TNFα (CCL2 t(17)=6.07, p<0.0001; IL1-β t(16)=6.31,
p<0.0001; TNFα t(13)=4.97, p=0.0003) 4 hr following injection. C) Acute ethanol did not
30
Acute Ethanol Cytokine mRNA
Contr ol Acute EtO H Cont rol Acut e E tOH Cont rol Acute EtO H 0 200 400 600 800 1000 1200
CCL2 IL1-β TNFα
% of C ont ro l
Acute LPS Cytokine mRNA
Contr ol Acute LPS Cont rol Acut e LP
S Cont rol Acute LPS 0 200 400 600 800 1000 1200
CCL2 IL1-β TNFα
*
*
*
% of C ont ro lAcute Ethanol TLR4 mRNA
Contr ol Acute EtO H 0 25 50 75 100 125 150 175 % of C ont ro l
Acute LPS TLR4
Cont rol Acute LPS 0 25 50 75 100 125 150 175 % of Cont ro l D A B C
Figure 3.2: Effects of continuous ethanol versus chronic LPS administration on mRNA for cytokines CCL2, IL1-β, TNFα and for TLR4s in cortex. Cytokine induction differed between animals treated with a continuous ethanol protocol and those treated with a chronic LPS protocol. A) Cytokines CCL2, IL1-β, and TNFα were increased 24 hr into withdrawal following continuous ethanol exposure compared to non-treated controls (t(15)=4.53, p=0.0004; t(20)=3.42, p=0.0027; t(21)=5.443, p<0.0001, respectively). B) No significant increase in cytokine mRNA was observed 24 hr after chronic LPS exposure (all p<0.05). C) Continuous ethanol exposure significantly increased TLR4 mRNA expression (t(23)=2.669,
31
Time Course of Cytokine mRNA Levels
Following Continuous Ethanol Exposure
Con
trol 0 hr
24 hr 72 h
r
7 d ays 0
50 100 150 200 250 300
TNFα
IL1β
CCL2
(%
of
C
ont
ro
l)
32
Continuous or Cycled Ethanol Cytokine mRNA CD Chr onic EtO H Cycl ed E
tOH CD
Ch roni c E tOH Cyc led
EtOH CD
Chr onic
EtOH
Cycl ed Et
OH
0 100 200 300
CCL2 IL1-β TNFα
* * * % o f C ont ro l
Continuous or Cycled Ethanol TLR4 mRNA
CD
Chr oni
c Et OH
Cycl ed Et
OH 0 100 200 300 * % of C ont ro l
Continuous or Cycled Ethanol mRNA CD Chr onic EtO H Cycle d E
tOH CD
Chro nic EtO H Cyc led
EtOH CD
Chr onic EtO H Cycl ed EtOH 0 100 200 300
HMGB1 MyD88 NF-κB * % of C ont ro l A C B
Figure 3.4: Effects of continuous and cycled ethanol exposure on mRNA for cytokines, TLR4 and the signaling molecules HMGB1, MyD88 and NF-κB in cortex. A) No difference in cytokine mRNA was found between continuous ethanol and cycled ethanol exposure. CCL2, IL1-β, and TNFα from both the continuous and cycled ethanol treated groups showed significant increases (F(2,18)= 5.211, p=0.018; F(2,24)=9.718, p=0.0009; F(2,25)=6.475, p=0.006, respectively). No significant differences were observed between the continuous and cycled ethanol treated groups (p>0.05). B) TLR4 mRNA was elevated in both the continuous and cycled ethanol groups (F(2,23)=8.744, p=0.0017), but no differences were observed between the continuous and cycled ethanol exposure groups (p>0.05). C) Both continuous and cycled ethanol exposure caused an elevation in HMBG1 mRNA
33
Continuous Ethanol mRNA Levels of
HMGB1, MyD88 and NF-κB
Contr ol Chronic EtO H Cont rol
Chronic EtOH
Contr ol
Chronic EtOH
0 100 200 300
MyD88 NF-κB
HMGB1
*
% o f C ont ro lChronic LPS mRNA Levels of
HMGB1, MyD88 and NF-κB
Cont rol Chr
oni c LP
S Cont rol Chr onic LPS Cont rol Chron
ic LP S
0 100 200 300
MyD88 NF-κB
HMGB1 % of C ont ro l A B
Figure 3.5: Effects of continuous ethanol versus chronic LPS administration on mRNA for HMGB1, MyD88 and NF-κB. A) HMGB1, but not MyD88 or NF-κB, mRNA was elevated following continuous ethanol exposure over nontreated controls (HMGB1; t(16)=3.618,
34
Time Course Following Continuous
Ethanol HMGB1 and TLR4 mRNA
C
on
tr
ol
0
hr
24
hr
72
hr
7
da
ys
0
100
200
300
HMGB1
TLR4
%
of
C
ont
ro
l
CHAPTER IV:
ACUTE STRESS FACILITATION OF BRAIN CYTOKINES AFTER CONTINOUS ETHANOL EXPOSURE IS PREVENTED BY HMGB1 ANTAGONISTS Introduction
Stress has been shown to play a role in craving and risk of relapse (Breese et al., 2005b; 2010; Sinha et al., 2000; Miller et al., 2009; Sinha et al., 2011). In abstinent alcoholics, stress increases activation in brain as measured by fMRI—a change not seen in social drinkers (Gilman and Homer, 2008, reviewed in Breese et al., 2011). In accord with fMRI studies, stress was a more salient initiator of craving than a drug cue (Breese et al., 2011). In rats, Breese et al. (2005c) found that the anxiety-like response to restraint stress was elevated after chronic ethanol exposure. Additionally, Breese et al. (2005a) found that restraint stress could substitute for the first two withdrawal episodes in a chronic intermittent ethanol protocol to facilitate withdrawal-induced anxiety-like behavior (Breese et al., 2005a). Later studies in the lab showed that LPS or specific cytokines could substitute for stress or the first two withdrawal episodes in a chronic intermittent ethanol protocol (Breese et al., 2008).
36
increased mRNAs for cytokines CCL2, IL1-β, and TNFα in brain 24 hr following withdrawal from 15 days of continuous ethanol exposure.
Stress is a powerful activator of the neuroimmune system (Blandino et al., 2009; Deak et al., 2005; Girotti et al., 2011; Hueston et al., 2011; Minami et al., 1991; Nguyen et al., 1998, 2000; Shizuya et al., 1997; Suzuki et al., 1997; Knapp et al., 2011). Several studies have demonstrated that proinflammatory cytokines IL-1β and IL-6 are elevated in brain following various acute stress paradigms (Blandino et al., 2009; Deak et al., 2005; Minami et al., 1991; Nguyen et al., 1998; Shizuya et al., 1997; Suzuki et al., 1997), but see Hueston et al. (2011) for comparison of various acute stress paradigms. Knapp et al. (2011) showed that protein levels of TNFα were significantly elevated in whole brain 4.5 hr following a 60-min restraint stress. TNFα levels were also significantly elevated in whole brains collected from adolescent rats 5 hr following 45 or 90 min of restraint stress (Knapp, unpublished data). Activation of the neuroimmune system activates NF-κB transcription, which increases the expression of genes including proinflammatory cytokines and DAMP receptors such as TLR4 (Garg et al., 2010; Okun et al., 2009). Although the mechanism for activation of the neuroimmune system by acute stress remains unclear, several reports suggest that activation of microglia (Miller et al., 2009; Wang and Dow, 2003; Wang et al., 2002) is responsible for the increase in proinflammatory cytokines. These data suggest that the increase in cytokines observed following acute stress may be an important sterile (non-infection-based)
neuroimmune challenge (Andersson and Tracey, 2011).
To test changes in sensitivity of the neuroimmune response to stress following
37
cytokines would be enhanced following continuous ethanol exposure was determined. Finally, whether the activity of HMGB1 reported in Chapter III following continuous ethanol exposure contributes to stress activation of cytokines was tested pharmacologically by
blocking HMBG1 just prior to a stress challenge. One antagonist, glycyrrhizin, is a direct inhibitor of HMGB1 and binds HMGB1 in the extracellular space (Girard, 2007; Mollica et al., 2007). This antagonist has been shown to be effective in vivo at blocking HMGB1 function in rats (Ohnishi et al., 2011). The second HMGB1 antagonist, ethyl pyruvate, has been shown to block the release of HMGB1 without any decrease in expression of mRNA or protein (Ulloa et al., 2002). Given the upregulation of HMGB1 following continuous ethanol (Chapter III), it was hypothesized that HMGB1 may play a critical role in increased
sensitivity of the neuroimmune system following continuous ethanol exposure.
Materials and Methods Animals
For standard animal housing and diet procedures, refer to General Methods (Chapter II).
Experimental Protocols
38
duration; and (4) a group that received both ED for the entire duration plus a 1-hr restraint stress 24 hr into withdrawal.
To test for the duration of changes in cytokines, TLR4, and HMGB1 following 1 hr of restraint stress, rats were subjected to a 1-h. restraint stress and sacrificed at 2, 4, 8, 24, and 48 hr, and brains harvested as described in Chapter II. Control rats (i.e., non-stressed) were included at all time points to control for differences in time of day and disturbance in animal care facility.
To assess the role of HMGB1 in the increased sensitivity of the neuroimmune system following continuous ethanol exposure, two known blocking agents of HMGB1 were applied 15 min prior to application of stress. This experiment contained six groups: (1) CD/stress group with saline prior to stress; (2) CD/stress group with ethyl pyruvate prior to stress; (3) CD/stress group with glycyrrhizin prior to stress; (4) ED/stress group with saline prior to stress; (5) ED/stress group with ethyl pyruvate prior to stress; and (6) ED/stress group with glycyrrhizin prior to stress.
Statistical Analysis
All data were evaluated for statistical significance with student’s t-test or one- or two-way ANOVAs as appropriate using Graph Pad Prism 4.0 (Graph Pad Software, Inc., San Diego, CA) and expressed as mean ± SEM. P-values < 0.05 were considered statistically significant.
Results
Time Course of Changes in Cytokines, TLR4 and HMGB1 Following Restraint Stress
39
restraint stress significantly increased CCL2, IL1-β and TNFα mRNA (Fig. 4.1). CCL2 mRNA expression peaked between 2 and 4 hr (120.7% and 111.2% increase over controls, respectively, all p<0.05) and returned to control levels by 8 hr following the stress (Fig. 4.1A). IL1-β mRNA was also elevated by the 1-hr restraint stress (Fig. 4.1B). IL1-β mRNA expression peaked at 2 hr (92.1% over controls, p<0.01) after restraint stress. Although not statistically significant, at 4 hr, IL1-β mRNA levels remained high (78.2% of control,
p>0.05) and had returned to control levels by 8 hr following the stress. A 1-hr restraint stress
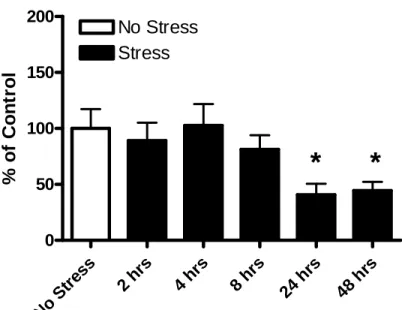
increased TNFα mRNA expression that peaked at 2 hr (98.5% over controls, p<0.01) (Fig. 4.1C). TLR4 mRNA expression was also significantly elevated following a 1-hr restraint stress and peaked at 4 hr (68.2% over controls, p<0.05) (Fig. 4.1D). HMGB1 mRNA expression was significantly decreased 24 to 48 hrs. following a 1-hr restraint stress, (40.8% and 44.4% below control levels, respectively, p<0.05) (Fig. 4.2).
Effect of Stress Challenge Following Continuous Ethanol Exposure on Cytokines, TLR4 and
HMGB1
40
283% (p<0.01) increase in CCL2 mRNA (Fig. 4.3A). Restraint stress in CD-treated rats caused an 88% (p<0.05) increase in IL1-β mRNA. Continuous ethanol exposure alone caused a 97% (p<0.05) increase in IL1-β mRNA. Stress following continuous ethanol exposure had an additive effect and elevated IL1-β expression 186% (p<0.01) (Fig. 4.3B). Stress in CD-treated rats caused a 98% (p<0.05) increase in TNFα mRNA expression over controls. Ethanol exposure with 24 hr of withdrawal caused a 125% (p<0.05) increase in message. A stress challenge following continuous ethanol exposure caused a 126% increase in TNFα mRNA (Fig. 4.3C). Finally, stress in CD-treated rats caused a 78% (p<0.05) increase in mRNA for TLR4s. Ethanol exposure with 24 hr of withdrawal alone caused a 76% (p<0.05) increase in message. Stress after ethanol exposure caused an 88% (p<0.05) increase in TLR4 mRNA (Fig. 4.3D).
To follow up on the observation of elevated HMGB1 mRNA following continuous ethanol exposure (Chapter III), changes in HMGB1 message following a stress challenge were determined in continuous-ethanol-exposed rats. A stress challenge in CD-treated rats did not increase HMGB1 mRNA (p>0.05). However, ethanol alone with 24 hr of withdrawal caused a 108 % (p<0.01) increase in HMGB1 message. A stress challenge after continuous ethanol exposure did not have an additive effect and resulted in a 98% (p<0.05) increase in HMGB1 mRNA over controls (Fig. 4.4).
Blockade of HMGB1 Action with Ethyl Pyruvate and Glycyrrhizin
41
ethanol exposure, HMBG1 was blocked with ethyl pyruvate or glycyrrhizin i.p. 15 minutes prior to a stress challenge after continuous ethanol exposure. Treatment with ethyl pyruvate or glycyrrhizin prior to stress application did not affect CCL2 levels (p>0.05) in CD-treated rats. However, in continuous- ethanol-treated rats, ethyl pyruvate and glycyrrhizin
42 Discussion
Clinical investigations have demonstrated that stress in abstinent alcoholics can induce craving—a circumstance that can increase the probability of relapse (see Breese et al., 2011; Sinha, 2001). In accord with this observation, basic research has demonstrated that stress-induced anxiety is facilitated following chronic ethanol exposure. Corticotropin releasing factor (CRF) is widely known to play a critical role in stress, but the greater neurochemical milieu in which CRF acts is poorly understood. Stress has been shown to increase cytokines in brain (Blandino et al., 2009; Deak et al., 2005), and cytokines can substitute for stress to facilitate ethanol withdrawal anxiety (Breese et al., 2008). The present effort tested the hypothesis that the increase in cytokines by stress after continuous ethanol exposure would be facilitated by the release of the endogenous TLR4 agonist HMGB1.
To establish the best time for sacrificing animals after stress, the time course of change in cytokines following a 1-hr restraint stress was defined. The stress caused
43
remained at this level through the last post-stress time point assessed at 48 hr. The level of HMGB1 was reduced below control levels 7 days after removal from chronic ethanol, a pattern of results similar to that observed with stress (Chapter III). This finding suggests that some adaptation in this ligand occurs after a challenge to the immune system. Such a
detailed assessment of the effects of acute stress on the time course of changes in TLR4 and HMGB1 mRNAs has not previously been reported. The mechanism of the protracted change in HMGB1 warrants further investigation.
To explore whether stress would enhance the effects of chronic ethanol on cytokine levels (Chapter III), restraint stress was applied for 60 min 24 hr after the continuous ethanol protocol. Two recent reports (Barnum et al., 2008; Girotti et al., 2011) provide evidence that the neuroimmune system can have a differential response depending on prior experience—in this case, chronic ethanol prior to the stress. Additionally, Qin et al. (2007) have shown elevated levels of TNFα protein 10 months after a single systemic administration of LPS. In the current investigation, mRNAs for CCL2 and IL1-β were both elevated by stress above the level observed 24 hr after the continuous ethanol exposure. This finding is consistent with a behavioral impact of stress-induced cytokines after chronic ethanol exposure (Breese et al., 2004). Surprisingly, stress did not increase TNFα mRNA beyond the increase seen with chronic ethanol exposure alone. This difference from the other cytokines suggests that TNFα
may be controlled by a different mechanism.
44
observe associated additive changes in HMGB1 is related to the lack of a stress-associated increase in HMGB1 in controls.
45
Surprisingly, neither glycyrrhizin nor ethyl pyruvate altered the stress-induced increase in cytokines in controls although these HMGB1 antagonists reduced mRNA for CCL2 and IL1-β to the level observed with chronic ethanol alone—a change equivalent to that of stress alone (Fig. 4.5A and B). These results suggest that HMGB1antagonism following continuous ethanol exposure blocks the stress-induced release of cytokines as the levels were reduced to the same levels as with continuous ethanol alone. In the absence of prior continuous ethanol exposure stress does not seem to operate by the same mechanism. Specifically, HMGB1 antagonism prior to a stress challenge in CD treated animals had no effect on cytokine production. Taken together, these results suggest that acute stress may operate under two distinct mechanisms in the two different conditions. Without prior continuous ethanol exposure, acute stress uses one of these mechanisms to evoke cytokines in brain. Given the available explanation in the literature, CRF activation of microglia and release of cytokines (Wang et al., 2003) may explain the observed results with regard to acute stress. However, with prior continuous ethanol exposure, the data suggest that stress contributes to the release of already elevated HMGB1 levels to further enhance cytokine production. It is likely that CRF is still playing a role but only in so far as setting the release of HMGB1 in motion. The observation that the HMGB1 antagonists prevented the action of stress after chronic ethanol exposure is consistent with this view. Furthermore, CRF
46
Taken together, these data provide evidence that HMGB1 contributes to the increased sensitivity of the neuroimmune system to stress following continuous ethanol exposure but not to stress-induced increases in cytokines in controls. Such HMGB1-mediated activation of the neuroimmune system following continuous ethanol exposure is consistent with the proposal that non-infection-based central disorders may be mediated in part by HMGB1 (Anderson and Tracey, 2011). In this regard, HMGB1 has been shown to be elevated in many disorders including sepsis (Wang et al., 1999), arthritis and cancer (Lotze and Tracey 2005), multiple sclerosis (Andersson et al., 2008), epilepsy (Moroso et al., 2010) and
47 Figures
TNFα mRNA
No S
tres
s
2 hrs 4 hrs 8 hrs 24 hr
s
48 h
rs 0 100 200 300 400 No Stress Stress
**
% o f C o n tr o lIL1-β mRNA
No
Stres
s 2 hr
s
4 hr
s
8 hr
s
24 hr
s
48 hr
s 0 100 200 300 400 No Stress Stress
**
% o f C o n tr o l CCL2 mRNANo Stress
2 h rs
4 h rs
8 hrs 24 hrs 48 h
rs 0 100 200 300 400 No Stress Stress
*
*
% of C o nt ro l TLR4 mRNA NoStress 2
hrs
4 h rs
8 hr
s
24 h
rs
48 hrs
0 100 200 300 400 Stress No Stress
*
% of C o nt ro l B D A CFigure 4.1: Time course of changes in mRNAs for CCL2, IL1-β, and TNFα and for TLR4s following 1-hr restraint stress. Stress increased mRNAs for cytokines CCL2, IL1-β, and TNFα and for TLR4s. A) CCL2 mRNA was elevated by stress (F(5,32)=3.82, p=0.008) and peaked at 2 to 4 hr after the stress. B) IL1-β mRNA was elevated by stress (F(5,33)=5.04, p=0.015) and peaked 2 hr after the stress. C) TNFα mRNA was elevated by stress
48
HMGB1 mRNA
No St
ress 2 hrs 4 hr s
8 h rs
24 hr s
48 hr s
0 50 100 150 200
No Stress Stress
*
*
%
of
C
ont
ro
l
49
IL1-β mRNA
No
Stress Str ess
No S
tress Stres s 0 100 200 300 400 ** * * CD ED % o f C o n tr o l CCL2 mRNA No Stre ss Stres s No Stre ss Stre ss 0 100 200 300 400 ** * * CD ED % of Cont ro l
TNFα mRNA
No S
tress Stress No S
tress Stress
0 100 200 300 400 * CD ED * % or C ont ro l TLR4 mRNA
No S
tress Stress No S
tress Stress
0 100 200 300 400 * CD ED % o f C o n tr o l A B C D
Figure 4.3: Effects of continuous ethanol and stress on mRNA for cytokines CCL2, IL1-β, TNFα and for TLR4s. Both stress and continuous ethanol increased CCL2, IL1-β, TNFα, and for TLR4 mRNA. A) Both stress (F(1,28)=16.0, p=0.0004) and ethanol (F(1,28)=15.3, p=0.0005) increased CCL2. No interaction of stress and ethanol was observed (p>0.05). B) Both stress (F(1,31)=10.9, p=0.0024) and ethanol exposure (F(1,31)=13.4, p=0.0009)
50
HMGB1 mRNA
No S
tress Stress
No St ress
Stress
0 100 200
300
*
CD ED
*
%
of
C
ont
ro
l