Cover Page
The handle
http://hdl.handle.net/1887/30138
holds various files of this Leiden University
dissertation
Author
: Driessen, Marja
Title
: Evaluation of the zebrafish embryo as an alternative model for hepatotoxicity
testing
as an alternative model for
hepatotoxicity testing
ISBN
978-94-6259-475-3
Design and lay-out Promotie In Zicht, Arnhem
Ipskamp Drukkers, Enschede
Illustrations chapter pages: Simona M Ceccarelli Pharmaceuticals Division, F.
Hoffmann-La Roche Ltd. , CH- 4070 Basel, Switzerland. [email protected] Cover illustration based on a photograph of Marianne Roodbergen
This research was financially supported by the Netherlands Genomics Initiative/ Netherlands Organization for Scientific Research (NWO) (grant number 050-060-510)
Financial support for the printing costs of this thesis by the National Institute for Public Health and the Environment (RIVM) is gratefully acknowledged.
Proefschrift
ter verkrijging van
de graad van Doctor aan de Universiteit Leiden, op gezag van de Rector Magnificus prof. mr. C.J.J.M. Stolker,
volgens besluit van het College voor Promoties te verdedigen op woensdag 17 december 2014
klokke 10.00 uur
door
Marja Driessen geboren te Breda,
23 januari 1985
the zebrafish embryo
as an alternative model for
Co-promotores: Dr. L.T.M. van der Ven RIVM Dr. A.S. Kienhuis RIVM
Overige leden: Prof. dr. P.H. van der Graaf Universiteit Leiden Prof. dr. J. Kuiper Universiteit Leiden/LACDR Prof. dr. Ir. J. Legler Vrije Universiteit Amsterdam/IVM Prof. dr. A. H. Piersma Universiteit Utrecht/RIVM Prof. dr. H.P. Spaink Universiteit Leiden/IBL
Chapter 1 General Introduction 9 Chapter 2 Exploring the Zebrafish Embryo as an alternative Model
for the Evaluation of Liver Toxicity by Histopathology and Expression Profiling
27
Chapter 3 Gene Expression Markers in the Zebrafish Embryo Reflect a Hepatotoxic Response in Animal Models and Humans
55
Chapter 4 Gene and Protein Expression Markers of Hepatotoxicity in Zebrafish Embryo Model
75
Chapter 5 A Transcriptomics-based Hepatotoxicity Comparison between the Zebrafish Embryo and established Human and Rodent in vitro and in vivo Model Using Cyclosporine A, Amiodarone and Acetaminophen
103
Chapter 6 General Discussion 121
Chapter 7 English Summary 133
Nederlandse Samenvatting 141
References 145
Curriculum Vitae 153
List of Publications 155
Supplementary Tables Chapter 2 157
Supplementary Tables Chapter 3 210
General Introduction
In part published as:
Hepatotoxicity screening on in vitro models and the role of Omics
Marja Driessen and Leo T.M van der Ven
in: Toxicogenomics-Based Cellular Models: Alternatives to Animal Testing for Safety Assessment 15 Mar 2014 ISBN-10: 0123978629
1
10
C
hap
te
r 1
Humans are exposed throughout their entire life to multitude of diverse xenobiotic compounds, such as industrial chemicals and pharmaceuticals. This exposure is either intended, e.g. when prescribed as drug, or unintended, e.g. as contaminants in food or the environment. Xenobiotic exposure may pose health risks; when a hazardous concentration is reached adverse biological effects may occur. Toxicological research aims to identify these adverse health effects (hazard) and compare hazard threshold levels with real-life exposure levels to estimate the risk associated with actual exposure. The liver is one of the major targets of toxicological effects, because it is the first organ to be encountered after absorption from the gastro-intestinal tract, and it is therefore important to assess hepatotoxic properties of xenobiotics that humans are exposed to1. Traditionally hepatotoxicity is studied mainly in animal studies, but observations in animal exposure studies appeared to be not fully predictive for the effects in humans2. The predictivity of animal studies is limited mainly by physiological differences between species, leading to differences in toxicokinetic fate, i.e. absorption, distribution, metabolism, and excretion of the xenobiotic, and differences in sensitivity of target cells2. These differences are the cause of uncertainties associated with extrapolation from animal to man and from short-term to long-term exposure. Thus, effects that occur in humans may remain undetected in animals. Therefore, there is an imperative need to improve toxicological testing, and develop strategies that do not rely on traditional testing in rodents. Development of new screening methods should build on new in silico and in vitro methods, which can also help to implement the 3R strategy to Replace, Reduce and Refine the use of animals. An approach is to analyze the molecular mechanisms that underlay toxicological effects facilitating comparison across models and species, through the use of ‘omics-technologies’. A promising alternative testing model is the zebrafish embryo, which we evaluate here for its application in hepatotoxicity testing through the use of several toxicogenomics tools.
The liver as critical target organ for toxicity
The liver is an important target for adverse effects of xenobiotics, as it is the first organ to pass after enteric absorption, positioned between the gastro-intestinal tract and systemic circulation. The liver has metabolic activity, which allows deactivation or detoxication of xenobiotics, thereby facilitating their excretion. This process is called biotransformation, which is a multistep process including Phase I and Phase II metabolism. Phase I metabolism can be divided into by three steps including modification, oxidation and reduction preparing the xenobiotics for Phase II metabolism. In Phase II metabolism, the xenobiotics are conjugated resulting in clearance3. Due to the position of the liver and its metabolic function, it serves as a ‘first pass’ organ resulting in relatively high concentrations of xenobiotics that depend on oral uptake. This may lead to toxic activity of the xenobiotic and thereby to the induction of liver injury1,4–6.
12
C
hap
te
r 1
Furthermore, all of these compounds are frequently used in in vivo and in vitro studies to induce cholestasis1,12,15–17.
Several studies have shown that these model compounds are able to induce cholestasis in a wide variety of models including in vivo mouse and rats, and also in vitro mouse liver slices, primary hepatocytes and many more.
Steatosis. Fat metabolism is another important function of the liver, specifically through fatty acid synthesis and promoting lipid circulation by lipoprotein synthesis1,3. Changes in fat metabolism may result from an increase in uptake of lipids, elevation of the de novo synthesis of fatty acids, an impairment of lipoprotein synthesis/secretion, and/or a reduction in fatty acid oxidation19. The accumulation of cytoplasmic fatty acids in the form of lipid droplets is known as steatosis11,19. Disrupted fat metabolism is manifested as Furthermore, they express a wide scale of circulating plasma proteins including albumin1,3,7.
Less than 40% of the liver is comprised of sinusoid endothelial cells, Kuppfer cells, and stellate cells1,3,7. Sinusoidal endothelial cells are the largest group of non-parenchymal cells compromising around 19% of the total liver cell mass. These cells are a physical barrier for blood circulation allowing the interchange of nutrients, toxicants, hormones and other molecules from the plasma to the hepatotocytes. In addition, these cells play an important role in the inflammatory reactions7,8. Kuppfer cells compromise 15% of the total liver mass and in healthy situations these cells are present as resting macrophages. However, upon activation, for example due to liver damage, these cells will excrete pro-inflammatory cytokines potentially aggravating the damage in the hepatocytes and promoting the pro-apoptotic responses7,9,10. Stellate cells are the smallest non-parenchymal cells in the liver, only compromising 6% of the total liver mass. Their function in the liver is to store vitamin A, however, under toxic stress these cells have various other functions including the secretion of chemokines and activation of natural killer cells7. This shows that hepatotoxicity may occur through interaction of a xenobiotic with various cell types within the liver. Depending on the toxic functions and pathways that are activated, xenobiotic interaction may lead to a variety of liver pathologies including cholestasis (intra- or extracellular bile accumulation), steatosis (fatty liver), and necrosis (cell death)1,4,6,11. These specific toxic phenotypes are explained below in more detail, together with actions of some reference toxicants.
Cholestasis. Cholestasis is one of the main xenobiotic-induced liver pathologies resulting from either impairment in bile secretion or obstruction in bile flow12–14. Bile and bile acids are not only important for the digestion of fat from the diet, but also for the clearance of xenobiotics from the liver1. Cholestasis occurs when there is either an impaired bile transport or an inhibition of bile transporters12. Several drugs are known to induce cholestasis via different molecular mechanisms.
First, 17α-ethinylestradiol (EE2), a synthetic estrogen derivative, is used in combined oral contraceptive pills, which reduces bile flow by inhibiting bile acid active transporters at the hepatic canalicular membrane. EE2 also increases the permeability of cells in the bile ductules elevating the reabsorption of bile components1,15.
Second, cyclosporine A (CsA) is widely used as an immunosuppressant in organ transplantation to avoid rejection. In humans, it induces cholestasis by interacting with and inhibiting the bile transporter, also known as the bile salt export pump (BSEP)12.
Third, chlorpromazine (CPZ) is used to treat acute and chronic psychoses16. CPZ induces cholestasis by directly acting at the intracellular membrane thereby decreasing bile acid-dependent bile flow resulting in a loss of bile acids via defective bile canaliculi. In addition, the Na+/K+ pump and hydroxylation of cholesterol to bile acids are inhibited by CPZ16.
Figure 1 Toxicity pathway of cholestasis.
Cyclosporine A (CsA) and 17α-ethinylestradiol (EE2) block the transporters regulating bile flow from hepatocyte to bile duct (bile salt pump (BSEP) and multidrug resistance protein 1 (MDR1)), resulting in accumulation of bile in the hepatocyte. Chlorpromazine (CPZ) and EE2 act on the uptake transporters Na+-dependent taurocholic cotransporting polypeptide (NTCP) and organic anion-
transporting polypeptide (OATP), but also inhibit the excretion transporters BSEP and MDR1. This inhibition of bile acid excretion leads to accumulation of intracellular bile acids. Cholesterol is known to be converted to bile acids by cytochrome P450 CYP7A1 into bile acids, which in turn activate pregnane X receptor (PXR) leading to an increase in expression of MDR1 and OATP (Adapted from Jansen et al., and Zimmerman1,18)
Cholesterol
Bile+acids
PXR
Hepatocyte Portal,blood
CYP3A4 CYP2C8
BSEP
MDR1
CYP7A1 CsA,EE2
NTCP
OATP
Bile
14
C
hap
te
r 1
regulating the peroxisome proliferator activated receptors (PPARs), which are involved in the development of steatosis through their important role in lipid deposition21,22. Valproic acid (VPA) is an antiepileptic agent, used to treat specific types of seizures. VPA hepatotoxicity is believed to be mediated by either an inhibitory effect on the mitochondrial β-oxidation pathway, which gives rise to microvesicular steatosis, or by metabolic effects which promote weight gain and insulin resistance giving rise to macrovesicular steatosis and steatohepatitis23.
Studies have shown that VPA and TET induce steatosis in mice through an increase in cholesterol and triglyceride biosynthesis and a decrease in fatty acid oxidation22,24,25. Furthermore, AMD has been found to promote steatosis in mice through altering lipid homeostasis in the liver20.
Necrosis. Necrosis, or cell death, is caused by severe metabolic perturbations resulting in ATP depletion. Diminished levels of ATP breakdown and cytoskeleton integrity, which results in the characteristic morphology of cell swelling accompanied by membrane blebbing11. Furthermore, mitochondrial permeability transition (MPT) plays an important role in necrosis. MPT is known to lead to either necrosis or apoptosis after mitochondrial oxidative stress7,27. Known drugs or compounds that induce necrosis are acetaminophen (APAP), paraquat (PQ) and thioacetamide (TAA).
Acetaminophen (paracetamol; APAP) is an analgesic and antipyretic, which is considered safe at therapeutic doses. In this setting, APAP is inactivated by sulfation and glucuronida-tion. However, when therapeutic doses are exceeded, APAP causes hepatic damage and may eventually lead to liver failure. APAP toxicity is due to its active metabolic conversion by CYP2E1 to the highly toxic metabolite N-acetyl-p-benzoquinone imine (NAPQI). In normal situations, NAPQI is conjugated to reduced glutathione and is excreted the bile. However, when therapeutic doses are exceeded, NAPQI concentrations increase due to saturation of the sulfation and glucuronidation pathways. Hepatotoxicity occurs when NAPQI binds to macromolecules, for example in the mitochondria, which leads to mitochondrial dysfunction and DNA damage11,28,29.
Paraquat (PQ), a contact herbicide, is a dehydrate and defoliant used for harvesting cotton, potatoes, and soy beans. PQ is a bipyridyl derivative, which can be taken up by the redox cycle leading to the release of active oxygen radicals, which in turn can induce damage to the hepatocyte30.
Thioacetamide (TAA) was formerly used as a fungicide. The underlying mechanism of hepatotoxicity of this compound appears to be its metabolism via CYP2E1. TAA is metabolized to di-S-oxide (CH3-C(SO2)NH2), which is a reactive intermediate that covalently binds to hepatic macromolecules resulting in necrosis31
either microvesicular (multiple small vacuoles in the hepatocytes) or macrovesicular steatosis (larger vacuoles that dislocate the nucleus from the center of the cell). Several drugs and chemicals are known to induce steatosis in humans including amiodarone (AM), tetracycline (TET), and valproic acid (VPA).
Amiodarone (2-butyl-3-benzofuranyl 4-[2-(diethylamino)etoxcy]-3,5-diiodophenyl ketone; AM) is a frequently prescribed antiarrythmic agent, to prevent atrial fibrillation. AM induces steatosis in humans, and also in rodent models, probably through inhibiting mitochondrial β-oxidation of long-, medium-, and short-chain fatty acids. Furthermore, this compound inhibits carnitine palmitoyltransferase-I (CPTI)-dependent transport of long-chain fatty acids across the mitochondrial membrane 20 resulting in fatty acid accumulation in hepatocytes. Tetracycline is a frequently used antibiotic, to fight infections with both gram-positive and gram-negative bacteria. Tetracycline induces microvesicular steatosis in the liver by down-
Figure 2 Toxicity pathway of steatosis.
Sources of fatty acids (FA) are triacylglycerol (TAG) and chylomicrons (CM). TAG is exported out of the hepatocytes in the form of very low density lipoproteins (VLDL). Tetracycline (TET) induces steatosis by downregulation of nuclear receptors including liver X receptor (LXR) and peroxisome proliferator receptors (PPARs) and their target genes sterol regulatory element-binding protein 1c (SREBP-1c) and carbohydrate response element-binding protein (chREBP); this in turn leads to an increase in fatty acids (FA) level. Valproic acid (VPA) and amiodarone (AM) inhibit the β-oxidation cycle resulting in decreased metabolism of fatty acids, which then accumulate in the hepatocyte (Adapted from Matsuzaka and Shimano (2011)26)
ChREBP
LXR,+PPAR
SREBP+–+1c FA
β@oxidaBon
Lysosomal+ breakdown
AM,VPA TET
FaEy,acid,accumula@on+
TAG+
VLDL+ CM+
16
C
hap
te
r 1
of xenobiotics. Currently, multiple alternatives are available for hepatotoxicity testing, including single liver cell systems, liver slices and whole organisms7,11.
The in vitro cell system of primary hepatocytes is one of the most prominent models for studying hepatotoxicity and allows for easy interspecies comparison7,11,37. Generally, these cells maintain expression of Phase I and Phase II metabolic enzyme activities for longer periods of time, however, they are not fully representative of the in vivo liver due to a loss of original cell shape and a deviating gene expression response to xenobiotics7,11,37. Alternatively, several permanent, immortalized cell models are available for toxicity screening. Of these, the frequently used human hepatocarcinoma derived HepG2 cell line has a long history in xenobiotics testing. The advantage of this cell line is that it provides an infinite reservoir of identical cells7,11,37. HepG2 cells show activity of several Phase I and
Phase II metabolic enzymes, however, not all metabolizing enzymes are present and otherwise the expression level is generally much lower than in the in vivo situation or primary human hepatocyes, leading to a different response after compound exposure7,11,37. However, recent advances allowed to improve the expression of Phase I enzymes in the HepG2 cells constructing Adv-HepG2 cell line38.
Hepatotoxicity testing
Traditionally, rodent studies are used to predict the hepatotoxic effects of xenobiotics. As introduced above, an important scientific argument against the use of rodent studies is that the obtained effects are not always fully predictive for the effects in humans2. In general, animal studies are helpful to identify human toxicants, but particularly in the case of hepatotoxicity, the identification remains low due to a poor correlation between human and animals2,7,11. Missed hepatotoxic effects in traditional screening assays is a major cause of the high attrition rate in drug development and therewith associated with high cost1,4,6. From the perspective of animal welfare it is unfavorable that animals need to be exposed to high doses of compounds for extended periods of time. Therefore, there is an imperative need to develop alternative models to assay the hepatotoxic potential
Figure 3 Toxicity pathway of hepatic necrosis.
Necrosis is the consequence of induction of reactive oxygen species (ROS) and reactive nitrogen species (RNS), which eventually leads to a decrease of glutathione (GSH). GSH depletion eventually leads excess of ROS/RNS, oxidative damage and hence to cell death. Acetaminophen (APAP) induces ROS/RNS through its toxic metabolite N-acetyl-p-benzoquinone imine (NAPQI) to which it is converted by cytochrome P450 (CYP) enzymes. Thioacetamide (TAA) is also metabolised by CYP enzymes to a reactive metabolite which increases the ROS production. Mechanism of paraquat (PQ) is not completely understood, but it probably also induces an increase in ROS production. One important damaging action of ROS/RNS is the decrease of mitochondrial permeability transition (MPT) leading to loss of ATP, which contributes to cell death. Kupffer cells secrete cytokines which may aggravate ROS/RNS production leading to cell death (Adapted from Hinson et al. (2010) and Jaeschke et al. (2012) 32,33)
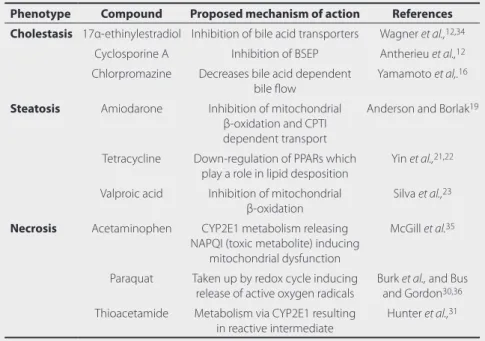
Table 1 Reference compounds and phenotypes.
Phenotype Compound Proposed mechanism of action References
Cholestasis 17α-ethinylestradiol Inhibition of bile acid transporters Wagner et al.,12,34
Cyclosporine A Inhibition of BSEP Antherieu et al.,12
Chlorpromazine Decreases bile acid dependent bile flow
Yamamoto et al,.16
Steatosis Amiodarone Inhibition of mitochondrial β-oxidation and CPTI dependent transport
Anderson and Borlak19
Tetracycline Down-regulation of PPARs which play a role in lipid desposition
Yin et al.,21,22
Valproic acid Inhibition of mitochondrial β-oxidation
Silva et al.,23
Necrosis Acetaminophen CYP2E1 metabolism releasing NAPQI (toxic metabolite) inducing
mitochondrial dysfunction
McGill et al.35
Paraquat Taken up by redox cycle inducing release of active oxygen radicals
Burk et al., and Bus and Gordon30,36
Thioacetamide Metabolism via CYP2E1 resulting in reactive intermediate
Hunter et al.,31
An overview of the phenotypes of interest in this thesis and the associated reference compounds
APAP CYP NAPQI
TAA+metabolites
MTP
Cell death
PQ TAA
GSH
GSH+
Covalent+binding
ROS + RNS
Inflammatory cytokines
Anti Inflammatory
cytokines
ROS + RNS
GSH
GSH ATP
Nuclear DNA Fragmentation
Bax Endonuclease G
Hepatocyte
18
C
hap
te
r 1
The zebrafish embryo and hepatotoxicity testing. While most of the important cytochromes are present in the zebrafish embryo, this model might be suitable to detect hepatotoxicity. Some studies showed that zebrafish embryos are suitable to detect hepa-totoxicants. In a study by Jones et al., the whole zebrafish embryo model was evaluated through morphological endpoints after exposure to a set of compounds, including falsely classified DILI drugs by HepG2 cells. In this study, the whole zebrafish embryo model successfully detected hepatotoxicants with higher specificity than the HepG2 cells49. In another study, Amali et al., carried out histopathological, molecular and biochemical analysis in zebrafish embryos exposed to a single dose of thioacetamide and showed that the whole zebrafish embryo model is suitable to detect steatohepatitis57. These studies indicate the potential of the zebrafish embryo as a model for hepatotoxicity testing at the level of the phenotype, but they provide limited insights into the underlying mechanisms of toxicity58. Toxicogenomics is hypothesized to contribute understanding of the underlying mechanisms of hepatotoxicity and discrimination between various hepatotoxic phenotypes, such as cholestasis, steatosis and necrosis.
Toxicogenomics
For drug development, understanding the mechanism of toxicity is imperative, not only to compare between reference toxicants and test compounds, but also to differentiate between toxic and targeted effects, and to develop relevant markers of toxicity. The method to analyze and describe mechanisms of toxicity comprises a set of tools, which generally involves toxicogenomics61.
Traditionally, hepatotoxic properties of chemicals and compounds are determined using rodent studies which rely on different toxicity endpoints including body and organ weight, death rate, serum toxicity biomarkers and histopathological changes11. Although these phenotypical endpoints give an indication of toxicity, they do, however, not provide insight into the underlying molecular mechanisms of hepatotoxicity. By applying molecular techniques, such as transcriptomics, proteomics and next generation sequencing, in the toxicology setting will provide an insight into the underlying molecular mechanisms61–63. The assumption is that changes in for example toxicity markers and histopathology are preceded by changes on gene and/or protein level after exposure to compounds. The changes in genes and/or proteins will provide us with a more detailed view on the onset of the toxic events.
Transcriptomics analysis can be implemented in different ways including the use of micro arrays and the more recent technique next generation sequencing. Next generation sequencing provides multiple advantages over the traditionally used mRNA microarrays. In contrast to microarrays, NGS does not rely on the probe design and probe selection, thus enabling detection of non-predefined transcripts, including diverse splicing variants of a single gene.
Another advantage of the implementation of molecular techniques in toxicology research is that it allows the researcher to extrapolate the findings to other organisms. In the area of Other hepatocyte cell lines are also used, and HepaRG is an example of a recently isolated
and cultured hepatoma cell line. Several studies have shown the presence of xenobiotic metabolizing enzymes, much similar to the primary hepatocytes, enabling them to be suitable in assessing the xenobiotic compounds hepatotoxicity potential39–41. Another recent advancement is use of 3D cell culture systems. HepG2 cells cultured in 3D stopped proliferating, self-organize and differentiate to form multiple polarized spheroids acquiring hepatotocyte functions including glycogen storage, transportation of bile salts and the formation of structures resembling bile canaliculi42.
The isolated perfused liver and liver slices are considered to be the system closest related to the in vivo condition, because these systems maintain 3D-architecture including bile flow and cell-cell interactions. Furthermore, these systems contain the non-parenchymal cells which have an important role in mediating the toxicity7,43. A downside of these systems is the relative short period of viability, limiting these models to test only compounds which are expected to have an effect within a few hours7,43.
Toxicological science is in need of a model that combines these advantages and overcomes the drawbacks of these systems. In this respect, the zebrafish embryo could be considered as a complementary alternative model to screen for potential hepatotoxic compounds and to investigate the mechanisms by which chemicals induce liver injury44–49.
The zebrafish embryo
20
C
hap
te
r 1
hepatotoxicity, several studies have shown that toxicogenomics can be applied to investigate the underlying molecular mechanisms leading to toxicity61,64. Mostly, these toxicogenomics techniques are applied in traditionally used models for hepatotoxicity including mice, rats and in vitro models64,65. With regards to the ZFE, several recent studies show that toxicogenomics can be applied to investigate the underlying mechanisms of toxicity. For example, the study of Yang et al., showed that the ZFE allows for the robust identification of genes to distinguish between toxicants53. More specifically, several transcriptomics studies identified the underlying mechanisms of teratogenicity66–70 of compounds showing the suitability of applying toxicogenomics in the ZFE. Few studies have been performed with toxicogenomics in ZFE with regard to hepatotoxicity46,49,57. Nevertheless, these transcriptomics studies show that the zebrafish embryo model is suitable for detecting differences between chemical classes illustrating the possibilities of this model. Several proteomics studies have been performed in other models, such as in vitro and in vivo systems, to gain further insight into the differences in proteomes after exposure to hepatotoxicants17,71,72. These studies show the potential of this technique to assess the molecular mechanisms of hepatotoxicity.
With regard to the ZFE, proteomics studies have been performed, but are mainly targeted at the differences between proteomes during different life-stages. Less is known about
Table 2 Testing models for hepatotoxicity.
Model Strength Weakness
Liver slices Fairly high throughput Retain liver structure; contain all cell types
Functional bile canaliculi Good in vitro/in vivo correlation of xenobiotic metabolism Maintain zone-specific CYP activity; maintain toxicity mechanisms
Stability of phase II enzymes, albumin production, gluconeogenesisis for 20-96 hours
Cellular necrosis after 48-72 hours CYP levels quickly decrease (6-72 hours) Poor concordance with liver for intrinsic clearance rates and Km values
Diffusion-limited gradient of the exposure to a compound across the slice
Immortalized hepatic cell lines
Throughput depends on application
Unlimited amount of cells available
Some cell lines retain expression of many liver-specific functions
Lacking most phenotypic and functional characteristics of the liver tissue
Primary hepatocyte suspensions
Fairly high throughput Better estimate of internal clearance than monolayer cultures
Retain high level of enzyme functionality (close to in vivo)
Loss of cell-cell interactions Loss of cell-matrix interactions
Limited viability allows short-term use only (<4 hours)
Loss of cellular polarity No bile canaliculi Primary
hepatocyte cultures
Throughput depends on the application
Cells can re-establish cell-cell interactions and polarity Cells retain some morphology and liver specific functionality in short-term cultures (2-4 days) Induction/inhibition of the metabolizing enzymes can be studied
Inability to maintain in vivo liver-specific functionality for long-term culture Quick reduction in functionality and phenotype (24-48 hours)
May not develop functional bile canaliculi
Primary hepatocyte cultures Sandwich
Throughput depends on the application
Restores in vivo polygonal morphology
Better maintains liver-specific functionality
Prevents loss of viability Functional bile canaliculi
Loss of liver-specific functionality, morphology and phenotype in long-term cultures
Decline in metabolic enzyme activity in long-term culture
Table 2 Continued.
Model Strength Weakness
HepaRG cell line
Functional activities remain stable for long time period Enzyme activity can be modulated allowing to more closely mimic inter-individual variations in xenobiotics metabolizing enzymes
Loss of cell-cell interactions Loss of cell-matrix interactions No bile canaliculi
Zebrafish embryo
Ex vivo development and optical clarity of the embryo
Embryogenesis is completed at 72 hpf, liver is fully functional Biological complexity of in vivo
models
Easy to handle and cheap Genome of the zebrafish is sequenced. Molecular biology tools are available for genetic manipulation
High-throughput screening
Developmental stage of the hepatocytes Extrapolation to human
First pass effect
Teleost fish possess two copies of many mammalian genes due to gene duplication events
22
C
hap
te
r 1
UniProt (Universal Protein database) provides a freely accessible resource of protein sequence and functional information78,79.
The implementation of toxicogenomics in the area of hepatotoxicity testing has advanced the understanding of the underlying molecular mechanisms of the different hepatotoxic classes65. In addition, this technique allows to extrapolate the findings to the human situation.
Aim and outline of this thesis
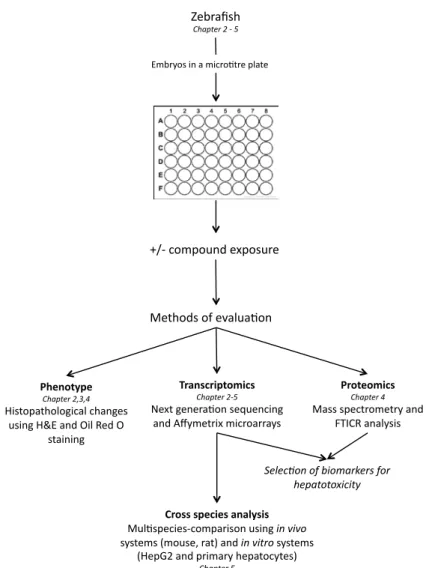
Aim of this thesis. The hepatotoxic potential of compounds and chemicals are traditionally assessed using in vivo rodent studies. Since these in vivo rodents studies are associated with scientific issues (limited predictivity for effects in humans), economical (high costs due to high doses and long experimental periods), and ethical (large numbers of animals to be exposed), there is a need to develop and validate alternative approaches. As such, the zebrafish embryo is presented as an alternative test model that may replace or support the traditional in vivo rodent studies. This zebrafish embryo model combines the benefits of an in vivo model, namely biological complexity including interactions between tissues and cells49,54,95, with the advantages of in vitro models, that is, the ability for medium to high throughput testing. Therefore, the objective of this thesis is to evaluate the whole zebrafish embryo as an alternative model system to screen for the hepatotoxic potential of compounds using different “-omics” technologies including next-generation sequencing, transcriptomics, and proteomics, thereby improving the prediction for effects in humans. To achieve this objective, a dedicated set of approaches was applied in the studies schematically represented in Fig. 4 and outlined below.
Outline of this thesis. First, we evaluated whether the whole zebrafish embryo can be used for the determination of hepatotoxicity. In Chapter 2, we determined whether hepatotoxicity-associated gene expression was detectable in whole zebrafish embryos using next-generation sequencing.
To unravel the underlying molecular mechanisms, we investigated in Chapter 3 whether gene expression analysis after hepatotoxicant exposure could produce a limited set of informative biomarkers for human hepatotoxicity. To characterize the model even further, we applied proteomics in Chapter 4, to strengthen the applicability of the model. To assess the additonal value of the zebrafish embryo as a model for hepatotoxicity, we performed a meta-analysis based on gene-expression changes including different species in Chapter 5.
A general discussion and possible future perspectives are discussed in Chapter 6
including discussion on the implementation of a better toxicokinetics characterization of the model, while a summary is provided in Chapter 7.
the changes occurring after exposure to hepatotoxicants. The most practical way to study hepatic gene expression in ZFE is to use whole ZFE RNA extract for analysis, instead of liver extracts, but this may result in masking of signals or lowering the signal/noise ratio of the regulated genes. Although available, sophisticated methods such as micro-dissection to study hepatic gene expression in small organism hinder the throughput of the system73.
24
C
hap
te
r 1
Figure 4 Schematic representation of experiments in this thesis. Embryos in a micro-tre plate
+/-‐ compound exposure
Methods of evalua-on
Phenotype Chapter 2,3,4
Histopathological changes using H&E and Oil Red O
staining
Transcriptomics Chapter 2-‐5
Next genera-on sequencing and Affymetrix microarrays
Proteomics Chapter 4
Mass spectrometry and FTICR analysis
Cross species analysis Mul-species-‐comparison using in vivo systems (mouse, rat) and in vitro systems
(HepG2 and primary hepatocytes)
Chapter 5
Zebrafish
Chapter 2 -‐ 5
Exploring the Zebrafish Embryo
as an alternative Model for
the Evaluation of Liver Toxicity by
Histopathology and Expression Profiling
Marja Driessen, Anne S. Kienhuis, Jeroen L.A. Pennings, Tessa E. Pronk, Evert-Jan van den Brandhof, Marianne Roodbergen, Herman P. Spaink, Bob van de Water, Leo T.M. van der Ven
Archives of Toxicology (2013) May;87(5):807-23
2
28
C
hap
te
r 2
Introduction
The liver is a critical target for xenobiotic-induced toxicity, and drug-induced liver injury is a major contributor in attrition of drugs in pre-clinical development. A first factor in hepatic susceptibility is that active hepatic processing leads to high intracellular concentrations of xenobiotics. Secondly, hepatocellular biotransformation of xenobiotics, which normally protects against the direct-acting toxicity through inactivation and facilitation of excretion, may also lead to reactive metabolites that are more toxic than the parent compound, resulting in liver cell injury4. Xenobiotic-induced hepatotoxicity occurs through different mechanisms associated with distinct histopathological and clinical phenotypes, including cholestasis, steatosis and necrosis, which will be further referred to as nominal phenotypes. These pathological conditions represent the consequences of respectively impaired hepatocellular bile excretion, triglyceride accumulation resulting from disruption of fatty-acid oxidation, and hepatocellular cell death4. Traditionally, histopathology and clinical chemistry are used to detect hepatotoxic properties of chemicals in in vivo rodent studies. Such studies require high numbers of animals, interfere with animal welfare, and are associated with high costs and are not always predictive for the human situation. Therefore, alternative test systems are needed to improve predictivity, and to contribute to reduction, refinement and replacement of in vivo rodent studies.
Following this necessity, several alternative methods to monitor liver injury have been proposed, including liver slices96, cultured primary hepatocytes97,98, and continuous cell lines, particularly the human hepatoma derived HepG2 line99,100 and the more recently derived human hepatocyte HepaRG line40. However, these in vitro systems each have their limitations related to their reductionistic nature and to loss of functionality compared to the liver in vivo101. The zebrafish (Danio rerio) is a widely used model organism to study human biology and pathology, because physiological and molecular functions at the organ and cell level are highly comparable between the zebrafish and humans44. Consequently its value in the area of toxicology testing as well as drug discovery has also been recognized, making it a potentially important alternative for in vivo testing in rodents102. The zebrafish has several experimental advantages such as its short life cycle, accessibility and availability, and the power to generate high numbers of embryos easily, which makes the model suitable for high throughput testing. Moreover, the zebrafish genome is completely sequenced and a wide variety of genetic, molecular and cellular manipulation tools are available103. As a particular refinement, the use of the whole zebrafish embryo (ZFE) is advantageous since the early embryo is considered not to perceive pain or otherwise discomfort. According to legislation104, whole ZFE can be considered as an alternative model system and it is already applied for studying chemical toxicity using developmental and lethality endpoints47,66. In contrast to in vitro cell cultures, in vivo cell type and organ interactions are maintained in the whole zebrafish embryo. These aspects may contribute to a better representation of hepatotoxic responses that occur in vivo.
Abstract
30
C
hap
te
r 2
embryo data was compared with available data from in vivo mouse liver and from the HepaRG cell line, at the levels of single genes, pathways, and transcription factors. Pathway and transcription factor-based analyses attractively leveled out differences between models due to species variation, model sensitivity and power.
Altogether, using pooled RNA extracts in NGS analysis combined with histopathology, followed by case-directed traditional microarray, we supportively demonstrate the applicability of the whole zebrafish embryo model for toxicogenomics-based compound- induced hepatotoxicity screening.
Materials and Methods
Materials. Exposure studies were performed with reference compounds known to induce nominal hepatotoxic phenotypes in humans (cholestasis, steatosis and necrosis; Table 1). All test chemicals were purchased from Sigma Aldrich (Zwijndrecht, the Netherlands), and included acetaminophen or paracetamol (N-actyl-para-aminophenol; APAP, CAS no.103-90- 2), paraquat (1,1’-Dimethyl-4,4’-bipyridinium dichloride, PQ, CAS no.1910-42-5), thioacetamide((CH3-C(S)NH2); TA, CAS no.62-55-5), amiodarone hydrochloride (2-butyl- 3-benzofuranyl-4-[2-(diethylamino)ethoxy]-3,5-diiodophenyl ketone hydrochloride; AM, CAS no.19774-82-4), valproic acid (2-propylpentanoic acid sodium; VPA, CAS no.1069-66- 5), tetracycline (TET, CAS no.64-75-5), cyclosporine A (CsA, CAS no.59865-13-3),17α- ethinyl-estradiol (17α-Ethinyl-1,3,5(10)-estratriene-3,17β-diol; EE2, CAS no.57-63-6) and chlorpromazine (2-Chloro-10-(3-dimethylaminopropyl)phenothiazine hydrochloride; CPZ, CAS no.69-09-0), tricaine methansulfonate (MS-222; CAS no. 886-86-2). Dimethylsulfoxide (DMSO, CAS no. 67-68-5) was ordered from Fisher-Scientific. The RNeasy MinElute Cleanup kit (Cat. No. 74204) and the QIAzol Lysis reagent (Cat. No. 79306) were obtained from Qiagen Benelux B.V. (Venlo, the Netherlands). Phase-lock Gel Heavy (Cat. No. 2302870) and the metal micro pestle (P985.1) were purchased from VWR International B.V. (Amsterdam, the Netherlands).
Zebrafish. Wild-type zebrafish (Danio rerio) were originally obtained as commercially bred Singapore import (Ruinemans Aquarium BV, Montfoort, The Netherlands), which were maintained and bred in our facilities for more than 5 generations. Adult zebrafish (aZF) used in this study were approximately 14 months of age. For generation of zebrafish embryos, two male and two female adulte zebrafish were set together one day before spawning, after a period of four day separation to improve egg production. The breeding tank was constructed to prevent egg predation and after spawning, a glass siphon was used to collect the eggs. All eggs were checked for fertility and thereafter pooled in a single petri dish containing Dutch Standard Water (DSW; demineralized water supplemented with NaHCO3 (100 mg/l), KHCO3 (20 mg/l), CaCl2 · 2H2O (200 mg/l), and MgSO4 · 7H2O (180 mg/l) aerated for 24h at 27°C) until the start of the exposure.
32
C
hap
te
r 2
group consisted of four male zebrafish. Test concentrations and exposure duration were as for zebrafish embryo (except CPZ; Table 1). After the exposure, the zebrafish were euthanized with a solution of 100 mg/l MS-222 buffered with sodium bicarbonate. Following decapitation, the fish were slit ventrally from heart to anus and livers were dissected and snap frozen in liquid nitrogen zebrafish embryo and aZFL samples were stored at -80°C until RNA extraction.
Experiments with adult zebrafish were approved by the RIVM Animal Experimentation Ethical Committee and carried out in accordance with relevant Dutch national legislation, including the 1997 Dutch Act on Animal Experimentation.
Histopathology. For histopathology, zebrafish embryo were sampled from three highest concentrations without mortality or teratogenicity of the concentration range finding study and adult zebrafish livers were dissected from adult fish exposed in the expression study. Whole zebrafish embryo and aZFL were fixed in 4% paraformaldehyde for 24 hrs, then transferred and stored in 70% ethanol until use. Samples were first embedded in a specially designed 1% agarose mold for adequate positioning of the embryos108,109, and then transferred to paraffin, whereafter 4 µm sections were routinely stained with hematoxylin and eosin (H& E) and covered with a glass coverslip. Additional cryosections from AM, VPA and TET were stained with Oil Red O to determine fatty droplet accumulation in zebrafish embryo and aZFL. Furthermore, in aZFL, additional sections from CPZ, EE2 and CsA were stained with Fouchet staining to detect bile accumulation. For the aZFL only one replicate per compound was included. As for the zebrafish embryo, approximately 12 replicates were included per compound.
RNAisolation and processing. Total RNA was isolated using the MinElute Clean up kit according to the protocol of de Jong et al.,110. RNA concentration was measured spectro-photometrically (ND1000; NanoDrop technologies, Wilmington, DE) and RNA integrity was assessed using Bioanalyzer 2100 (Agilent Technologies, Amstelveen, the Netherlands). All samples contained intact total RNA with RNA Integrity Number (RIN) > 8. To reduce cost of NGS, RNA extracts of all zebrafish embryo of the highest exposure concentration of each compound were combined to a single pool. This is justified because our primary interest was in responsiveness potency of the zebrafish embryo, not in effects of single compounds, and pooling of samples has analytical advantages (see Discussion). We added control samples to be able to pick up any transcripts that are highly expressed in control conditions and down regulated in samples treated with liver toxicants, although, these transcripts may be harder to detect because they now have their highest expression level only in a minority of the pooled samples (2 control samples versus 9 hepatotoxi-cants). A pool contained 500 ng/µl RNA, with equal quantities derived from approximately 45 embryos per compound (Fig.1). A similar RNA pool was prepared from three adult zebrafish livers per compound at the same concentration.
Exposure conditions. All zebrafish embryo exposures started at 3 days post fertilization (3dpf) with embryos which were randomly derived from at least 2 spawning units. Exposures were performed in 48-well plates (BD Biosciences) containing 1 ml of test medium per well. Exposures were performed in an incubator at 26.5 ± 1°C in a static way, and lasted for 48 hrs. Concentrations for the expression study were defined in a range finding study conducted with zebrafish embryo, where respectively 6 and 7 exposures were tested for DMSO and water diluted compounds, with 12 zebrafish embryos per condition, each embryo in a single well. The exposures in the expression study were conducted with three concentrations (Table1), where the highest concentration was defined as the no effect concentration in zebrafish embryo (no mortality or teratogenicity) in the range finding study. Each concentration was performed in five replicate units, where each unit had 15 embryos (three wells each with five embryos). Each plate was set up to have 6 vehicle control wells. After exposure, the 15 embryos of each replicate unit were sampled in a single tube and snap frozen in liquid nitrogen.
aZF were transferred to the static test system 3 days prior to testing for acclimatization, and this consisted of full-glass aquaria containing three liters of DSW covered by a glass plate. The water was continuously aerated and ambient conditions were daily monitored. The temperature was kept at 27 ± 2 °C, pH between 7.4 to 9.0, and oxygen > 7.10 mg/l at all times. The light/dark cycle was 14 hours light and 10 hours dark. Each experimental
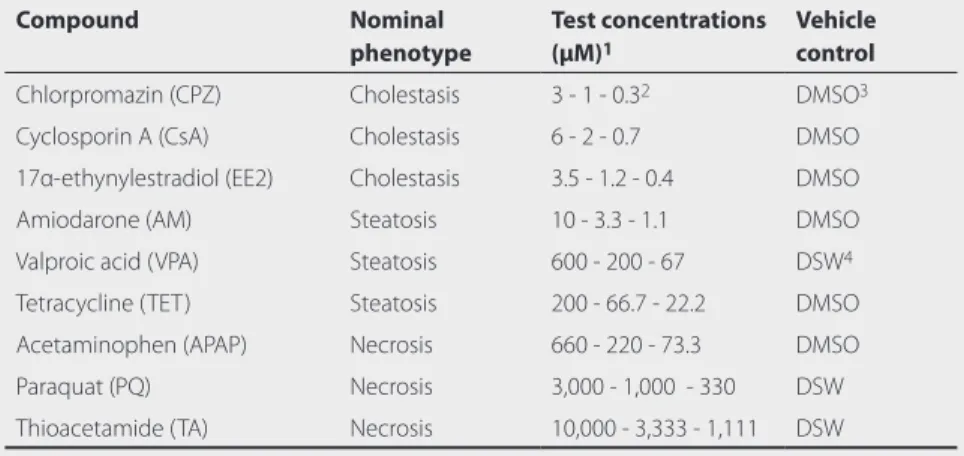
Table 1 Reference compounds.
Compound Nominal
phenotype
Test concentrations (μM)1
Vehicle control
Chlorpromazin (CPZ) Cholestasis 3 - 1 - 0.32 DMSO3
Cyclosporin A (CsA) Cholestasis 6 - 2 - 0.7 DMSO
17α-ethynylestradiol (EE2) Cholestasis 3.5 - 1.2 - 0.4 DMSO
Amiodarone (AM) Steatosis 10 - 3.3 - 1.1 DMSO
Valproic acid (VPA) Steatosis 600 - 200 - 67 DSW4
Tetracycline (TET) Steatosis 200 - 66.7 - 22.2 DMSO
Acetaminophen (APAP) Necrosis 660 - 220 - 73.3 DMSO
Paraquat (PQ) Necrosis 3,000 - 1,000 - 330 DSW
Thioacetamide (TA) Necrosis 10,000 - 3,333 - 1,111 DSW
1 Test concentrations of the reference compounds for transcriptomics and histopathology 2 aZF were exposed to a different range of CPZ, i.e. 1 - 0.3 μM - 0.1 μM.
3 Compounds initially dissolved in DMSO and diluted further in DSW with a final DMSO concentration of 0.2% v/v. DSW and DMSO 0.2% v/v were included as vehicle controls.
34
C
hap
te
r 2
GeneChiphybridization. For control and CsA , RNA samples were used as produced for the RNA NGS sequencing (Fig. 1). Sample labeling and hybridization to Affymetrix GeneChip zebrafish ST Genome Arrays were performed by ServiceXS B.V. (Leiden, the Netherlands). The Ambion WT Expression kit (#4411974) was used to synthesize labeled sense stranded cDNA starting from 100 ng total RNA. The minimal yield of the cRNA product is 10 µg. The Affymetrix Terminal Labeling Kit (901524) was used to perform the fragmentation and terminal labeling step using 5.5 µg of the ss cDNA. The concentration and the quality of the cRNA and fragmented ss cDNA samples were assessed using the Nanodrop and the BioAnalyzer. A total amount of 2.9 µg (25 ng/µl) fragmented ss cDNA was finally utilized for the hybridization on the Affymetrix Zebrafish ST Array. The Ambion WT Wash and Stain Kit for GeneTitan Hybridization (#901622) was used for the hybridization, washing, staining and scanning of the chips. The entire experimental procedure was carried out according to ServiceXS Standard Operating Procedures (SOPs) which have been validated for use with the Affymetrix kits and GeneChips and Array Plates and are completely compatible with the Affymetrix protocols.
The software program Affymetrix GeneChip Command Console (v3.2) was used for fully automated operation of the Affymetrix fluidics stations, which process the washing and staining of the cartridges. After scanning, the array images (DAT files) as well as the correct alignment of the grid were inspected using the program Affymetrix Command Console Viewer software.
Data analysis. In the NGS output file, transcripts were quantified to reads per kilobase of exon model per million mapped reads (RPKM) values, which are expression values corrected for library size and transcript length. These RPKM values were calculated with the CLC Genomics Workbench software111. Previous RNA NGS studies of zebrafish embryos indicated that this technique is extremely sensitive and can even detect gene expression at levels that are hard to detect with other high density technologies such as micro-arrays112–114. On the other hand, at extremely low expression levels, exact quantification and reproducibility are often impaired. We therefore used a filter level to exclude unreliable values. Based on previous experience (unpublished results), this filter level was set at an RPKM of 0.12 and only genes with a higher RPKM value were included in the analyses. Statistical analyses were carried out using the R statistical software environment (http:// www.r-project.org). To investigate the expression of genes associated with hepatotoxicity, gene lists were made using a text-mining tool (Anni2.1, April, 2010)115. This tool provides an interface to Medline and retrieves associations for several classes of biomedical concepts. For determining the relevance to the applied search term, every concept is given a concept weight. The used search terms were ‘hepatotoxicity’ and ‘heart-, eye-, brain development’, and were based on human data. As a specificity threshold, the maximum value of the multiple search terms combined should exceed 0.01. Functional overrepre-sentation analysis was performed using the software program PathVisio2 (2.0.11, February, RNANGSsequencing. NGS sequencing was performed by BaseClear B.V. (Leiden, the
Netherlands) using the Illumina GAII instrument. RNA seq libraries were made from 10 µg total RNA for each pool using the Illumina mRNA-Seq Sample Preparation Kit according to manufacturer’s instructions (Illumina, Inc., San Diego). In brief, this included purification of the RNA, fragmentation through divalent cations under elevated temperatures, followed by cDNA synthesis. Next, adaptors were ligated and the product was again purified and then amplified. A quantity of 4 pmol of each library was transferred to a flow cell, there again amplified to produce clusters of fragment copies, which were then paired end sequenced with a read length of 51 nucleotides. Fragments in a cluster were sequenced twice (forward and reverse), ensuring highly accurate alignment of the reads. Paired end sequences can be considered as technical duplicates, to control for reliability of the procedure. The Illumuna system is based on fluorometric image analysis, in which base calling and tag counting were performed using the Illumina pipeline. The sequence reads were mapped to the reference genome (Ensemble, Zv8, Release 59, August 2010) using the CLC Genomics Workbench (version 4.0.3., October 28, 2010).
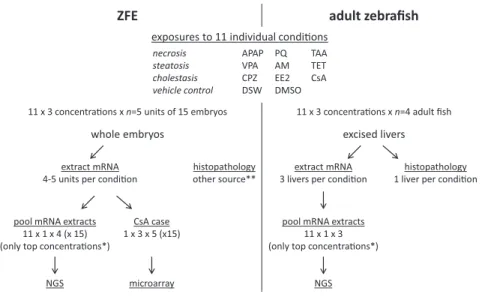
Figure 1 Study design for next generation sequencing analysis.
Each pool contained 500ng/μl total RNA, consisting of equal absolute quantities of total RNA from each exposure to the highest concentration of each compound
ZFE adult zebrafish
exposures to 11 individual condi�ons
11 x 3 concentra�ons x n=5 units of 15 embryos 11 x 3 concentra�ons x n=4 adult fish
whole embryos excised livers
extract mRNA 4-5 units per condi�on
histopathology other source**
extract mRNA 3 livers per condi�on
histopathology 1 liver per condi�on
pool mRNA extracts 11 x 1 x 4 (x 15) (only top concentra�ons*)
NGS
CsA case 1 x 3 x 5 (x15)
microarray
pool mRNA extracts 11 x 1 x 3 (only top concentra�ons*)
NGS
* The 2 lower concentra�ons were for con�ngency in case of toxicity in the top concentra�on, and could be included in the CsA case study.
** Embryos for histopathology were sampled from the concentra�on range finding study.
necrosis APAP PQ TAA
steatosis VPA AM TET
cholestasis CPZ EE2 CsA
36
C
hap
te
r 2
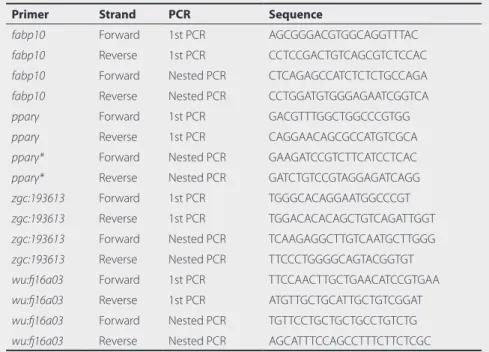
RNAprobes. Anti-sense RNA probes were designed using Primer-BLAST from the NCBI website122 based on the complete RefSeq sequence of the gene of interest. Primers were ordered by Invitrogen (Life Technologies, Breda, the Netherlands) and are summarized in Table 2. Primers were used for an RT-PCR with the Titan One Tube RT- PCR System (Roche Applied Science). This PCR product was purified with the QIAquick PCR purification kit (Qiagen, Venlo, the Netherlands) and a nested PCR was then conducted to amplify the PCR product. A synthesis step using T3 and T7 polymerase promoters was then performed to generate DIG-labeled RNA probes.
In situ hybridization. Whole mount in situ hybridization was performed following a protocol adapted from Thisse et al.124. ZFEs were collected at 5-dpf and fixed overnight in 4% paraformaldehyde. After fixation zebrafish embryos were washed 2 times in 1x PBS, bleached in 3% H2O2/0.5% KOH solution to remove pigment and washed in 1x PBS. Following bleaching, the zebrafish embryos were dehydrated in a graded methanol/PBS series and stored in 100% methanol at -20°C. Before in situ hybridization zebrafish embryos were rehydrated with 50/50 PBS/MeOH for 5 min, washed 4 times for 5 min with PTW 2011)116. A pathway was considered ‘overrepresented’ when the Z score was greater than
two and the minimally required number of changed genes was set at two. Pathways were retrieved from Curated collection of Pathways117, Kyoto Encyclopedia of Genes and Genomes (KEGG), and manually curated collection of Pathways (MC). BLAST was employed to search for homologs of the hypothetical transcripts against the NCBI Non-Redundant database. This procedure was used to assign hypothetical transcripts with a functional annotation, based on protein sequence similarity.
All Affymetrix Cell Intensity Files (*.cel) generated for each Genechip using the Affymetrix GeneChip Command Console (v3.0) software were normalized using the Robust Multichip Average (RMA) algorithm. For all systems, the data was annotated with a MBNI custom CDF specifically designed for the chips (http://brainarray.mbni.med.umich.edu/Brainarray/ Database/CustomCDF/CDF/)118. Mouse liver expression data were obtained from an exposure study of Kienhuis et al.119, where the mice were exposed to a dose of 26.6 mg/kg b.w. of CsA for 11 days. Expression data of HepaRG cells exposed for 12 hrs to 300 μM was obtained from Jennen et al.120, EBI ArrayExpress (http://www.ebi.ac.uk/microarray-as/ae/) with accession number E-MEXP-2458. All gene expression signals were Log2 transformed before calculations were performed.
In the CsA case study, comparisons were performed on the level of single significantly expressed genes, pathways and enriched motifs for transcription factors. Significantly expressed genes were selected in whole zebrafish embryo, in vivo mouse liver, and the in vitro cell line using ANOVA performed over different exposure conditions (concentrations, doses, time- points) with an FDR cut-off of 0.05, 0.1, and 0.01, respectively. Comparison of regulated pathways between the whole zebrafish embryo, mouse in vivo and the cell line was done using the T-Profiler software, which enables a threshold and parameter free analysis of genome-wide expression patterns83. The input for T-Profiler consisted of individual samples of the three models. After pathway calculation the enrichment score, that is the t-value, was averaged per condition per model. Heatmaps are produced using the GeneMaths XT Software (Version, Applied Maths NV). Transcription factor enrichment analysis was performed using the significant genes in whole zebrafish embryo, in vivo mouse liver and the in vitro cell line.
Transcription factor binding motifs associated with the significant genes were determined using the C3 dataset, which contains transcription factor binding motifs found 2kB up- or downstream of target genes121. For optimal retrieval, the zebrafish and mouse gene IDs were converted to their human homologues by using the homologene dataset of the NCBI. To determine which transcription factors binding motifs were present significantly more than random in the gene sets, a random permutation test was applied using a cut-off value of p < 0.01. As an additional criterium the transcription factor binding motifs should be found by at least four genes in the set. To calculate the probability of overlap of the transcription factor binding motifs between models, the phyper package in R was used.
Table 2 Primer sequences for in situ hybridization.
Primer Strand PCR Sequence
fabp10 Forward 1st PCR AGCGGGACGTGGCAGGTTTAC
fabp10 Reverse 1st PCR CCTCCGACTGTCAGCGTCTCCAC
fabp10 Forward Nested PCR CTCAGAGCCATCTCTCTGCCAGA
fabp10 Reverse Nested PCR CCTGGATGTGGGAGAATCGGTCA
pparγ Forward 1st PCR GACGTTTGGCTGGCCCGTGG
pparγ Reverse 1st PCR CAGGAACAGCGCCATGTCGCA
pparγ* Forward Nested PCR GAAGATCCGTCTTCATCCTCAC
pparγ* Reverse Nested PCR GATCTGTCCGTAGGAGATCAGG
zgc:193613 Forward 1st PCR TGGGCACAGGAATGGCCCGT
zgc:193613 Reverse 1st PCR TGGACACACAGCTGTCAGATTGGT
zgc:193613 Forward Nested PCR TCAAGAGGCTTGTCAATGCTTGGG
zgc:193613 Reverse Nested PCR TTCCCTGGGGCAGTACGGTGT
wu:fj16a03 Forward 1st PCR TTCCAACTTGCTGAACATCCGTGAA
wu:fj16a03 Reverse 1st PCR ATGTTGCTGCATTGCTGTCGGAT
wu:fj16a03 Forward Nested PCR TGTTCCTGCTGCTGCCTGTCTG
wu:fj16a03 Reverse Nested PCR AGCATTTCCAGCCTTTCTTCTCGC
38
C
hap
te
r 2
(1x PBS, 0.1 % Tween20) followed by 40 min incubation in 5µg/ml proteinase K in PTW at 37°C. Embryos were fixated again in 4% paraformaldehyde, followed by 5 times 5 min wash in PTW. Until here, all the washing steps were performed in 24-well plates using small baskets made from 15 ml tubes with a nylon mesh melted to its opened bottom end. After this, the embryos were transferred to transparent 4 ml screw cap vials and prehybridized in hybridization buffer (50% deionized formamide; 5x SSC; 500 µg/ml tRNA; 50 µg/ml heparin; 0.1% Tween20; pH 6.0 with 1M citric acid) for 3 hrs at 70°C. The buffer was then replaced by fresh hybridization buffer (pre-heated for 5-10 min at 70°C) containing digoxigenin labelled RNA probe and incubated overnight at 70°C. After hybridization the embryos were washed twice at 70°C for 20 min with respectively 50% hybridization buffer (without tRNA and heparin)/50% 2xSSC; and 2xSSC. Then the zebrafish embryo were washed twice with 0.2xSSC for 60 min, followed by 5 min washes at room temperature with 50% PBT (PTW with 2% sheep serum and 0.2% BSA)/50% 0.2xSSC and finally 100% PBT. The embryos were incubated at room temperature while shaking with PBT for 3 hrs, followed by incubation overnight at 4°C with anti-DIG antibody solution diluted at 1/2000 with PBT under gentle agitation. The embryos were subsequently washed 6 times 15 min each with PBT at room temperature. Embryos were transferred to a 24-wells plate and washed 4 times for 20 min with staining buffer (100 mM Tris pH 9.5, 50 mM MgCl2, 100 mM NaCl, 0.1% Tween 20, 5 mM levamisole). The first of these washing steps was done with staining buffer without MgCl2. Embryos were stained with 20mL/ml NBT/BCIP staining buffer until an optimal signal was obtained. The staining reaction was stopped by three washes in 0.5 ml PTW, followed by overnight fixation in 4% paraformal-dehyde at 4°C. Embryos were subsequently washed 3 times in 0.5 ml PTW and transferred to 100% glycerol, placed on a rocker and agitated gently overnight at room temperature in the dark, mounted in 100% glycerol and observed and photographed microscopically.
Results
Hepatotoxicant-specific liver pathology in zebrafishembryo and adult zebrafishliver. Histopathological examination in the whole zebrafish embryo and aZFL was conducted after 48 hrs of exposure to the model compounds. In H&E staining, hepatocytes of the control adult zebrafish showed a similar morphology as mammalian hepatocytes (Fig. 2a-b). Although the liver as a whole did not show the obvious lobular structure which is present in mammals, substructures such as bile canaliculi could be discerned (Fig. 2b, arrow). Hepatocytes in the control embryos showed a more open cytoplasm, although with varying degrees, indicative of varying levels of glycogen contents (Fig. 3a-b). After 48 hrs of exposure, cholestasis was a remarkably frequent observation in aZFL, with a high incidence in nominal cholestatic compounds (CPZ, EE2, CsA), but also with most of the non-cholestatic compounds (Table 3). Cholestasis appeared as intracellular and intra-
Figure 2 Microphotographs illustrating of various observations.
40
C
hap
te
r 2
canalicular brown pigment accumulation in H&E staining (Fig. 2c-e), and these subtypes were confirmed by Fouchet staining (Fig. 2g-h, compared with control in 2f). In addition, with TAA, Fouchet staining was confined to the nuclei (Fig. 2i). Cholestasis was not observed in zebrafish embryo. Lipid vacuoles as a mark of steatosis were not observed in aZFL, but well discernible in zebrafish embryo with two of the nominal steatotic compounds and one nominal cholestatic compound (Fig. 3c-e). However, Oil Red O staining also revealed lipid droplets in aZFL, with nominal steatotic compounds (illustrated for TET in Fig. 2k, compare with control in 2j). Necrosis did not show in either aZFL or zebrafish embryo, i.e. not in a zonal pattern as can be observed in mammal liver. On the other hand, marks of cell death, particularly chromatin condensation and cytoplasmic eosinophilia, were observed in both aZFL (Fig. 2l) and zebrafish embryo with some compounds, although without much consistency between life stages and clearly more compound than class specific. Additional observations were chromophobic and eosinophilic vacuolization, which occurred in aZFL and zebrafish embryo (Fig. 2m-n, Fig. 3f-h), mainly coinciding with nominal cholestatic and necrotic compounds (Table 3); and cytoplasm basophilia, in aZFL only observed with EE2 (Fig. 2o) and in zebrafish embryo with CPZ (Fig. 3c).
Overall assessment of all exposed animals indicated that simple histopathological effects were mainly observed with nominal steatotic compounds, and that complex histopathology effects were present in most nominal cholestatic and necrotic compounds (Table 3). Furthermore, serial sections of the whole zebrafish embryo revealed additional histo- pathology in the intestinal epithelium, which showed vacuolization after exposure to CPZ, EE2 and APAP (Table 3). Histopathological observations are summarized in Table 3, without considering the xenobiotic concentration conditions.
Next generation sequencing of the whole zebrafish embryo and adult zebrafish liver transcriptomes. Next-generation RNA sequencing was used to compare the transcriptomes of adult zebrafish liver and whole zebrafish embryo. A number of 21914 transcripts were sequenced from zebrafish embryo (Fig. 4a, blue and yellow area) and 16459 transcripts from the adult zebrafish liver (Fig.4a, blue and green area). There were 15801 overlapping transcripts (Fig. 4a, blue area). These three areas can also be distinguished when comparing relative expression (RPKM values) between zebrafish embryo and adult zebrafish liver (Fig. 4b). Here, the grey diagonal (Fig.4b) separates transcripts that are more highly expressed in the whole zebrafish embryo (above) from those that are more highly expressed in the adult zebrafish liver (below).
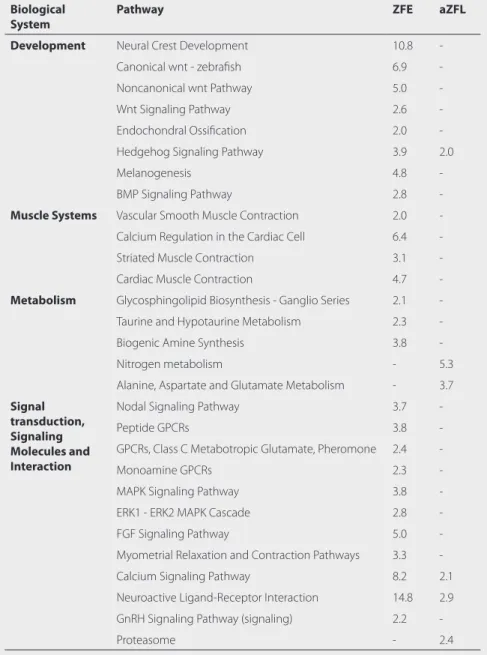
PathVisio2 was used to identify overrepresented biological pathways and processes from the uniquely expressed transcripts in zebrafish embryo (6113 transcripts, Fig.4a-b, yellow area) and adult zebrafish liver (658 transcripts, Fig.4a-b, green area). zebrafish embryo thus showed overrepresentation in developmental processes, signaling pathways and in other
Ta bl e 3 H is to pa th ol og ic al o bs er va tio ns i n Z FE a nd a ZF L. Embr yo Liv er A dult Liv er Illustr ation in F ig . Cholestasis St ea tosis Necr osis Cholestasis St ea tosis Necr osis CP Z* CsA EE2* AM VPA TE T AP AP* PQ TA A C PZ CsA EE2 AM VPA TE T AP AP PQ TA A n 7 3 12 6 6 5 10 5 8 3 3 3 3 3 3 3 3 Cholestasis (H&E) -2 1 3 -1 3 1c-1e Cholestasis(F ouchet) cn cp in
1f – 1i
Lipid vacuoles (H&E)
6 -6 6 -3 3 3 -2c-2e Oil-R ed-O ( cr yosec tions) 6 6 5 3 3 3 1j-1k Chr omatin condensation 2 -11 -2 -1l Chr omophobic vacuolization -1 8 -3 -3 2f-2g 1m-1n Eosinophilic vacuolization 4 2 -3 5 1 2 3 -3 -2h Cyt oplasmic basophilia 4 -5 7 -3 -1o O bs er va tio ns a re q ua lit at iv e, i.e. wi thout c on si de ring s ev er it y or i nt en si ty of e ffe ct s, a nd wi thout c on si de ring c onc en tr at ion de p en de nc y of e ffe ct s. C n, c an al ic ul ar ; cp , c yt op la sm at ic ; i n, i nt ra nu cl ea
r; * CP
Z, E E2 a nd A PA P s ho w ed re m ar ka bl e v ac uo liz at io n i n t he i nt es tin al e pi th el iu m . E m pt y c el ls i nd ic at e n ot t es te
d. - s
42
C
hap
te
r 2
pathways not obviously related to the liver. In adult zebrafish liver, overrepresented pathways were mainly found in the immune and intracellular processes (Table 4). It should be noted that due to nature of the experimental setup and the pooling of all individual samples that regulation of neither adaptive or toxicity pathways nor of transcription factors can be attributed to any individual of our hepatoxicants.
Hepatotoxicity-associated gene expression in the exposed zebrafishtranscriptomes. Next, to discover whether transcripts related to either human hepatotoxicity or development were expressed in exposed whole zebrafish embryo or adult zebrafish liver, we performed text mining using an automated search strategy (Supplementary Table 1 for hepatotoxicity, supplementary Table 2 for development).
Transcripts specific for hepatotoxicity were evenly distributed in both pooled zebrafish embryo and adult zebrafish liver samples and mainly located in the set of overlapping genes (Fig. 4b, red squares, n=127, and explained in supplementary Table 3). Furthermore,
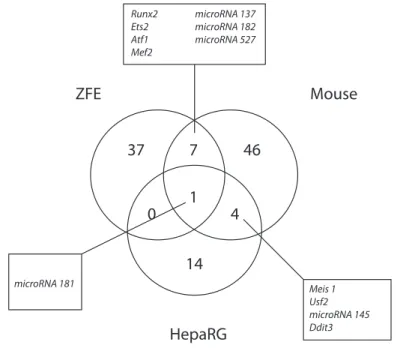
Figure 4 Expression comparison of hepatotoxicity-associated genes and development specific genes for the adult zebrafish liver and zebrafish embryo.
a. Venn diagram showing the number of expressed transcripts per experimental pool and the overlap of these expressed transcripts after exposure to a set of model hepatotoxicants. b. Black circles represent genes that were neither related to hepatotoxicity nor involved in development of heart, eye and brain based on the results of the text-mining. Grey circles represent genes that were not included in the analysis due to their RPKM expression below 0.12. Green diamonds indicate genes associated with development, red squares indicate genes associated with hepatotoxicity. Colored areas indicate model specificity of transcripts: green area only expressed in adult zebrafish liver (658), yellow area only expressed in whole zebrafish embryo (6,113), blue area expressed in both model systems (15,801). White shaded area indicate transcripts not involved in analysis (color figure online).
Distribution of assembled transcripts
6113 15801 658
a.
b. Relative expression in aZFL (ln RPKM values)
R
ela
tiv
e e
xpr
ession in ZFE (ln RPKM v
alues)
Figure 3 Hepatotoxicant-specific liver pathology in whole zebrafish embryo.