http://www.sciencepublishinggroup.com/j/eas doi: 10.11648/j.eas.20170205.11
ISSN: 2575-2022 (Print); ISSN: 2575-1468 (Online)
Algorithm for Calculating the Initial Defect Structure of
Semiconductor Silicon
Vitalyi Igorevich Talanin, Igor Evgenievich Talanin, Vladislav Igorevich Lashko
Department of Computer Science & Software Engineering, Institute of Economics & Information Technologies, Zaporozhye, Ukraine
Email address:
[email protected] (V. I. Talanin)
To cite this article:
Vitalyi Igorevich Talanin, Igor Evgenievich Talanin, Vladislav Igorevich Lashko. Algorithm for Calculating the Initial Defect Structure of Semiconductor Silicon. Engineering and Applied Sciences. Vol. 2, No. 5, 2017, pp. 77-88. doi: 10.11648/j.eas.20170205.11
Received: June 5, 2017; Accepted: June 21, 2017; Published: November 28, 2017
Abstract:
An algorithm for calculating the defect structure of semiconductor silicon crystals was proposed. The proposed approach makes it possible to calculate the sizes, distribution densities of grown-in microdefects at any point of the crystal. Calculations are performed by using and analyzing the thermal conditions of crystal growth in the temperature range from 1683 K to 300 K. The algorithm flowchart is given.Keywords:
Semiconductor Silicon, Precipitates, Molecular Potential, Grown-in Microdefects, Microvoids, Dislocation Loops, Algorithm1. Introduction
Semiconductor silicon includes dislocation-free single crystals of silicon, which were grown by the Czochralski (CZ-Si) and floating zone melting (FZ-Si). At present, without such crystals, it is impossible to imagine the development of the electronics industry. The parameters and properties of silicon devices depend critically on the defective structure of CZ-Si and FZ-Si crystals. Various technological treatments of silicon for the creation of devices lead to the transformation of the initual defect structure.
Recently, physical foundations for the formation of the initial defect structure of semiconductor silicon [1, 2]. Mathematical models of the formation of various structural defects have also been developed [3]. This means that defect formation during crystal growth can be a completely controlled process. To do this, it is necessary to create a software package that could analyze the processes of defect formation in silicon from a unified position. Thus, the task of developing virtual methods for investigating (controlling) the initial defect structure of silicon with the help of algorithms of formation and transformation, both individual types of defects, and the entire structure, depending on the thermal conditions of crystal growth is relevant. The solution of this problem is the purpose of this work.
2. Physical Model of Formation and
Transformation of Structural Defects
In the process of growth of dislocation-free single crystals of silicon are formed structural imperfections. They are called grown-in microdefects. It is well known that the formation and transformation of grown-in microdefects depends critically on the thermal conditions of the crystal growth [1, 2]. The thermal conditions for crystal growth include: (i) growing method, (ii) crystal growth rate ( ), axial and radial temperature gradients ( and ), crystal cooling rate ( ), crystal diameter.
coalescence of precipitates during cooling of the crystal from the crystallization (melting) temperature to room temperature; and (iii) the formation of microvoids or dislocation loops at temperatures ≤ 1423 depending on the growth parameter ⁄ . This physical model is called the diffusion model of the formation of grown-in microdefects. The mathematical apparatus of the diffusion model using modern information technologies can provide the basis for the development of a software complex for analysis and calculation of the formation of growth and postgrowth microdefects in dislocation-free silicon single crystals [2].
3. Calculation of the Initial Defect
Structure of Semiconductor Silicon
Proceeding from the diffusion model of formation and transformation of grown-in microdefects, the unified algorithm for calculating the defect structure of silicon should be a complex of algorithms for the formation of individual grown-in microdefects, taking into account the thermal conditions for growing crystals. The experimental and theoretical investigations of ultrapure dislocation-free silicon crystals demonstrated that the formation of a defect structure during the crystal growth occurs in the direction from the high-temperature precipitation of impurities to the formation of secondary growth defects (microvoids or dislocation loops). The main role in the process of defect formation is played by the precipitation of impurities [2]. Therefore, in the center of the unified algorithm is the algorithm for the formation of precipitates.
3.1. Algorithm for the Formation of Precipitates
At present, two approaches are used to calculate the initial stage of formation of precipitates (formation of impurity-intrinsic defect complexes): classical and probabilistic [3, 7].
3.1.1. Classic Approach
In [8], was calculated the formation of “impurity–intrinsic point defect” complexes during the growth of silicon crystals with the inclusion of the elastic interaction between the components of the complex. The calculation algorithm is based on approximation of the strong complexation for model of consistent diffusion, which allows a simple physical interpretation and can be the most adequate for the physical model. [9]. The solution to the problem of diffusion of a component A in a semi-infinite sample homogeneously doped with a component B, with the absence of evaporation of the component B from the sample and the presence of the free component A at the sample boundary, has the form [10]:
(
1)
00
0 ( / )
(0) 1 ,
( / ) 0, A A B A A A erfc d N N erfc d
H N Q
λ λ λ
λ λ λ − − ≤ = − = > (1) 0 0 0 0, ( / )
( ) 1 ,
( / )
B B
B B
B
H N Q erfc d
N
erfc d
λ λ
λ λ λ
λ
≤
= − =
∞ − >
(2) 1 0 1 0 0 , ( / ) , ( / ) B Q B Q N
Q erfc d
N erfc d λ λ λ λ λ λ ≥ = < (3)
{
}
1 1 0 1 0
1 1 0 1 2 0
( / ) ( ) ( / )
( / ) (0) ( / )
B Q B B
B Q A B A
N S d N S d
N S d N N S d
λ λ
λ λ
= ∞
= − (4)
where
2 2
1 2 1
exp( ) exp( )
( ) ; ( ) ; (0) (0).
( ) ( ) A B A
x x
S x S x N N H
xerfc x xerf x
π π − − = = − = 2 0 0 1 0 0 , ( ) d B B N e N derfc d λ
π λ λ
−
= (5)
0
λ is determined from equation:
2 2
0(1 )
0 0 0 0 ( ) ( ) d A B
e erf N
erfc d N
λ λ
λ
−
= (6)
2 2 2
, , ;
A A B B Q Q
d ≡D d ≡D d ≡D
2 A
x
D t
λ= ⋅
where is the concentration of complexes; , , and are the diffusion coefficients of the free components , and complexes, respectively; is the coordinate (crystal length); and is time.
The component is the background impurity (oxygen or carbon ) and the component is intrinsic point defects (vacancies or interstitials ). ! and ! are the concentrations of the free impurities and and "# and
" # are the impurity concentrations at the interface [8]. In the calculations, the following quantities were used:
15 3
(0) (0) 4 10 ( );
A o
H =H = ⋅ сm− FZ−Si
16 3
(0) (0) 8 10 ( );
A o
H =H = ⋅ сm− CZ−Si
14 3
8, 84 10 ; V
C = ⋅ сm− DV = ⋅4 10−5сm2/ ;c
0,17
o
D = exp( 2.54 /− kT),
5
8, 6153 10 / , A(0) c( m) 4
k= ⋅ − eV K H =H T = × 15 3
10 сm− (FZ−Si),
16 3 14 3
(0) (0) 1 10 ( ), (0) 6,31 10 ,
A c I
H =H = ⋅ сm− CZ−Si C = ⋅ сm−
4, 75
I
D = ×10 4 2/ , 1, 9 exp( 3.1/ ). c
сm s D kT
− = ⋅ −
The solution to equations has a physical meaning (" $≈
10$'− 10$) cm–3
as the front boundary of the complex formation reaction. Since is the crystal length and # is the position of the crystallization front, we can conclude that complex formation occurs near the crystallization front [10].
This approximation is valid at the initial stages of the formation of nuclei, when their sizes are small and the use of Fokker–Planck continuity differential equations is impossible.
In paper [11] was considered the modern approach based on solving systems of coupled discrete differential equations of quasi-chemical reactions for the description of the initial stages of the formation of nuclei of new phases and a similar system of Fokker–Planck continuity differential equations. The nucleation and evolution of a complex system of grown-in microdefects (which consists of oxygen and carbon precipitates) during cooling of the crystal are described by the systems of coupled differential equations for each type of defect: 2 2 2 2 2 2 2 2 2 2 2 SiO
o o o
o
SiC
c c c
c
SiO SiC
i i i i
i
SiO SiC
v v v v
v
C C C
D
t z t
C C C
D
t z t
C C C C
D
t z t t
C C C C
D
t z t t
∂ = ∂ −∂ ∂ ∂ ∂ ∂ = ∂ −∂ ∂ ∂ ∂ ∂ = ∂ +∂ −∂ ∂ ∂ ∂ ∂ ∂ = ∂ −∂ +∂ ∂ ∂ ∂ ∂ (7)
In the system of equations (7), we took into account that the oxygen precipitates serves as sinks for oxygen atoms and vacancies and as sources of interstitial silicon atoms. Then, we can write the following equations:
max min 2 2 2 min 1 2 ( , , ) ( , , ) o o o o n n SiO
o o SiO o o SiO o o
n n
C n f n z t n f n z t dn
−
=
=
∑
⋅ +∫
⋅2
2 2, SiO 2
SiO SiO SiO
v v o i i o
C =
γ
C C =γ
C (8)At the same time, the carbon precipitates, in turn, also serve as sinks for carbon atoms and interstitial silicon atoms and as sources for vacancies. Therefore, we can write
max min min 1 2 ( , , ) ( , , ) c c c c n n SiC
c c SiC c c SiC c c
n n
C n f n z t n f n z t dn
−
=
=
∑
⋅ +∫
⋅,
SiC SiC SiC SiC
v v c i i c
C =γ∗C C =γ∗C (9)
In the general case, the proportionality factors
, , ,
v i v i
γ γ γ γ∗ ∗ can depend on the quantities ,
o c
n n and are determined by the conditions of thermodynamic equilibrium [12].
The corresponding system of coupled Fokker–Planck equations can be transformed into the dimensionless form:
2 2 0 SiO SiO O SiC SiC c c f I
f t I
t τ υ τ υ ∂ ∂ = − ∂ ∂ ∂ = − ∂ ∂ ∂ ɶ ɶ ɶ ɶ (10) where o t t
τ= is the dimensionless time. The time constants
in the system of equations (10) are given by the expressions
2
,0 2 0 ,0 2 0
( cr ) / ; ( cr ) /
O O SiO c c SiC
t = n g t = n g , where the critical
growth rates of the precipitates are defined as 2
2
0 0 exp( SiO / ); 0 0 exp( SiC/ )
SiO O O act SiC O c act
g =N υ −G kT g =N υ −G kT . The normalized sizes of the precipitates are determined in the
system of equations (10) as follows:
,0 ,0
/ cr ; / cr
O nO nO c nc nc
υɶ = υɶ = , where nOcr,nccr are the
normalizing critical sizes of the precipitates. The quantities
2
0 ,0 2 0 ,0 2
4 ( cr ) eq; 4 ( cr ) eq
O O SiO O c c SiC c
N =
π
rδ
C N =π
rδ
C are thenumbers of particles in the vicinity of the corresponding precipitates with critical sizes. The size distribution functions of the precipitates in the system of equations (10) are normalized to the initial concentrations of the corresponding nucleation centers:
2
2
2
0 ; 0
SiO SiC SiO SiC SiO SiC f f f f f f = =
ɶ ɶ (11)
The fluxes of particles on the right hand sides of the system of equations (10) are described by the expressions
2
2 2 2
,0 ,0
( ) cr SiO ; ( ) cr SiC ;
SiO SiO SiO O SiC SiC SiC O
O O
B B
A g d n A g d n
υ υ ∂ ∂ = − − = − − ∂ ∂ ɶ ɶ ɶ ɶ
ɶ ɶ (12)
in which the following notation is used for the normalized kinetic coefficients:
2
2 2 2
,0 ,0
( ) cr SiO ; ( ) cr SiC ;
SiO SiO SiO O SiC SiC SiC O
O O
B B
A g d n A g d n
υ υ ∂ ∂ = − − = − − ∂ ∂ ɶ ɶ ɶ ɶ
ɶ ɶ (13)
2 2
2 2 ; 2
SiO SiO SiC SiC
SiO SiC
g d g d
B = + B = +
ɶ ɶ
ɶ ɶ
(14)
The normalized rates of growth and dissolution of the
precipitates in expressions (14)-(15) take the form
2 2
2 2
2 2
0 ; 0 ; 0 ; 0
SiO SiC SiO SiC
SiO SiC SiO SiC
SiO SiC SiO SiC
g g d d
g g d d
g g g g
= = ɶ = ɶ =
The critical size of the precipitates can be determined according to [12] from the expressions:
0 2
ln( i v) 6
p cr
O
i v p
uV r
kT S S γ Sγ uV
σ
µδε
−
=
− (16)
2
ln( i v) 6
p cr
C
с i v p
uV r
kT S S Sγ γ uV
σ
µδε
−
=
− (17)
where o eg, c , i , v
o o c eg i eg v eg
c i v
C C C C
S C S S S
C C C
= = = =
are the supersaturations of the oxygen atoms, carbon atoms, intrinsic interstitial silicon atoms, and vacancies, respectively;
σ
is the density of the surface energy of the interface between the precipitate and the matrix;µ
is the shear modulus of silicon;δ
andε
are the relative linear and volume misfit strains of the precipitate and the matrix, respectively; γi and γv are the fractions of the intrinsic interstitial silicon atoms and vacancies per impurity atom attached to the precipitate, respectively; Vp is the molecularvolume of the precipitate; (1 ) 1 (1 )3
1
i v
u γ x γ x ε
δ
− +
= + + ⋅
+ .
The number of impurity atoms in the compressed precipitates with the radii rO and rC is determined according
to [13] from the formula:
3
, 3
,
4 (1 ) 1
( )
3 1
O C i v
O C
p
r x x
n
V
π γ γ δ
ε
⋅ + + +
=
+ (18)
where is the fraction of impurity atoms per intrinsic defect, x ≤ 2, γi≤ ½, γv≤ ½.
The calculations were performed using the following data:
p
V = 4,302·10-2 nm3 (SiO2); Vp= 2,04·10
-2
nm3 (SiС);
σ
= 310 erg/cm2 (SiO2);σ
= 1000 erg/cm2
(SiС);
µ
= 6,41·1010 Pa;δ
= 0,3;ε
= 0,15; γi =0, 4;γv=0,1; х = 1,5;2
SiO
δ =
0,5431 nm; δSiC =0, 4359nm ; COeq= ⋅8 1016cm−3;
16 3
1 10 ;
eq c
C = ⋅ cm−
0,17 exp( 2,54 / ); 1,9 exp( 3,1 / );
O c
D = − eV kT D = − eV kT
2 2, 54
SiO act
G = eV , GactSiC =3,17eV ,
5
8, 6153 10 /
k= ⋅ − eV K
[11].
The algorithm used for solving the problem of simulation of the simultaneous growth and dissolution of the oxygen and carbon precipitates due to the interaction of point defects during cooling of the crystal from the crystallization
temperature is based on the monotonic explicit difference scheme of the first order accuracy as applied to the Fokker– Planck equations (10) [11].
The critical size distribution functions of the oxygen and carbon precipitates can be found only from the Fokker– Planck continuity differential equations. The model of dissociative diffusion makes it possible to analyze the processes occurring in the diffusion region near the crystallization front. These mathematical models, together with the experimental results obtained from the investigation of quenched crystals, have demonstrated that the nucleation processes occur very rapidly near the crystallization front.
3.1.2. Probabilistic Approach
The classical concepts of a periodic structure of a crystal are based on physical limitations, such as the localization of each atom in the vicinity of a fixed site of the crystal lattice, the consistency of introducing the concept of probability and the mechanical description of the behavior of particles, and the assumption that the number of atoms in a crystal is an integer. Meanwhile, in [14, 15] Vlasov developed a different model of a crystal. In this model, the periodic structure of a crystal not is a consequence of the restrictions on the freedom of movement of atoms in the crystal, but is determined by specific statistical laws of motion of particles, in accordance with which the periodic structure agrees with the freedom of movement of atoms, so that the probability of finding an atom in interstitials is always different from zero [14].
The Vlasov model is based on the following basic physical concepts [14]: (i) the rejection of the principle of the spatial and velocity localization of particles (in terms of the classical mechanics), which takes place regardless of the force interactions; (ii) the introduction of force interactions by analogy with the classical mechanics, but with the inclusion of a new principle of nonlocalization of particles; and (iii) the behavior of each particle of the system is described by means of an ,-function extended in phase space.
The stationary properties of a crystal are described using the distribution density of particles -./0 = 1 ,./, 3043. The molecular field is determined by only probable, rather than exact, positions of the atoms. This is expressed by the potential function containing the probability density of the particles with the inclusion of the temperature distribution of the particles [14]. The choice of the pair interaction potential depends on the problem under consideration. Then, the nonlocal model of a crystal is based on the following nonlinear equations, which allow us to calculate the molecular potential and the particle position density under thermal equilibrium conditions [14]:
./0 = *5 1@?? $,'./06 7 8−9:,;<=. 0> 4/ -./0 = *5 6 7 8−9:,;<=. 0> (19)
where k is the Boltzmann constant; $,' is the pair interaction potential; * is a certain characteristic number. The initial equations are equations for two particles under the steady-state conditions 8BB = 0>. The characteristic number is considered to mean such a value of the parameter * for which
the equations of system (19) have solutions other than trivial. If the position of one of the particles is taken as the origin of the coordinates, we can determine -.00 = *5 .
the crystallization condition can be written as follows: )CD
<=E1 $,'
∗ .-0-'4- = 1 ?
# (20)
where " is the number of particles; G is the melting (crystallization) temperature of the crystal; $,'∗ = − $,'.
For the evaluation of the parameters of the formation of
silicon–carbon and silicon–oxygen complexes, the
interatomic interaction can be represented in the form of the Mee–Lennard-Jones potential:
H./0 = $,'./0 =.J@ 0I KL 8M> J
− N 8M> O (21)
where and /# are the depth and the coordinate of the minimum of the interatomic potential, respectively; N and L are the parameters, N > L. In the case of the formation of a stable bond between the atoms, we have / = √2R /# and
H./0 = HG S. For silicon, the parameters of the interatomic potential are as follows: L=2.48, N=4.0, =2.32 eV; for carbon, the parameters of the potential are L=2.21, N=3.79, =3.68 eV; and for oxygen, the parameters of the potential are L=2.6, N=4.2, =3.38 eV [16. 17].
The characteristic numbers of the silicon-oxygen (*$) and silicon-carbon (*' ) complexes were determined using equation (20) for the number of particles in complex for the number of particles N=2 and .-0 = 5 T1 − 6@U:,;VWX. The calculation gave the following values: *$= 4.482 ∙ 10[6 @$ and *'= 1.099 ∙ 10]6 @$[7].
Equation (19) is written for the conditions of thermal equilibrium of the system. Since the minima of the interatomic potentials correspond to stable equilibrium positions of the atoms in the silicon–oxygen and silicon– carbon complexes, the distribution density of the complexes can be determined as a function of the cooling temperature of the crystal
-. 0 = *5 6 7 8−^:E_`,;E_`
<= > (22)
The results of the calculations showed that the classical theory of nucleation and growth of second-phase particles in crystals and the Vlasov model of crystal formation identically describe the processes of high-temperature precipitation, which provides the basis for the defect formation in crystals. It is important to note that the Vlasov model of a solid state does not require introduction of additional parameters, such as the growth rate and the axial temperature gradient of the crystal, into the calculations.
3.1.3. Algorithm for Calculating the Growth and Coalescence of Precipitates
In the classical theory of nucleation and growth of new-phase particles, the process of precipitation in a crystal is treated as a firstorder phase transition and the kinetics of this process is divided into three stages: the formation of newphase nuclei, the growth of clusters, and the coalescence stage [18]. At the second stage of the precipitation process, clusters grow without a change in their number. This growth
is accompanied by a considerable decrease in the degree of supersaturation of the solid solution.
The nucleation centers attach and detach monomers, which is described by the system of equations [9]:
(
)
0
0 0 1 1
1 1 1 1
0 1
,
,
,
i
i i i i i i i
i i i i
i i
dN
k NN g N dt
dN
N k N g g N k NN
dt dN
N k N g N
dt
+ + − −
= =
= − +
= − + + +
= −
∑
+∑
(23)
where Ni is the volume average concentration of nucleation centers that attach i particles; N is the monomer concentration; k Ni is the rate of attachment of a monomer for a nucleation center; gi is the rate of detachment of a monomer for a nucleation center. At the initial instant of time, the system contains only monomers and nucleation centers. The growth of precipitates is limited by the monomer diffusion. The kinetic coefficients are given by the formula
4
i i
k = πR D, where Ri is the radius of attachment of a free particle by a cluster consisting of i particles; D is the diffusion coefficient of a free particle.
The system of equations (23) obeys the law of conservation of nucleation centers
1 ( )
c i
i
N N t
=
=
∑
and thelaw of conservation of the total number of particles, including both monomers and particles involved in precipitates, i.e.,
( )
( )
1
0 i
i
N N t iN
=
= +
∑
, where N( )
0 is themonomer concentration at the initial instant of time. Therefore, the average number of particles at the nucleation centers can be represented in the form:
( )
( )
00
0
i i
c i
i
iN
N N t
i
N N
=
=
−
= =
∑
∑
(24)In the case of the diffusion controlled precipitation, the mathematical expectation i t
( )
can be described by the macroscopic equation [19]:(
) ( )
(
)
0 E
di
k N N i t m
dt
α
= − + , (25)
where k0 =4πR Di ,
m
is the initial size of precipitates;α
is the parameter dependent on the cluster geometry.Expressions (23) and (25) allow us to write the differential equation that describes the variation in the monomer concentration during the decomposition of the solid solution [9]:
( )
1(
( )
)
(
( )
( )
)
0 c E 0 c
dN t
k N N t N N mN N t dt
α α
−
By numerically solving Eq. (26) simultaneously with Eq. (23) we can calculated the average radius of the precipitate at the growth stage:
( )
33( )
4bi t R t
π
= (27)
At the third stage of the precipitation process, when the particles of the new phase are sufficiently large, the supersaturation is relatively low, new particles are not formed and the decisive role is played by the coalescence, which is accompanied by the dissolution of small-sized particles and the growth of large-sized particles. The condition providing for changeover to the coalescence stage is the ratio
( )
( )
( )
1cr
R t u t
R t
= ≈ , where Rcr
( )
t is the critical radius of theprecipitate. Under this condition, the precipitate is in
equilibrium with the solution ( dR 0
dt = ). The precipitate
grows at R t
( )
>Rcr( )
t and dissolves at R t( )
<Rcr( )
t . With time, the critical radius Rcr( )
t increases and the number ofparticles per unit volume decreases (
n
) [20].In the general case, the size distribution of precipitates has the following form:
( )
,( )
( ) ( )
cr
n t
f R t P u
R t
=
( )
( )
cr
R t u
R t
= (28)
(
)
5 316 exp
2
, 2
( )
2
0, 2
u u
u
u P u
u
u
⋅
−
− <
= −
>
(29)
The average size of precipitates at the stage of the coalescence is proportional to the cube root of time [20]:
( )
3 30 4 ( )
9
sr cr
D t
R t = R t + β (30)
where D is the diffusion coefficient of impurity atoms;
( )
0N kT
σ β = Ω
; Rcr
( )
t0 is the initial critical radius;σ
is the surface tension at the precipitate–solid solution interface;Ω- atomic volume.
( )
( )
0 0M t n t
t t
= (31)
where t0 is the initial critical time; M t
( )
0 is the initialconcentration of precipitates.
The calculations were performed using the following parameters: [18]: Vp= 4,302·10-2 nm3 (SiO2); Vp= 2,04·10
-2
nm3 (SiС);
σ
= 310 erg/cm2 (SiO2);σ
= 1000 erg/cm2 (SiС);µ
= 6,41·1010 Pa;δ
= 0,3;ε
= 0,15;N
= 0.25 nm;),
/
1
.
3
exp(
9
.
1
),
/
54
.
2
exp(
17
.
0
eV
kT
D
eV
kT
D
O=
−
c=
−
K eV k=8.6153⋅10−5 /
.
The analysis was carried out under the assumption that precipitates grow at a fixed number of nucleation centers according to the diffusion mechanism of growth. The model corresponds to the precipitation uniform in the volume.
3.2. Algorithm for Formation of Microvoids and Dislocation Loops
The nucleation of microvoids and dislocation loops begins at specific temperatures (in the temperature range 1423…1173 К), while precipitates are already formed and participate in competing processes of the growth of particular precipitates and dissolution of the other precipitates [1].
3.2.1. Algorithm for the Formation of Microvoids
The model describing the defect dynamics in a crystal involves the kinetics of Frenkel reactions, nucleation of point defects, growth of clusters, and point defect balance [21]. The mutual annihilation and the formation of pairs of point defects over the entire volume of the crystal are considered in the kinetics of Frenkel reactions. A series of bimolecular reactions is considered in the section of nucleation of point defects. The motion of complexes of point defects in the direction from the melt–crystal interface is considered in the section of cluster growth.
, ,
*
, , , ,
0
( )
4 ( ) ( , , ) ( , ) ( , )
i i
i i
g IV i v i e v e
t
i i i e cl i cl i cl i i
C D
C z C
V k C C C C
t z z
D C C R z t J d J z t m
π τ ξ τ τ
∂
∂
∂ = ∂ − ∂ − − −
∂ ∂ ∂
− −
∫
−(32)
, ,
*
, , , ,
0
( )
4 ( ) ( , , ) ( , ) ( , )
vi vi
v vi
g IV i v i e v e
t
v vi v e cl v cl v cl v v
C D
C z C
V k C C C C
t z z
D C C R z t J d J z t m
π τ ξ τ τ
∂
∂
∂ = ∂ − ∂ − − −
∂ ∂ ∂
− −
∫
−(33)
Here, Jcl j, is the concentration of critical clusters; a∗ is the number of monomers; Rcl is the radius of a critical cluster; b is distance from the crystallization front, J( , )ξ τ is the rate of cluster formation; kIV is the recombination factor;
c is the time of cluster formation;
t
g
z V d
τ
ξ
= −∫
τ
′, where τ′is the time between the instants of time t and τ.
concentrations are due to their diffusion (first term), convection (second term), Frenkel reactions (third term), their consumption for the existing clusters (fourth term), and the formation of new clusters (fifth term). The rate of consumption of point defects for the formation of new clusters is negligible and, subsequently, can be ignored [21].
The diffusionlimited growth rates of clusters (for any b and ) formed at the corresponding quantities d and c are described by the equations:
2 2
, ,
, ,
( , , ) 2 ( , , )
( )
cl i i cl i
i i e g i cl
R z t D R z t
C C V
t z
τ τ
ψ
∂ ∂
= − −
∂ ∂ (34)
2 2
, ,
, ,
( , , ) 2 ( , , )
( )
cl v v cl v
v v e g v cl
R z t D R z t
C C V
t z
τ τ
ψ
∂ ∂
= − −
∂ ∂ (35)
where
ψ
is the density of monomers in the cluster.The equations for the nucleation rates are represented in the form:
*
( / )
* * 1/ 2
, ,
,
( , ) [4 ( ) ] ln i (12 ) [ Fiv k Tb ]
cl i cl i i i i b i b site
i e C
J z t R m D C k T F k T e
C
π π ρ −
=
(36)
*
( / )
* * 1/ 2
, ,
,
( , ) [4 ( ) ] ln vi (12 ) [ Fv k Tb ]
cl v cl v v vi v b v b site
v e C
J z t R m D C k T F k T e
C
π π ρ −
=
(37)
where e∗ is the maximum change in the free energy.
The initial length or height of the crystal is taken to be 0. For the crystal with a finite length ℎ, the equilibrium conditions are assumed to be dominant over the entire surface, including the crystal–melt interface:
( 0) 0
h t= = (38)
,
( 0, )
i i e
C z= t =C (39)
,
( 0, )
v v e
C z= t =C (40)
,
( , )
i i e
C z=h t =C (41)
,
( , )
v v e
C z=h t =C (42)
The initial size of the steady state critical cluster is negligible as compared to the microdefect size. Consequently, the initial size of the stable cluster insignificantly affects its final size. The initial size of the stable cluster (nucleus) is calculated from the number of monomers in the critical cluster:
1/3 * , , 3 ( , ) 4 i cl i i cl m R
ξ τ
π ψ
= (43) 1/3 * , , 3 ( , ) 4 v cl v vi cl mR
ξ τ
π ψ
=
(44)
Equations (32)-(42) together with the energy balance of the hot zone control and determine the quantitative dynamics of point defects. In semiconductor industry, the crystal quality has been frequently determined from the total concentration or total density and represented by the average size of existing clusters. The total density of clusters is calculated by summation of clusters of different sizes in the current state:
, ,
0
( , )
t
cl i cl i
N =
∫
Jξ τ τ
d (45), ,
0
( , )
t
cl v cl v
N =
∫
Jξ τ τ
d (46)The average cluster radius is defined as
1/3 3 , , 0 , , , 0 ( , , ) ( , ) ( , ) t
cl i cl i
cl i avg t
cl i
R z t J d
R
J d
τ ξ τ τ
ξ τ τ
=
∫
∫
(47) 1/3 3 , , 0 , , , 0 ( , , ) ( , ) ( , ) tcl v cl v
cl v avg t
cl v
R z t J d
R
J d
τ ξ τ τ
ξ τ τ
=
∫
∫
(48)where avg stands for the average volume.
The model of point defect dynamics under consideration is onedimensional in nature, and, hence, the influence of the radial diffusion that is dominant in the vicinity of the surface of the crystal is disregarded. Therefore, the model can be applied to an axial distribution of defects in the crystal for fixed radial positions far from the surface.
The system of equations is solved using the exact space– time discretization. The algorithm involves the solution to the
equation V dh
dt
= for the crystal growth rate with the
recombination factor in the calculation was taken to be 0
IV
k = .
An analysis of the experimental and calculated data within microvoid formation in accordance with the diffusion model of the formation of grown-in microdefects revealed the following reasons for the occurrence of microvoids in dislocation-free Si single crystals [22]:
(i) a sharp decrease in the concentration of background impurity that was not associated into impurity agglomerates (formed in the cooling range of 1685…1423K);
(ii) a large (over 80 mm) crystal diameter (in this case vacancies fail to drain from the central part of the crystal to the lateral surface);
(iii)crystals of large diameter generally contain a ring of D-microdefects which forms due to the emergence of the (111) face on the crystallization front and which depletes the region inside with impurity atoms.
3.2.2. Algorithm for the Formation of Dislocation Loops
We calculated the formation of microvoids and dislocation loops according to rigorous approximation for the point defect dynamics model subject to no recombination of intrinsic point defects at high temperatures [23]. It was proved that the process of microvoid formation has a homogeneous nature. However, the formation of dislocation loops is determined, mainly, by the deformation mechanism. This conclusion was made on the basis of a three order of magnitude discrepancy between the experimentally observed concentration of interstitial dislocation loops and their estimated value. [23]. Precipitates originate from elastic interaction between point defects. They are, initially, present in coherent, elastic and deformable state, when lattice distortions close to the precipitate-matrix boundary are not large, and one atom of the precipitate corresponds to one atom of the matrix [16]. Elastic deformations and any mechanical stress connected with them cause a transfer of excessive (deficient) substance from the precipitate or vice versa. Storage of elastic strain energy during the precipitate growth results in a loss of coherence by matrix. [24]. This leads to structural relaxation of precipitates. Structural relaxation of precipitates causes the formation of dislocation loops.
In the volume of silicon the precipitate produces a stress field caused by mismatch between the lattice parameters of precipitate
( )
a1 and surrounding matrix( )
a2 [25]. Then, the intrinsic deformation of the precipitate is defined as described bellow1 2
1
a a a
ε= − (49)
Let us consider the easiest model of a spherical precipitate
with equiaxial intrinsic deformation, i.e.
(
)
, 0 ; , , , ,
ii ij i j i j x y z
ε
∗ =ε ε
∗ = ≠ =. Elastic strain energy of a spheroidal defect rises according to the cube law as the
precipitate radius
( )
Rpr increases [25]:(
)
2 332 45 1
pr pr
E π J ε R
υ ⋅
= ⋅ ⋅ ⋅
⋅ − , (50)
where J is the shear modulus;
υ
is the Poisson's ratio. Starting from a certain critical value of the Rcrit radius, the elastic strain energy mechanism begins to work. This mechanism results in the formation of a prismatic interstitial dislocation loop. The energy criterion for such mechanism is the Einitial ≥Efinal condition, where Einitial,Efinal isconstitute elastic energy of the system with precipitate before and after relaxation.
In respect of a spherical precipitate with equiaxial intrinsic deformation, the calculation of elastic fields of the precipitate is substantially simplified. Let us assume that the intrinsic elastic strain energy of the precipitate before and after the formation of a dislocation loop of mismatch remains constant
initial final pr pr
E =E . Then, a nucleation criterion for mismatch loop can be presented as 0≥ED +EprD condition, where
D
E is energy of a dislocation loop of mismatch; EprD is
energy of precipitate-dislocation loop interaction.
For the purpose of assessment let us assume that a dislocation loop of mismatch has equatorial location on the spheroidal precipitate RD =Rpr , and intrinsic energy of a
prismatic loop is equal [26]
(
)
2
4
ln 2
2 1
D loop
J b R d
E
f
υ
⋅ ⋅ ⋅
= ⋅ −
⋅ − , (51)
where d is loop diameter; f is the radius of the core loop;
b is the magnitude of the Burgers vector.
A critical value of the precipitate radius corresponds to a value at which the loop is formed on the precipitate [27]
(
3)
ln1.088 1
crit crit
R b
R
b
α
π ν ε
= +
, (52)
where
α
is a constant contribution of the dislocation core. Formula (52) is approximate and can be used only to determine the value of Rcrit. critical radius.The dislocation loops with a radius of R>Rcrit become bigger in size at the coalescence stage, while small dislocation loops with a radius of R<Rcrit will dissolve [28, 29]. The growth of dislocation loop in course of consequent as grown silicon crystal’ cooling occurs both due to the dissolution of small loops with the sizes less than critical, and the oversaturation of silicon self-interstitials. In this case, the
crystal growth ratio is g crit
a
V
C
G < . When oversaturation of
vacancies ( g crit
a
V
C
G > ) occurs, the interstitial dislocation
dislocation loop can be defined by the formula depending on the crystal cooling time [29]:
2
( ) crit ( )
R t = R + ⋅j D t ⋅t, (53)
where D t( ) is the diffusion coefficient of intrinsic interstitial silicon atoms; t is the time cooling the crystal; j is the proportionality factor. The crystal cooling time value is
defined from the dependence:
2
( ) m
m T T t
T U t
=
+ ⋅ , where Tm is
the crystallization temperature (melting) of silicon;
g a
U =V ⋅G is the cooling rate of the crystal.
Let us assume that the formation of dislocation loops is defined only by deformation mechanism. Then, a concentration of dislocation loops during the crystal cooling shall be considered as the concentration function of precipitates. We have shown earlier that at the stage of growth and coalescence of precipitates their concentration is the function of the crystal cooling time [18]. Then, the loop concentration depends on the crystal cooling time [29]:
2 ( ) ( )
1 ( ) 2 crit
M t N t
D t t R
=
+ ⋅ ⋅ , (54)
where M t( ) is the concentration of precipitates.
For all of calculations
2
m
m g a
T T
T V G t
=
+ , where Tm is the
melting temperature; a1= 0,768 nm (SiO2), a1= 0,4359 nm (SiC),
υ
= 0,333, k=8, 6153 10⋅ −5eV K/ , b=0, 384nm, a2= 0,5431 nm, f = 0,96 nm, D 0.19497 exp 0.9
( )
eVkT
= ⋅ −
сm2/s. The intrinsic deformations of precipitates defined through the mismatch parameters of silicon and precipitates lattices are
2
SiO
ε = 0,293, εSiC= -0,246. Elastic strain energy relaxation by precipitate results in occurrence of one or more dislocation loops [25]. The critical radiuses of precipitates which are energy favorable to the nucleation of dislocation loop shall be Rcrit= 3,028 µm (SiO2) and Rcrit= 3,402 µm
(SiC).
The process of interaction of intrinsic point defects with impurities begins near the crystallization front. It is decisive in the formation of the defect structure of highly perfect dislocation-free single crystals of silicon during their growth. During the cooling of the crystal, depending on the thermal growth conditions, the impurity atoms die to form precipitates. Conditions are created for exceeding the equilibrium values of the concentrations of intrinsic point defects. This process leads to the formation of microvoids or
interstitial dislocation loops in different regions of the crystal.
4. Unified Algorithm for the Formation
of the Original Defect Structure
A unified algorithm for the formation of defect structure is based on the diffusion model for the formation and transformation of grown-in microdefects. The diffusion model fully describes the kinetics of the diffusion decay of supersaturated solid solutions of point defects during the cooling of the crystal after growing. All parameters of precipitates, microvoids and dislocation loops are determined through thermal parameters of crystal growth. Determination of the type of defects and calculation of the formation of grown-in microdefects is performed depending on the value of crystal growth rate, temperature gradients and cooling rate of the crystal [3].
Using a parabolic distribution of the axial temperature gradient, it is possible to calculate the defect structure at any point of the crystal. The parabolic radial distribution of the axial temperature gradient has the form
./0 = + . h− }.j/ k0
'
where h is the axial temperature gradient at the crystal edge;
jk is the crystal radius and / is the current coordinate in the range of 0 … jk. The dependence of the critical growth rate on the crystal radius is plotted proceeding from the relation ^mn_o. 0
p. 0 = q . The condition ^mn_o. 0
p. 0 = q in real crystals corresponds to a -shaped distribution of D-microdefects in a plane parallel to the growth axis or an annular distribution of D-microdefects in a plane perpendicular to the growth direction [30]. It is accepted to relate the condition ^mn_o. 0
p. 0 =
q to the so-called oxidation-induced stacking fault (OSF) ring, which is observed in crystals after thermal treatments [1].
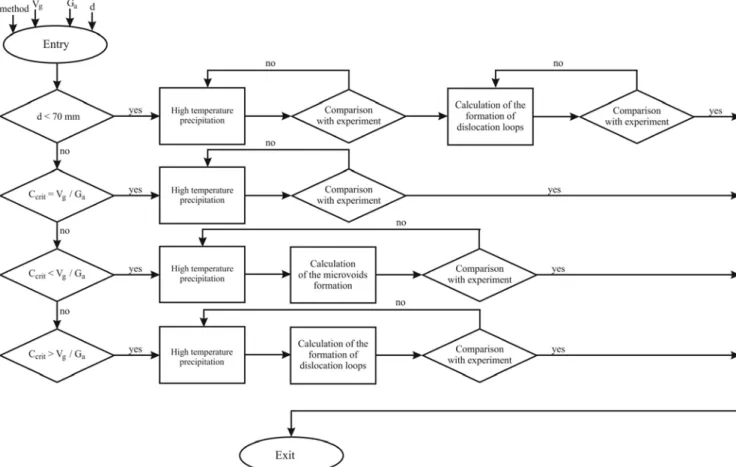
Figure 1. Algorithm for calculating the defect structure of semiconductor silicon.
EDB are supplied to input module of the algorithm for the calculation of the defect structure in high-temperature precipitation model.
Computation of precipitates is carried out within the framework of probabilistic and classical theories of nucleation, growth and coalescence of precipitates using analytical and approximate calculations. Parameters characterizing the processes of precipitation of oxygen and carbon are determined. Among them, for example, are the critical radii of precipitates, the size distribution of precipitates, the change in the average size of the precipitates during crystal cooling, and others. Accounting for other impurities is carried out in the form of carbon and oxygen components of the calculation. For example, the sum of the concentrations of impurities of carbon, boron, aluminum and hydrogen form the carbon component of the calculation. Similarly, the sum of the concentrations of impurities of oxygen, gallium, phosphorus, antimony, arsenic, germanium, nitrogen and iron form the oxygen component of the calculation.
Next are the calculation and analysis of the formation of the secondary defect structure of crystals (for example, dislocation loops, microvoids, etc.). The results of calculations are compared with the EDB data. In the case of good agreement with the EDB data, the results of calculations can serve as the characteristics of the initial defect structure of crystal and used for the calculation and analysis of the defect structure of the crystal after different
heat treatments. If a satisfactory agreement is not achieved, the calculations are repeated again until the results are obtained with a desired accuracy. In the process, the mathematical models and (or) experimental data from EDB can be refined.
In the calculation of microvoids, a check is first made to determine the conditions for their formation. так как This is due to the fact that microvoids are not formed at a cooling rate of the crystal ≥ 40 K/min [31] and in crystals with a diameter less than 70 mm [22]. Calculation of microvoids and dislocation loops makes it possible to determine for each of these types of defects such parameters as the critical radius, concentrations and sizes.
The algorithm makes it possible to develop software for the analysis and calculation of the defect structure of silicon. The output of information can be done in tabular, graphical and animation forms.
5. Conclusion
original physical model is verified by carrying out computational experiments and their comparison with the results of physical studies.
The advantage of calculating the formation and growth of precipitates, microvoids and dislocation loops is that the input and control parameters of the computational and graphical part are the growth parameters: the rate of crystal growth and the axial temperature gradient. The axial temperature gradient is chosen in a certain range of values depending on the diameter of the grown crystal. Of the three growth parameters, the two parameters are strictly defined (the diameter of the crystal and the rate of its growth), and the axial temperature gradient is specified in a certain range of values.
In this paper, we proposed an algorithm for the calculation and analysis of a defect structure of crystals and presented the schematic diagram of this algorithm. Based on the schematic diagram, it is possible to develop a software product for analysis and calculation of a defect crystal structure.
References
[1] Talanin, V. I. and Talanin, I. E. (2006). Formation of grown-in microdefects in dislocation-free silicon monocrystals. In: New research on semiconductors. New York, Nova Science Publishers, Inc., pp. 31-67.
[2] Talanin, V. I. and Talanin, I. E. (2012). The diffusion model of grown-in microdefects formation during crystallization of dislocation-free silicon single crystals. In: Advances in crystallization processes. Rijeka, INTECH Publ., 2012, p. 611-632.
[3] Talanin, V. I. and Talanin, I. E. (2016). Diffusion model of the formation of growth microdefects: a new approach to defect formation in crystals (review). Phys. of the Solid State, 58, p. 427-437.
[4] Petroff, P. M. and Kock de, A. J. R. (1975). Characterization of swirl defects in floating-zone silicon crystals. J. Cryst. Growth, 30, pp. 117-124.
[5] Itsumi, M. (2002). Octahedral void defects in Czochralski silicon. J. Cryst. Growth, 237-239, pp. 1773-1778.
[6] Voronkov, V. V. (1982). Mechanism of swirl defects formation in silicon. J. Cryst. Growth, 59, pp. 625-642.
[7] Talanin, V. I. and Talanin, I. E. (2016). Complex formation in semiconductor silicon within the framework of the Vlasov model of a solid body. Phys. of the Solid State, 58, p. 2050-2054.
[8] Talanin, V. I., Talanin, I. E. and Voronin, A. A. (2007). About formation of grown-in microdefects in dislocation-free silicon single crystals. Can. J. Phys., 85, pp. 1459-1471.
[9] Bulyarskii, S. V. and Fistul’, V. I. (1997). Thermodynamics and kinetics of interacting defects in semiconductors. Nauka, Moscow, 352 p. [in Russian].
[10] Talanin, V. I. and Talanin, I. E. (2008). Modeling of the defect structure in dislocation-free silicon single crystals. Crystallography Reports, 53, pp. 1124-1132.
[11] Talanin, V. I. and Talanin, I. E. (2010). Kinetics of high-temperature precipitation in dislocation-free silicon single crystals. Phys. of the Solid State, 52, pp. 2063-2069.
[12] Vanhellemont, J. (1995). Diffusion limited oxygen precipitation in silicon: precipitate growth kinetics and phase formation. J. Appl. Phys., 78, pp. 4297-4299.
[13] Voronkov, V. V. and Falster, R. (2002). Nucleation of oxide precipitates in vacancy containing silicon. J. Appl. Phys., 91, pp. 5802-5810.
[14] Vlasov, A A. (1945). On the theory of the solid state. Journal of Physics, 9, pp. 130-139.
[15] Vlasov, A A. (1970) Thread-like and plate-like structures in crystals and liquids. Theoretical and Mathematical Physics, 5, pp. 1228-1241.
[16] Mattoni, A., Ippolito, M. and Colombo L. (2007). Atomistic modeling of brittleness in covalent materials. Phys. Rev. B, 76, pp. 224103-224111.
[17] Magomedov, M. N. (2006). The calculation of the parameters of the Mie-Lennard-Jones potential. High Temperature, 44, pp. 513-529.
[18] Talanin, V. I. and Talanin, I. E. (2011). Kinetic model of growth and coalescence of oxygen and carbon precipitates during cooling of as-grown silicon crystals. Phys. of the Solid State, 53, pp. 119-126.
[19] Kampen van, N. G. (2007). Stochastic processes in physics and chemistry. North Holland, Amsterdam, 464 p.
[20] Slesov, V. V. and Sagalovich, V. V. (1987). Diffusive decomposition of solid solutions. Sov. Phys. Usp., 30, pp. 23–45. [21] Kulkarni, M. S., Voronkov, V. V. and Falster, R. (2004).
Quantification of defect dynamics in unsteady-state and steady-state Czochralski growth of monocrystalline silicon. J. Electrochem. Soc., 151, pp. G663-G669.
[22] Talanin, V. I. and Talanin, I. E. (2010). Modeling of defect formation processes in dislocation-free silicon single crystals. Crystallography Reports, 55, pp. 632-637.
[23] Talanin, V. I. and Talanin, I. E. (2010). Kinetics of formation of vacancy microvoids and interstitial dislocation loops in dislocation-free silicon single crystals. Phys. of the Solid State, 52, pp. 1880-1886.
[24] Talanin, V. I. and Talanin, I. E. (2012). A kinetic model of the formation and growth of interstitial dislocation loops in dislocation-free silicon single crystals. J. Cryst. Growth, 346, pp. 45-49.
[25] Kolesnikova, A. L., Romanov, A. E. and Chaldyshev, V. V. (2007). Elastic-energy relaxation in heterostructures with strained nanoinclusions. Phys. of the Solid State, 49, pp. 667-674. [26] Bert, N. A., Kolesnikova, A. L., Romanov A. E. and
Chaldyshev, V. V. (2002). Elastic behavior of a spherical inclusion with a given uniaxial dilatation. Phys. of the Solid State, 44, pp. 2240-2250.
[28] Bonafos, C., Mathiot, D. and Claverie A. (1998). Ostwald ripening of end-of-range defects in silicon. J. Applied Phys., 83, pp. 3008-3018.
[29] Burton, B. and Speight M. V. (1985). The coarsening and annihilation kinetics of dislocation loops. Philosophical Magazine A, 53, pp. 385-402.
[30] Talanin, V. I., Talanin, I. E. and Ustimenko N. Ph. (2011). A new method for research of grown-in microdefects in dislocation-free silicon single crystals. Science and Technology, 1, pp. 13-17.