Study of the Information Sources Features and its Effect on Managers' Environmental Scanning Behavior
Zeinab Bahmani
Department of Information Management, Faculty of Humanities, Ahvaz Branch, Islamic Azad University, Ahvaz, Iran E-mail: [email protected]
Mohammad Reza Farhadpoor Department of Information Management, Ahvaz
Branch, Islamic Azad University, Ahvaz, Iran Corresponding Author:
[email protected] Mohsen Hamidi
Department of Information Management, College of Humanities, Islamic Azad University of Burujerd, Burujerd, Iran
Abstract
The purpose of the present study is to identify the features of information sources and its influence on
managers' environmental scanning behavior in second industrial area of Ahvaz. An
analytical survey method is used to analyze the relationship between variables. The findings showed that from among 16 information sources, managers used subordinate staff (M=3.37) more than other sources for environmental scanning. Also they revealed that work experts had the greatest quality and richness with means of (M=3.81) and (M=3.69), respectively; and that subordinate staff (M=3.58) were the most accessible information sources. In addition, the personal information sources within the organization, compared to impersonal sources out of the organization were more qualified, accessible and rich. Executives used managers or assistants' (M=3.73) as information sources more frequently than other information sources in environmental scanning. Furthermore the results of testing hypotheses showed that there was a significant relationship between perceived accessibility, quality, and richness of the source from the view point of managers and the frequency with which managers used it for environmental scanning.
Keywords: Company Managers, Second Industrial Area, Ahvaz, External Environment, Environmental Scanning, Information Sources, Perceived Accessibility, Perceived Quality, Perceived Richness.
Introduction and Statement of the problem
managers use to know external environment of their organization and match with external environment.
Nickole (cited in Ojo, 2008) defines environmental scanning as activities to gain information about external environment of organization and knowledge that assists managers/executives to do decision making about future activities of the organization. Also, Hagen, Haile and Maghrabi (2003) state that "environment analysis" refers to receiving signals from larger (external) environment, and following and detecting relevant to most of the signals. Choo (1999) believes that environmental scanning is acquisition and use of relevant information to events, procedures, and relationships in the external environment of an organization, and is the knowledge that helps a manager to plan for the future activities of the organization (Ojo, 2008). Fahey and Narayanan (1986) explain external environment of an organization as their scanning of environment to identify patterns and procedures of change, monitor patterns and particular procedures, predict the future path of changes and patterns and evaluate their organizational effects (Longton, 2005).
Considering the fast changes of external section of organizations in the world today, which effects the top managers' decisions about the future of organizations, it is important that managers collect information related to external environment and take into account while making decisions in order to make a correct, reliable and low-risk decision. Information related to external environment events are published and issued in a vast spectrum of information sources, but connecting to all these sources and gaining information from them is impossible. Lester and Kohler (2003), while emphasizing the importance of information in human life, defines "information environment" as a new ecology which certainly and completely has surrounded our life place as big as the ecosystem and is developing constantly to absorb new information sources, and new informing activities. Nardi and O'Day (1999) defines information ecology as a system of individuals, activities, values, and technologies in a special environment in which the focus is on human activities based on technology not the technology, whose interaction and deep dependence among elements is obvious just like a biological ecosystem.
An information environment provides a conceptual framework for analyzing data, creating knowledge, and the stream of data in a multidimensional context (Baker and Bowker, 2007). Important events originating from external environment of every organization flows in the framework of valuable information in channels and various information sources based on type and form, and operate as signals that potentially can effect process and change managers' decision making direction. Using information sources maybe influenced by many factors, and the intensity of this influence may be different for different people and different sources. Low and Mohr (2001), based on previous research on organizational decision-making and accounting fields, emphasizes that managers' perception and use of information, remarkably depends on information sources, and even differences among sources or various possible information can influence marketing managers' use of information, and finally, enumerate formality or informality of information and the type of decision to be made as the effective factors to encourage the spread and use of information.
proved because of the developments in information technology and telecommunication that provides various channels and applications for accessing, processing and distributing of information; information literacy skills as information intensive process are require to conduct effective and efficient environmental scanning activities (2010). Also, they found that the frequency of collecting and organizing information is positively correlated with perceived strategic uncertainty, and the information literacy skills for conducting all steps of environmental scanning are more important (2012).In another study, Chen (2013) examined strategic government-information scanning form china’s government officials’ perspective and showed that TV, government officials/party members, newspapers, and government websites were the most important information sources. Also, information from individual sources was perceived differently in six quality aspects. Haase and Franco (2011) studied the impact of industry sector and firm size on the use of external information sources and showed that the range of frequently used external information sources (both personal and impersonal) is relatively limited. Rasooli (2013) explored managers' environmental scanning behavior in private electronic publications of Tehran and showed that customers were the most important information source. Subordinate managers possessed the greatest importance and reliability. Also the findings illustrated that there was a significant relationship between perceived accessibility and perceived quality from an information source and the frequency with which it was used to scan the environment.
decisions and performing routine tasks. Pieterson, Teerling and Ebbers (2008) studied media richness based on perception and use of channel (source): the top factors of media richness showed that media stations and library sources had higher perceived richness, respectively, and electronic information services had lower perceived richness. Also Wright, Schwager and Donthu's study (2008) on media richness based on the use of media richness theory for collecting information showed that there was a great reliance on electronic data collection tools. Conway's study (2009) led to a step by step guide for environmental scanning and stated that the following source domain can be used for environmental scanning: newspapers, web sites, web logs, wikis, library information sources, podcasts, films, news sites, newsletters, magazines, books, book reviews, lectures, reports, surveys, supervisors, associations meetings, advertisements, philosophers, sociologists, business management interviews, seminars, chat rooms, research reports, and universities. Elchi (2009) by exploring identification of open innovations, an environmental scanning perspective, proved that there was strong tie between 2 variables and other items such as attraction capacity, threshold level, and value chain. Results illustrated the framework of procedure flow, items and inclinations of 3 different approaches of change/innovation, which can be applied as an important functional management tool. The process model reflects how organizations' environmental scanning activities affect open change/innovation activities. Babutunde and Adebisi (2012) did a research on strategic environmental scanning and organizational performance in a competitive business environment and showed that there is a significant relationship between strategic environmental scanning and organizational performance and that the instability and change of effective and efficient performance is due to change diversity in strategic environmental scanning. Also the findings proved that the change of productivity and efficiency of an organization is as a result of change in external environmental factors, which indicates the external environmental powers of an organization have positive effect on organizations' performance. Babalhavaeji and Farhadpoor's study (2013) on information source characteristics and environmental scanning by academic library managers showed that they used a combination of information sources (personal/impersonal, internal/external) to do scanning, and among different information sources addressees, users, library sources, electronic information services, and subordinate staff were used more than others. Library information sources, internal report and studies, accessible information services, electronic information sources, addressees and users were perceived to have great quality.
of communication technologies in various studies (Atchariyachanvanich, Okada, and Sonehara, 2009; and Caldwell and Uang, 1994).
Choo and Ethel (1993) defines perceived accessibility of source as "the amount of time and effort needed to acquire, connect to, or spot a source" and "convenience of providing appropriate information from a source"; he believes that the quality of information include relevance and validity. O'Reilly (1982) considers relevance, besides correctness, validity and up-to-datedness, an important dimension of perceived quality. Taylor (1986) believes that the quality of a source indicates the sum of values of that source. According to Brunelle and Lapierre (2007) information richness refers to the ability of a medium to transfer special types of information and the capacity of media for instant feedback and it includes senses and language diversity. These 3 important features of information sources were investigated in the present study as the factors that can affect the environmental scanning behavior and use of information by managers.
Research Purposes, Questions and Hypotheses:
The following questions and hypotheses were posed with the purpose of knowing effective features of information sources on managers' environmental scanning behavior in companies of second industrial area of Ahvaz in order to identify the sources most frequently used by managers for environmental scanning:
Q1:What information sources were used by company managers for environmental scanning in this study?
Q2:What factors influence use of information sources for environmental scanning?
Hypothesis 1: Perceived quality, accessibility and richness of information source have positive and meaningful correlation with the frequency with which it is used in environmental scanning by managers.
Research Method and Instruments:
The present research was an analytical survey. The population included managers of 60 active companies in second industrial area of Ahvaz (21 metallic and 39 nonmetallic). The instrument used for data collection was a researcher-made questionnaire whose items were prepared based on previous research questionnaires and its validity was determined formally. Also the reliability was calculated to be (r=0.918) by Cronbach's α coefficient. Then the questionnaire was given in person to the managers in the study of which 48 (return rate= 80%) were returned. After collecting data, they were analyzed using SPSS software.
Findings
Question 1: What information sources were used by company managers for environmental scanning in this study?
They were supposed to answer by selecting one of the following items: never, less than once a year, several times a year, at least once a week, and at least once a day.
Table 1
Information Sources Used by Managers in Environmental Scanning
Information Sources Mean of Use Standard Deviation
Customers 3.35 0.887
Competitors 3.22 0.778
Work experts 3.22 0.857
Official Staff 2.83 0.883
Periodicals and Newspapers 2.67 1.017
Governmental Publications and Reports 2.6 1.046
Radio, Television 3.06 1.261
Trade Associations 2.73 0.869
Conferences and Visits 2.42 0.986
Counselors and Members of Subordinate
committees 2.38 0.913
Subordinate Managers or Assistants 3.27 1.105
Subordinate Staff 3.37 0.936
Internal Regulations and Directives 2.69 0.992
Internal Reports and Research Projects 2.56 0.848
Library Sources 2.46 1.051
Electrical Information Services 3.18 1.249
The results of table 1 show that subordinate staff with (M=3.37), customers with (M=3.35), subordinate managers or assistants with (M=3.27), competitors with (M=3.22), and work exports with (M=3.22), respectively were used more than other sources by managers for environmental scanning, and from this point of view conferences and visits with (M=2.42) and, counselors and members of subordinate committees with (M=2.38) were used less in environmental scanning by managers.
Table 2
Frequency Distribution and One-tailed t-test Results for Information Resources Used by Managers for Environmental Scanning
Theoretical Mean = 3
T N
D
egr
ee
of
F
ree
d
om
(df
)
Signi
fi
ca
nc
e Lev
el
Sig.) Mean SD SEM
Me
an D
if
fer
enc
es Confidence Interval
Lower than
Higher than
Information
Table 2 indicates that the mean of use rate from information sources by managers for environmental scanning equals 2.88, which means that managers generally used information sources less than once a year for environmental scanning. Also, the obtained t-value at (α=0.05) is -1.423 which is lower than critical t, means that the difference between calculated mean and theoretical mean is not significant. Therefore, it is concluded that with 95% confidence, the total use rate of managers from information source for environmental scanning in the companies studied was not at an acceptable level.
Question 2: What factors influence use of information sources in environmental scanning? With the purpose of defining effective factors on use of information sources by managers; the factors influencing the use of an information source in 3 fields of perceived quality, accessibility and richness were chosen, and in the framework of 6 items were included in the questionnaire to convey managers' view point about quality, accessibility and richness of information sources. Sixteen sources were identified according to previous researches' classifications. The 6 questions were developed in this way for the 16 sources as:
Perceived Quality of Information Source (PQIS):
a) How relevant is the information in each source to the environment? b) How reliable is the information in each source about the environment?
The managers were required to select one of the choices: (completely irrelevant, to some extent irrelevant, rather relevant, relevant, and completely relevant) to answer question (a). And in order to answer question (b) they were asked to select one of the following choices: completely unreliable, to some extent unreliable, rather reliable, reliable, and completely reliable.
Perceived Accessibility of the Information Source (PAIS):
In order to evaluate the perceived accessibility, the following items were included in the questionnaire:
a) How much time and effort do you need to centralize and spot information in each source?
b) How easy is it to acquire information needed from that source?
The managers were required to answer question (a) by using one of the following choices: very little, little, to some extent, much, and very much. They were also asked to answer the second question, (b), by selecting items such very difficult, difficult, not easy not difficult, easy, and very easy.
Perceived Richness of the Information Source (PRIS):
Two questions were included in the questionnaire to evaluate perceived richness: a) Which of the following information sources has more up-to-date information? b) Information of which source was available for you directly and interactively?
PQIS, PAIS and PRIS the answers for 6 questions were summed up and the mean was estimated (Table 3).
Table 3
Perceived Quality, Accessibility and Richness of Information Sources by Managers
Information Sources
Perceived Quality of Information Sources(PQIS)
Perceived Accessibility of Information Sources(PAIS)
Perceived Richness of Information Source (PRIS)
Relevance Reliability
PQ IS Am o u n t o f E ff o rt f o r lo ca tin g So u rce s E ase o f Acq u ir in g In fo rm atio n PA IS Up -to -d ated n ess B ein g In ter ac tiv e an d Dir ec t PR IS
M SD M SD M SD M SD M SD M SD
Customers 3.58 0.963 3.08 0.794 6.66 2.69 0.879 3.2 0.898 5.89 3.19 1.065 3.5 0.989 6.69 Competitors 3.48 0.85 2.54 0.742 6.02 2.56 0.848 2.62 1.064 5.18 3.02 0.956 2.63 1.064 5.65 Work experts 3.81 0.891 3.56 0.741 7.37 2.7 0.874 3.04 0.77 5.74 3.69 0.83 3.38 0.866 7.07 Official Staff 3.35 0.978 3.41 0.941 6.76 2.56 0.965 2.85 0.989 5.41 3.16 1.154 2.63 0.815 5.79 Periodicals and
Newspapers 2.77 0.805 2.88 0.96 5.65 3.06 0.976 3.16 1.017 6.22 3.04 1.184 2.88 1.002 5.92 Governmental
Publications and Reports
2.73 1.066 2.92 0.963 5.65 2.89 0.95 3.08 0.919 5.97 2.93 1.174 2.77 0.973 5.7
Radio, TV. 2.75 1.12 2.85 0.945 5.6 3.27 0.983 3.37 1.084 6.64 3.14 1.271 3 1.149 6.14 Trade
Associations 3.46 1.071 3.38 0.89 6.84 3.16 1.078 3.31 0.854 6.47 3.31 1.113 3.21 1.091 6.52 Conferences and
Visits 2.94 0.998 3.04 1.051 5.98 2.64 1.041 2.79 1.051 5.43 3.19 1.024 2.69 0.971 5.88 Counselors and
Members of Subordinate committees
3.15 0.875 3.02 0.933 6.17 2.77 0.972 2.91 0.895 5.68 3.19 0.982 2.92 0.942 6.11
Subordinate Managers or Assistants
3.5 1.031 3.52 0.771 7.02 3.46 1.11 3.77 0.972 7.23 3.42 0.964 3.94 0.885 7.36
Subordinate Staff 3.52 0.989 3.42 0.767 6.94 3.58 1.107 3.91 0.963 7.49 3.21 1.051 3.92 0.964 7.13 Internal
Regulations and Directives
2.9 0.994 3 0.899 5.9 3.04 1.009 3.14 1.051 6.18 2.88 0.959 3.02 0.978 5.9
Internal Reports and Research
Projects
2.9 0.994 3.04 1.03 5.94 3.08 1.126 3.06 0.998 6.14 2.96 0.922 3.08 1.069 6.04
Library Sources 2.81 1.044 3.1 1.015 5.91 2.75 1.061 3.06 1.137 5.81 2.96 1.11 2.88 0.937 5.84 Electrical
Information Services
3.31 1.151 2.98 0.999 6.29 2.87 0.981 3.43 1.049 6.3 3.54 1.009 3.25 1.062 6.79
point of managers, and radio and television (M=2.75) and governmental publications and reports respectively were in lower ranks based on the relevance of their information to the environment. Based on the reliability of information of each source about external environment, work experts' information (M=3.56), subordinate managers or assistants (M=3.52), subordinate staff (M=3.42), official staff (M=3.41) were more reliable information source according to managers, and based on this aspect radio and television (M=2.85) and competitors (M=2.52) were less reliable. The results of the column dedicated to PQIS in table 4 show that work experts (M=7.37) from the viewpoint of respondents were identified to have the greatest quality based on having relevant and reliable information, and radio and television (M=5.6) was in a lower rank.
Results for accessibility show that based on the amount of effort for locating of source, subordinate staff (M=3.58), subordinate managers or assistants (M=3.46), radio and television (M=3.27), trade associations (M=3.16) needed little effort and official staff (M=2.56) and competitors (M=2.56) were in lower ranks. Based on the ease of acquiring information from each source, subordinate staff (M=3.91), subordinate managers or assistants (M=3.77), electronic information services (M=3.43), radio and television (M=3.37) and trade associations (M=3.31) were in higher ranks, while conferences and visits (M=2.79) and competitors (M=2.62) were in lower ranks. Finally, the PAIS with the sum of average effort for locating source and the amount of ease of accessing information from each source was calculated. The results show that subordinate staff (M=7.49), subordinate managers or assistants (M=7.23), radio and television (M=6.64) and trade associations (M=6.47) were in higher ranks compared to other 16 sources based on accessibility as perceived by managers, and official staff (M=5.41), competitors (M=5.18) were ranked lower.
For richness, results of data show that work experts (M=3.69), electronic information services (M=3.54), subordinate managers or assistants (M=3.42), and trade associations were in higher ranks based on up-to-datedness while governmental publications and reports (M=2.93), and internal regulations and directives (M=2.88) were in lower ranks. Also, based on being interactive and direct, the results prove that subordinate managers and assistants (M=3.94), subordinate staff (M=3.92), customers (M=3.5) and work experts (M=3.38) were in higher ranks while conferences and visits (M=2.69), competitors (M=2.63) and official staff (M=2.63) were in lower ranks. Perceived richness was calculated using sum of means for up-to-datedness, and being interactive and direct. The results show that subordinate managers or assistants (M=7.36), subordinate staff (M=7.13), work experts (M=7.07) and electronic information services (M=6.79) were ranked higher, while library sources (M=5.84), official staff (M=5.79) and competitors (M=5.65) were in lower ranks.
Table 4
Mean of PQIS, PAIS and PRIS Based on Internal/External and Personal/Impersonal Sources of organization
Impersonal sources Personal Sources
M(PQIS) = 6.31 M(PAIS) = 5.86 M(PRIS) = 6.19 Periodicals and Newspapers,
Governmental Publications and Reports, Media Stations, Trade Associations, Conferences and
Visits Customers, Competitors,
Work experts, Official Staff,
External Sources of Organization
M(PQIS) = 6.44 M(PAIS) = 6.46 M(PRIS) = 6.51 Counselors and Members of
Subordinate committees, Subordinate Managers or Assistants, Subordinate Staff Internal Regulations and
Directives, Internal Reports and Research Projects, Library Sources, Electrical
Information Services Internal
Sources of Organization
M(PQIS) = 5.97 M(PAIS) = 6.13 M(PRIS) = 6.11 M(PQIS) = 6.78
M(PAIS) = 6.18 M(PRIS) = 6.4
For PQIS, PAIS and PRIS the results show that internal sources of organization (M=6.44, 6.46 & 6.51) compared to external sources (M=6.31, 5.86 & 6.19) were perceived to have the greatest quality, accessibility and richness. On the other hand, personal sources (M=6.78, 6.18 & 6.4) compared to impersonal sources (M=5.97, 6.13 & 6.11) had greater quality, accessibility and richness according to managers.
Table 5
Frequency Distribution and One-tailed t-test Results for Factors Affecting Use of Information Sources in Environmental Scanning by Managers
Theoretical Mean = 3
Factors T N
Deg ree o f Fre ed o m ( d f) Sig n if ican ce L ev el (Sig .)
Mean SD SEM Me
an
Dif
fer
en
ce
s Confidence Interval
Lower than Higher than
Perceived Quality of Sources
1.98 48 47 0.053 3.15 0.514 0.074 0.147 -0.002 0.296
Perceived
Accessibility 0.79 48 47 0.432 3.06 0.518 0.075 0.059 -0.091 0.209
Perceived
Richness 1.81 48 47 0.077 3.14 0.593 0.078 0140 -0.015 0.297
between the calculated mean and the theoretical mean (3) based on the effective factor on use of information source for environmental scanning.
Hypothesis 1: Perceived quality, accessibility and richness of information source have positive and meaningful correlation with the frequency with which it is used in environmental scanning by managers.
Perceived quality, accessibility and richness of an information source were calculated based on following explanations, the second research question and content of table 1. In order to estimate the frequency with which managers use an information source for environmental scanning, they were required to answer the question below: "How many times you used the following information sources for environmental scanning?" They were supposed to select one of these choices: never, less than once a year, several times a year, at least once a week, and at least once a day.
Table 6
Frequency with Which Managers Use Information Sources for Environmental Scanning
Information Sources M SD
Customers 3.44 0.92
Competitors 3.17 0.93
Work experts 3.69 0.776
Official Staff 3.29 0.967
Periodicals and Newspapers 2.89 0.831
Governmental Publications and Reports 2.94 0.977
Radio, Television 3.02 0.786
Trade Associations 3.02 0.945
Conferences and Visits 2.88 1.002
Counselors and Members of Subordinate committees 3.27 1.026
Subordinate Managers or Assistants 3.73 0.791
Subordinate Staff 3.5 0.989
Internal Regulations and Directives 2.96 0.874
Internal Reports and Research Projects 2.81 1.044
Library Sources 2.73 1.005
Electrical Information Services 3.15 1.148
Table 7
Results of Pearson's Correlation Coefficient for the Relationship between Perceived, Quality, Accessibility and Richness by Managers from Information Sources and the Frequency with which They Are Use for Environmental Scanning
Frequency of the Use of Source 0.752
Pearson's Correlation Coefficient Perceived
Quality Sig. (p-value) 0.000
48 Number
0.431 Pearson's Correlation Coefficient
Perceived
Accessibility Sig. (p-value) 0.002
48 Number
0.515 Pearson's Correlation Coefficient
Perceived
Richness Sig (p-value) 0.000
48 Number
According to the results of the table 7, Pearson's Correlation Coefficient, (r) are equal 0.752, 0.431 and 0.515 ,with p-value ≥ 0.05.Therefore, there is a positive and meaningful relationship between managers' perceived quality, accessibility and richness of information sources and the frequency with which that source is used for environmental scanning. Also results indicate that the correlation rate of perceived quality of information sources in compared with 2 other factors is rather stronger.
Results
although useful information may be scattered in other sources, too, access tools and even the ability to interact with those sources and acquire information from them can be difficult for managers.
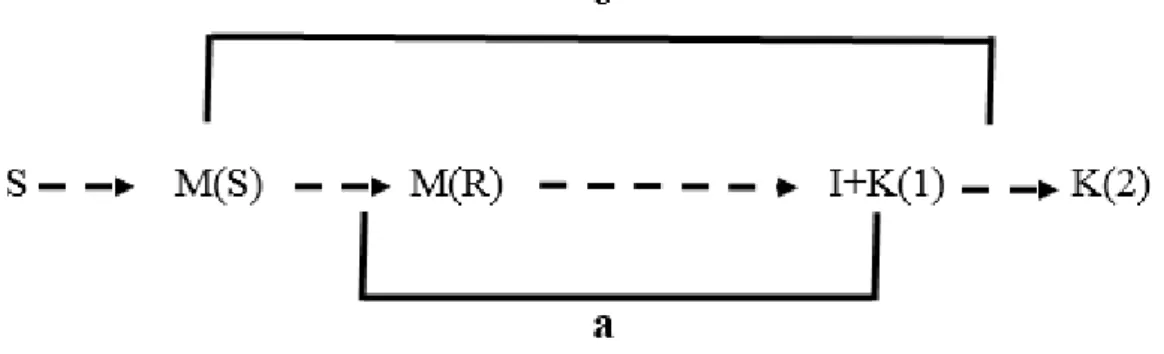
The third issue is managers' information literacy, i.e. their ability to recognize need, identify source of information, the ability to locate information source, and the ability to receive and use information sources which can be effective factors. Forth, when individuals receive information, they can combine it with their previous knowledge and experience and the result is new knowledge experience that is debatable in the framework of Vickery's information transfer pattern (figure 1).
Figure 1. Vickery's information transfer pattern (from Lester and Kohler, 2003)
than impersonal information sources, also personal internal information sources had greater quality compared with personal external information sources of the organization. In previous studies conducted on communication (Choo and Ethel, 1993) internal information sources; and academic libraries (Babalhavaeji and Farhadpoor, 2013), external information sources had better quality. Therefore, it is concluded that managers in the second industrial area of Ahvaz perceived oral personal sources more relevant and reliable than other sources; because individuals who are active in the companies or are related to company activities can provide more relevant and reliable to the managers about external environment which affects their decision-making. Also the results showed that subordinate staff, subordinate managers and assistants, radio and television and trade associations were perceived more accessible by managers than other sources. Of the 4 information sources used more frequently, 2 sources (subordinate staff, subordinate managers and assistants) were personal internal sources and 2 sources (radio and television and trade associations) were impersonal external sources of organization. Results of previous studies on communication, (Choo and Ethel, 1993), academic libraries (Babalhavaeji and Farhadpoor, 2013), showed that library sources, internal reports and studies were in higher ranks in terms of accessibility from the view point of managers. From the other point of view, oral sources were perceived more accessible by managers. Also it is worth mentioning that subordinate staff, subordinate managers and assistants were more reliable than other sources, the reason is possibly the short time needed for locating these 2 information sources, also their information can easily be accessed.
The findings also showed that subordinate managers or assistants, subordinate staff, work experts and electronic information services had greater perceived richness than other sources. In other words 3 sources (subordinate managers or assistants, subordinate staff and work experts) were personal and 1 (electronic information services) were impersonal. Of the 3 personal sources, 2 (subordinate managers or assistants and subordinate staff) were internal and 1 (work experts) was external. In general, according to managers of the population studied, personal and oral information sources were more up-to-date, interactive and direct which can be due to the influence of features such as interaction, the ease of relationship with them, up-to-datedness of information and the possibility of receiving instant feedback from them compared to other sources. The findings of this research rejects Pieterson, Teerling and Ebbers' (2008) study and is in according with Wright, Schwager and Donthu's (2008) .
Results of testing hypothesis also proved that there was a direct and significant relationship between perceived quality of a source and the frequency with which it was used for environmental scanning by managers. In other words, the greater quality a source had according to managers, the more it was used for environmental scanning by them, which is in accordance with findings of Choo and Ethel (1993); Babalhavaeji and Farhadpoor (2013); and Rasooli (2013). Perceived quality of a source is believed to be related to the nature of senior manager's decisions. Relevance and reliability of a source are of great importance to a manager and can decrease the degree of risk for their decisions. The better quality a source perceived to have by managers, and the more relevant and reliable information it provides for managers, the more frequently it is used by them for environmental scanning. As the relevant and reliable information was more the personal ones (work experts, subordinate managers or assistants, subordinate staff, and trade associations), this justifies managers' dependence on it. The finding also revealed a direct and significant relationship between perceived richness and its frequency of use, i.e. the richer a source is perceived by managers; the more frequently it is used by managers for environmental scanning. The findings of the present study are in accordance with Pietarson's et al. (2008). The richness of a source and the direct and up-to-date information it provides to the users causes it to be used more frequently by managers for environmental scanning. For instance, the up-to-datedness of an information source surmounts a manager's anxiety about possible changes and obsolescence of information. But knowing that seniors managers need concise information and cannot spend a lot of time on acquiring information, only the sources that are able to provide information packs appropriate for their needs would be of great value for them, and the important issue to consider is that the feedback process during transfer of information between the source and target be done very fast, which helps to correct mistakes and reach to a common concept. In this research, personal internal sources perceived richer by managers and were used more frequently for environmental scanning. It can be from this point of view.
Finally, the findings showed that according to distribution of information in information environment of organizations, managers cannot use all sources simultaneously, and in this term managers' use of these sources are influenced by perceived features of the source by them. Identifying these features on one hand can help the management
f information flow in organizations, information map of organization, use of appropriate tools for managing knowledge and running information systems appropriate for managers' perception; and on the other hand, it provides a new outlook of their information behaviorism for information and informatics managers in organizations.
References
Atchariyachanvanich, K., & Okada, H., & Sonehara, N. (2009). Critical success factors of Internet shopping: The case of Japan. In J. Filipe & M. Obaidat (Eds.), E-business and Telecommunications. (pp. 98-109). Berlin: Springer.
Babutunde, B. O., & Adebisi, A. O. (2012). Strategic environmental scanning and organization performance in a competitive business environment. Economic Insights Trends and Challenges, 64(1), 24-34.
Baker, K. S., & Bowker, G. C. (2007). Information ecology: Open system environment for data, memories, and knowing. Journal of Intelligent Information Systems,29(1), 127-144. Brunelle, E., & Lapierre, J. (2007). Examining the relationship between individual characteristics, product characteristics, and media Richness fit on consumer channel preference. LNCS, 4655, 56–67.
Caldwell, B., & Uang, S. (1994). Interactions of situation, social, and technological constraints in information technology use in organizations, In G. Bradley & H. Hendrick (Eds.), Human Factors in Organizational Design and Management IV, (531-536). North Holland: Elsevier.
Chen, Y. R. (2013). Exploring environmental scanning for china’s government information: A government official’s perspective. Public Relations Review, 39, 581-583.
Choo, C. W., & Ethel, A. (1993). Scanning the business environment: Acquisition and use of information by managers. Annual Review of Information Science and Technology, 28, 279-314.
Choo, C. W. (1999). The art of scanning the environment. Bulletin of the Association for Information Science and Technology, 25 (3), 21-24.
Conway, M. (2009). Environmental scanning: What it is and how to do it? A step by step guide to setting up and running an environmental scanning process in your organization. Thinking Futures (Final Report). Retrieved from: http://thinkingfutures.net/wp-content /uploads/Doing-Environmental-Scanning-Guide-Feb-12.pdf
Culnan, M. J. (1985). The dimensions of perceived accessibility to information: Implications for the delivery of information systems and services. Journal of the American Society for Information Science, 36(5), 302-308.
Elchi, N. (2009). An exploration of open innovation: An environmental scanning perspective. PhD. Dissertation, University of Maryland.
Fahey, L., and Narayanan, V. K. (1986). Macro-environmental analysis for strategic management, west publishing, St. Paul, MN.
Haase, H., & Franco, M. (2011). Information sources for environmental scanning: Do industry and firm size matter? Management Decision, 49(9-10), 1642-1657.
Hagen, A., Haile, S., & Maghrabi, A. (2003). The impact of the type of strategy on environmental scanning activities in the banking industry: An international perspective. International Journal of Commerce and Management, 13(2), 122-143. DOI: 10.1108/eb047469.
Hosseini, A. (2010). Study of environmental scanning in the collection and use of information by managers of private publishers in Tehran [Persian]. M. A thesis. Faculty of Humanities and Social Sciences, Islamic Azad University of Tehran.
Jain, S. C. (1984). Environmental scanning in US corporation. Long Range Planning, 17, 117-128.
Lester, J. & Koehler, W. C., Jr. (2003). Fundamentals of information studies: understanding information and its environment. New York: Neal-Schuman Publishers, Inc.
Longton. A. M. (2005). The role of information management in environmental scanning and competitive intelligence- an integrated process model. PhD. thesis. University of Johannesburg, South Africa.
Low, G. S., & Mohr, J. J. (2001). Factors affecting the use of information in the evaluation of marketing communications productivity. Journal of the Academy of Marketing Science, 29(1, 70-88.
Nardi, B. A., & O’Day, V. L. (1999). Information ecologies: Using technology with heart. [M]. [S.L.]: MIT Press, 49-58.
Nkongolo-Bakenda, J. M. (2003). Environmental scanning in globally oriented small businesses: Practices suggested by managers. Journal of Comparative International Management, 6(1), 23-56.
Ojo, O. (2008). Appraisal of the impact of environmental scanning on corporate performance in selected Nigerian banks. Manager, 7, 89-100.
O'Reilly, C. A. (1982). Variation in decision-makers’ use of information sources: The impact of quality and accessibility of information. Academy of Management Journal, 25(4), 756-771.
Pearce, j., & Robinson, R. (2004). Strategic management (planning, administration, control). Translated by M. Hossein. Tehran, Iran: SAMT publications.
Pieterson, W., Teerling, M., & Ebbers, W. (2008). Channel perceptions and usage: Beyond media richness factors. Berlin Heidelberg: Springer-Verlag.
Rasooli, L. (2013). Factors influencing environmental scanning in the collection and use of information by managers of private electronic publishing of Tehran. M.A. thesis. Payam Noor university of Mashhad.
Sepahvand, R., & Arefnezhad, M. (2013). Prioritization of factors affecting the success of information systems with AHP (A case study of industries and mines organization of Isfahan province). International Journal of Applied Operational Research, 3(3), 67-77. Taylor, R. S. (1986). Value-added processes in information systems. Norwood, NJ: Ablex
Publishing Corp.
Wright, B., Schwager, P. H., & Donthu, N. (2008). Application of media richness theory to data collection. The Journal of Applied Business Research, 24(1), 137-142.
Zhang, X., Majid, Sh., & Foo, S. (2010). Environmental scanning: An application of information literacy skills at the workplace. Journal of Information Science, 36(6), 719-732.