Magyar Agrárinformatikai Szövetség
Hungarian Association of Agricultural Informatics
Agrárinformatika Folyóirat. 2010. 1. évfolyam 2. szám Journal of Agricultural Informatics. 2010 Vol. 1, No. 2
How barley growing conditions and its output change in Hungary
Aliz Novák, Éva Erdélyi
I N F O
Received 19 Oct. 2010 Accepted 24 Nov. 2010 Available on-line 30 Nov. 2010 Responsible Editor: K. Rajkai
Keywords:
climate change, indicator, production risk, winter barley
A B S T R A C T
There is no doubt that climate change has started. It is very important to make effort in developing impact analyses and adaptation strategies. First we were investigated how the production risk of winter barley is changing with time using the E,V efficiency criterion. Based on the regional yearly production data of the crop, we can conclude that beside other non-climatic effects, the changing climate has considerable impact on crops yield; its variability is increasing with the variability of meteorological parameters. We have used production data from 1951 to nowadays. Next, using comparison analyses for climate scenarios, we predict what we can expect in the future. For detecting the reasons of risk increase in the past, and forecasting the potential main points of future risk we have analysed statistically whether the climate needs of winter barley will be satisfied or not in its important periods of growing. Frequency calculations were made based on the daily meteorological data. The situation doesn’t show big change, but It is no doubt that the anomalies of the indicators have been becoming more and more frequent. The more frequent the extreme weather events are, the more we can be convinced of uncertainty.
1. Introduction
2. Materials and methods
2.1. Climate needs of winter wheat and its phases of development
Climate change impact can be very different in different phenological phases of the plant. With appropriate agrotechnical interventions we can control and avoid the negative effects of the meteorological circumstances. The most important periods of plant development were defined according to Z. Varga-Haszonits (1987): we analyzed the sowing-emergence phenological phase, the stem elongation – spikelet initiation period and the anthesis-grain filling phenological phase. The climate scenarios show great variability in the frequency of the extreme temperature values.
2.2. Climate description of the research location and the weather data
Production risk analyses have three important locations for winter barley: Győr-Moson-Sopron County, Baranya County from the middle of the country and Hajdú-Bihar County. The case studies for climate change impact analyses are presented for Debrecen region, comparing the results for different climate change scenarios. We have choosed this region, because the results are very similar to all the observed locations. This is a very important region in agricultural production and the climate scenarios for later investigations are available for this region only at the moment. Our case study showed that the sum of the temperature averages increases by time in the past and the scenarios predict even more drastic increase.
Climate scenarios can be defined as relevant and adequate patterns of the climate characteristics in the future (Downing et al, 2000). During our research we used some of the most widely accepted scenarios presented in international reports. The numbers in names of the scenarios denote the time interval they are generated for. We used the climate models of two meteorological institutes downscaled to Debrecen: scenarios GFDL2535 and GFDL5564 have been created by Geophysical Fluid Dynamics Laboratory (USA), UKHI and UKLO representing the drastic change for the end of the century, and UKTR3140 (transient) worked out by United Kingdom Meteorological Office (UKMO), with the scenario BASE6190 which is the base of scenarios, with the parameters of the past years.
To highlight the trends of climate change in the observed region we present the monthly average temperature and precipitation changes indicated for it in Table 1 and Table 2 (Erdélyi et al., 2009), comparing the data of the UKTR and GFDL scenarios and their reference period 1961-90.
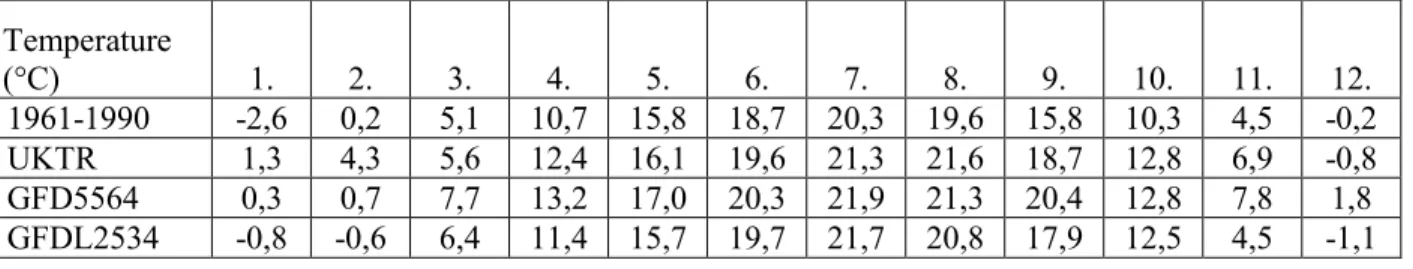
Table 1. Temperature changes indicated by different scenarios, monthly average data, Debrecen Temperature
(°C) 1. 2. 3. 4. 5. 6. 7. 8. 9. 10. 11. 12.
1961-1990 -2,6 0,2 5,1 10,7 15,8 18,7 20,3 19,6 15,8 10,3 4,5 -0,2
UKTR 1,3 4,3 5,6 12,4 16,1 19,6 21,3 21,6 18,7 12,8 6,9 -0,8
GFD5564 0,3 0,7 7,7 13,2 17,0 20,3 21,9 21,3 20,4 12,8 7,8 1,8
GFDL2534 -0,8 -0,6 6,4 11,4 15,7 19,7 21,7 20,8 17,9 12,5 4,5 -1,1
Table 2. Precipitation changes indicated by different scenarios, monthly average data, Debrecen Precipitation
(mm) 1. 2. 3. 4. 5. 6. 7. 8. 9. 10. 11. 12.
Comparing the sums of precipitation we could see a slow decrease of the accumulated precipitation amounts; the scenarios predict slightly smaller values in the future. This might be good for winter crops, because its yield grows with less precipitation in some periods of growing. But analyzing the observed and the future weather using climate scenarios we see a great variability in the amount of the precipitation. This means that the increase of the frequencies of extreme weather events such as droughts and floods is more probable. We intended to learn, what climate scenarios predict for the important growing periods of winter barley.
2.3. The KKT Climate Research Database Management Software and the production data
In order to collect, organize, manage and search databases for climate change research in a friendly way a special data management system was needed. An indicator-search software KKT has been developed at Corvinus University of Budapest, Department of Mathematics and Informatics (Szenteleki et al, 2007). Frequency calculations were made with the help of this program using the daily precipitation and temperature data forecasted by climate scenarios. Using the KKT Software we can calculate the number of the years when the needs of the plant are satisfied (or when not) and it can give us information about climate change indices, as well. These results can give us information for predicting extreme conditions.
Beside the meteorological databases, it contains the crop production data we used for risk analyses. The production data are from the Agricultural and Environmental Statistics Department of the Hungarian Central Statistical Office (KSH) for all counties, for the time interval 1951-2005.
2.4. A new stochastic efficiency method for detection of the production risk
For analysing the production risk, the data of the Hungarian regional yearly crop results were applied. The yield data were fitted by regression. Then they were corrected with the help of Phillips-method in order to make them comparable. The climate scenarios are given for different time intervals as independent patterns and not as time series, so for comparison we have used distribution functions and the first order stochastic dominance criterion based on the subjective distribution functions and also the E,V – efficiency criterion were considered (Ladányi, 2007, Ladányi and Erdélyi, 2008).
3. Results and discussion
The first step of our research was to examine the production data of winter barley by analysing how the production risk has changed with time. The next step was to study the climatic needs of the plant through the most important periods of its development. In this work results are shown for Hajdú-Bihar county. 3.1. Risk analysis
Figure 1. Winter barley production data (left) and the comparable yield (right) in Hajdú-Bihar county, 1951-2005
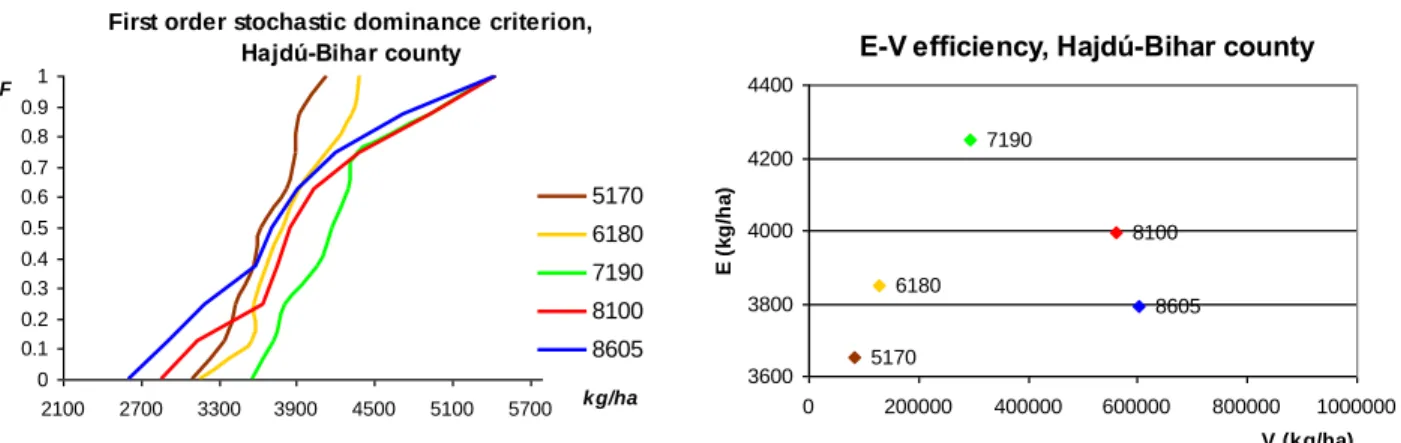
Next the subjective distribution functions are defined for the five times twenty years (Figure 2). Comparing the first three (1951-70, 1961-80, 1971-90) and last two (1981-2000, 1986-2005) time intervals, applying the stochastic efficiency criterion we proved that the risk of barley production has increased. The most evident risk increase was in the last two time intervals for this crop. The same was observed for all three chosen counties. The last two time slices has the widest range, which means the highest uncertainty. The same can be proved with the E,V -efficiency method (while the expectation was decreasing, the deviation was increasing). In every case we got that the situations become worse with time (Figure 2). This holds also for the other two research locations.
Figure 2. The first order stochastic dominance criterion (left) and the E-V efficiency (right) for analysing the winter barley production risk increase in time, 1951-2005
3.2. Climate needs of winter wheat through its phenological phases
Quite high risk increase of production was detected, which gives us many questions. So next we wanted to see what we might expect in crop production by analyzing the precipitation and temperature needs of the plant. By comparing the results of the same six climate scenarios and their reference period, we examined, whether the needs would be satisfied or not. We wanted to see what climate scenarios
Winter barley production data for Hajdú-Bihar county 0 1000 2000 3000 4000 5000 6000
1950 1960 1970 1980 1990 2000 2010 year y ie ld ( k g /h a )
Comparable winter barley production data for Hajdú-Bihar county
0 1000 2000 3000 4000 5000 6000
1950 1960 1970 1980 1990 2000 2010 year c o m p a ra b le y ie ld (k g /h a )
First order stochastic dominance criterion, Hajdú-Bihar county 0 0.1 0.2 0.3 0.4 0.5 0.6 0.7 0.8 0.9 1
2100 2700 3300 3900 4500 5100 5700 kg/ha
F 5170 6180 7190 8100 8605
E-V efficiency, Hajdú-Bihar county
5170 6180 7190 8100 8605 3600 3800 4000 4200 4400
0 200000 400000 600000 800000 1000000
period, the experienced 11-15 °C will be fulfilled according to the results of almost all of the climate scenarios except two, which predict warmer circumstances. The distribution functions for average temperature of climate scenarios in this period of growing are given in Figure 3.
Figure 3. The first order stochastic dominance criterion in sowing-emergence phase, for average temperature (left) and sum of precipitation (right)
Winter crops are very sensitive to meteorological circumstances in the stem elongation - spikelet initiation period. The average temperature in this phenological phase used to be 13-15 °C in the past. The climate scenarios show great variability in the frequency of the extreme values, but future does not show significant change in the average (Figure 4.).
Figure 4. The first order stochastic dominance criterion in stem elongation-spikelet initiation phase for average temperature (left) and sum of precipitation (right)
The third period for which we made calculations is the anthesis-grain filling phenological phase (Figure 5.), when the plant develops its generative organs. The precipitation need of the crop is 55-120 mm. In this period we can be quite satisfied with the forecasted values we got. The temperature need is 18-20 °C; ith temperatures lower than 16 °C this period lasts longer than 45 days, with temperatures higher than 20 °C it can be shorter than 40 days. The scenarios do not show extreme temperatures too many times, so this period is in favour of the plant.
Distribution function for average temperatures, sowing-emergency phase
0 0.2 0.4 0.6 0.8 1
8 10 12 14 16 18 20 22 24
temperature (°C)
Distribution function for cumulative precipitation, sowing-emergency phase
0 0.2 0.4 0.6 0.8 1
0 10 20 30 40 50 60 70
cum ulative precipitation
BASE UKHI UKLO UKTR GF2534 GF5564
Distribution funcion for average temperatures, stem elongation-spikelet initiation phase
0 0.2 0.4 0.6 0.8 1
12 14 16 18 20 22 24
temperature (°C)
Distribution function for cumulative precipitation, stem elongation-spikelet initiation phase
0 0.2 0.4 0.6 0.8 1
0 20 40 60 80 100 120 140 160
cum ulative precipitation
Figure 5. The first order stochastic dominance criterion in anthesis-grain filling phase for average temperature (left) and sum of precipitation (right)
4. Conclusion
The increase of the production risk proves the fact that the climate has already been changing. The application of regional climate models may be the basis of action plans of the response, prevention and adaptation strategies, in damage prevention of given regions. It is also important to investigate the quality parameters (Szalay D. et al, 2008). The more frequent the extreme weather events are, the more we can be convinced of uncertainty. Learning the possible changes and their effects based on comparative statistical analyses could be followed by crop modelling. It is also necessary to analyze more factors, their effects and their combined influence at the same time. Applying crop models (Fodor et al, 2002) we can do many virtual experiments on very low cost and in very short time. They are able to operate with meteorological parameters of climate scenarios, too. Designing simulations, virtual experiments are very useful in practical applications, because the model can be used to prepare agro-technological advisory systems for farmers (Ghaffari, 2002, Harnos, 2003). Risk caused by climate change should also be managed with coordinated adaptive strategies. Researches on impacts and adaptation possibilities have to support the decision makers in policy as well as in agriculture with information and plans (Láng, 2005).
Acknowledgements
This work was supported by the "Research in excellence of Corvinus University of Budapest" stipendium, the TÁMOP 4.2.1.B-09/1/KMR-2010-0005 project and the „Research Assistant of Corvinus University of Budapest” fellowship.
References
Bartholy, J., Pongrácz, R., Gelybó, G. (2007): Regional climate change expected in Hungary for 2071-2100. Applied Ecology and Environmental Research, 5, 1–17.
Downing, T.E., Harrison, P.A., Butterfield, R.E., Londsdale, K.G. 2000. Climate Change, Climatic Variability and Agriculture in Europe. European Commision, Brussels, pp. 76.
Erdélyi Éva, Gaál Márta, Horváth Levente (2009): Climate change impacts in agriculture and possible responses. CIGR Section V International Symposium 2009 - Technology and Management to Increase the Efficiency in
Distribution function for average temperatures, sowing-emergency phase
0 0.2 0.4 0.6 0.8 1
8 10 12 14 16 18 20 22 24
temperature (°C)
Distribution functions for cumulative precipitation, anthesis-grain filling phase
0 0.2 0.4 0.6 0.8 1
0 40 80 120 160
cumulative precipitation
BASE
UKHI
UKLO
UKTR
GF2534
Ghaffari, A., Cook, H.F., Lee, H.C. 2002. Climate change and winter wheat management: A modeling scenario for South-Eastern England. Climate Change 55 :509–533.
Hardaker, J. B., Huirne, R. B. M., Anderson, J. R., Lien, G. (2004) Coping with Risk in Agriculture. 2nd edn. CABI Publishing, Wallingford-Cambridge
Harnos, N. (2003): Simulation studies on the effect of climate change on winter wheat production (In Hungarian) “AGRO-21” Füzetek, 31, 56–73.
Hornok, M.: 2008. Effects of the most important agrotechnical elements on the yield of winter wheat. Cereal Research Communications. Volume 36, Number 3, pp. 1243–1246.
Jolánkai, M. 2005. Effect of climate change on plant cultivation. (In Hungarian) In: “AGRO-21” Füzetek 41 :47–58. Ladányi M. 2007. Risk methods and their applications in agriculture, Applied Ecology and Environmental Research 6(1), 147-164.
Ladányi, M. and Erdélyi, É. (2008) A review of risk methods in climate change impact researches in Hungary. In: Environmental, Health and Humanity Issues in the Down Danubian Region, Multidisciplinary Approaches, Eds: D. Mihailovic, M. Vojinovic Miloradov, World Scientific, 2008. 245-254.
Láng, I. 2005. Weather and climate change: change-effect-response. (In Hungarian) In: “AGRO-21” Füzetek 43 :3– 10.
Láng, I., Harnos, Zs., Jolánkai, M. 2004. Strategies of adaptation to climatic changes: international experiences and possibilities in Hungary. (In Hungarian) In: “AGRO-21” Füzetek 35 :70–77.
Márton, L. 2008. Long-term study of precipitation and fertilization interactions on winter wheat (Triticum aestivum L.) yield in the Nyírlugos Field Trial in Hungary between 1973 and 1990, Cereal Research Communications Volume 36, Number 3, pp. 511-522.
Olesen J. E, Bindi M. 2002. Consequences of climate change for European agricultural productivity, land use and policy. European Journal of Agronomy. 16. 4: 239–262.
Pepó, P. 2009. Interactive effect of different crop years and agrotechnical factors on the yield of winter wheat (in Hungarian) Növénytermelés Volume 58, Number 2, pp.107-122.
Szalay D. K, Farkas I, Szalay D. 2009. Evaluation of nutrient supply as abiotic stressor on winter wheat Triticum aestivum L. performance. Cereal Research Communication 37. (2), pp. 21- 24.
Szalay D, Szalay D. K, Hárs T, Klupács H. 2006. Copper – An important element influencing wheat quality. Cereal Research Communication 34. (1): pp. 77-80.
Szalay D., Szalay D. K., Farkas I., 2008: Grain quality- a soil plant indicator. Cereal Research Communication 36. (2): 1295-1298 pp.
Szenteleki K, Révész A, Hufnagel L, Erdélyi É, Ladányi M, Solymosi N, Horváth L. 2007. Introducing the KKT Climate Research Database Management Software. EFITA Conference, Glasgow, CD-ROM