This version was downloaded from Northumbria Research Link: http://nrl.northumbria.ac.uk/21424/
Northumbria University has developed Northumbria Research Link (NRL) to enable users to access the University’s research output. Copyright © and moral rights for items on NRL are retained by the individual author(s) and/or other copyright owners. Single copies of full items can be reproduced, displayed or performed, and given to third parties in any format or medium for personal research or study, educational, or not-for-profit purposes without prior permission or charge, provided the authors, title and full bibliographic details are given, as well as a hyperlink and/or URL to the original metadata page. The content must not be changed in any way. Full items must not be sold commercially in any format or medium without formal permission of the copyright holder. The full policy is available online:
POWER (CHP) TO OPTIMISE ENERGY
CONVERSION AND SUPPORT POWER
DISTRIBUTION NETWORKS
SAMIR KARMACHARYA
PhD
POWER (CHP) TO OPTIMISE ENERGY
CONVERSION AND SUPPORT POWER
DISTRIBUTION NETWORKS
SAMIR KARMACHARYA
A thesis submitted in partial fulfilment
of the requirements of the
University of Northumbria at Newcastle
for the degree of
Doctor of Philosophy
Research Undertaken in the
Faculty of Engineering and Environment and
in collaboration with
National Renewable Research Centre (Narec)
October 2013
I
ABSTRACT
Climate change and continuously increasing energy prices have driven the need for low carbon and renewable energy technologies from different sectors, including the domestic sector, by installing higher energy efficiency technologies. One of these technologies is the Stirling engine based micro-combined heat and power (CHP) which has the potential to achieve lower overall carbon emissions by generating both heat and electricity locally. Its successful implementation to meet the energy demands (thermal and electrical) throughout the year depends on several factors such as the size and type of building and demand profiles. In addition, the deployment of large number of micro-CHPs may have significant impact on the performance of the power distribution networks.
In this research, a dynamic model of a domestic-scale natural gas fired Stirling Engine based micro-CHP unit (including start-up and shut-down characteristics) is developed using experimental data of a 6 kW (heat output) and 1 kW (electrical output) laboratory prototype. A dynamic thermal model of a house along with its heating system is also developed. Domestic renewable energy sources such as photovoltaic (PV) and micro-wind turbine are also considered. The integrated energy model has been applied to two typical UK houses: semi-detached and detached. The model was simulated for a typical winter and summer week as well as for the whole year. Results for the two cases show that the electrical contribution of a Stirling engine type micro-CHP heavily depends on the thermal demand of the building and that up to 19% of the locally-generated electricity is exported whilst meeting a similar percentage of the overall annual electricity demand.
A fuzzy logic controller for micro-CHP is proposed with the aim of managing the energy generated by micro-CHP and supporting the distribution network. Two different scenarios based on network health are considered. For the network operating under healthy condition: feed-in-tariff and electricity trading cases were considered. When considering feed-in-feed-in-tariff, the micro-CHP with controller showed the annual operating cost and carbon savings when compared to conventional boiler or a micro-CHP without a controller. In the case of electricity trading scenario, the annual operating cost saving was much less than the feed-in-tariff scenario. For the scenario where the network is close to voltage statutory limits the response of the fuzzy logic controller is shown to support the grid.
II
LIST OF CONTENTS
ABSTRACT...I LIST OF CONTENTS...II LIST OF FIGURES... VI LIST OF TABLES ... X ACKNOWLEDGEMENTS ... XI DECLARATION ... XII NOMENCLATURE ... XIII ABBREVIATION... XVI CHAPTER 1 INTRODUCTION ... 1 1.1 Background ... 11.2 Research Aims and Objectives... 4
1.3 Original Contribution ... 6
1.4 Overview of the Thesis ... 7
CHAPTER 2 LITERATURE REVIEW ... 9
2.1 Introduction ... 9
2.2 Energy Use within a Dwelling ... 9
2.2.1 Thermal energy ... 10
2.2.2 Electrical energy ... 12
2.3 Reduction of energy consumption ... 15
2.3.1 Performance of micro-generation systems for domestic buildings ... 17
2.4 Modelling of micro-CHP systems with energy demands ... 21
III
2.6 Effects of micro-CHP systems on distribution networks ... 24
CHAPTER 3 DISTRIBUTED GENERATION & STORAGE SYSTEMS ... 26
3.1 Introduction ... 26
3.2 Small Scale Distributed Generation ... 26
3.2.1 Micro-combined heat and power ... 27
3.2.1.1 Stirling engine micro-CHP ... 29
3.2.1.2 Internal combustion engine (IC engine) micro-CHP ... 34
3.2.1.3 Fuel cell ... 35
3.2.2 Photovoltaic (PV) ... 38
3.2.3 Small scale wind turbine system ... 42
3.3 Benefits of Distributed Generation... 46
3.4 Impact of Distributed Generators on Low Voltage Networks ... 48
3.4.1 Voltage change ... 48
3.4.2 Reverse power flow ... 49
3.4.3 Increased fault level ... 50
3.4.4 Voltage unbalance ... 50
3.5 Energy Storage Systems ... 50
3.5.1 Thermal energy storage ... 51
3.5.2 Electrical energy storage... 51
CHAPTER 4 THERMAL MODELLING OF BUILDING AND HEATING SYSTEMS... 55
4.1 Introduction ... 55
4.2 Building Thermal Model Input Variables ... 57
4.3 Building Model ... 59
4.4 Solar Radiation Model ... 63
4.5 Heating System Model ... 64
4.6 Model Implementation ... 67
4.7 Model Verification ... 73
CHAPTER 5 MODELLING OF DISTRIBUTED GENERATION AND A TYPICAL LOW-VOLTAGE NETWORK ... 77
5.1 Introduction ... 77
5.2 Stirling Engine Micro-CHP Modelling ... 77
5.2.1 Experimental setup ... 78
5.2.2 Modelling ... 79
5.2.3 Results ... 81
5.3 Photovoltaic (PV) Modelling ... 83
5.3.1 Modelling ... 84
5.3.2 Results and validation ... 88
IV
5.4 Small Scale Wind Turbine Modelling ... 92
5.4.1 Wind rotor model ... 95
5.4.2 Equivalent d.c. model of three-phase PMGs ... 98
5.4.3 Results ... 102
5.5 Low-Voltage Network Modelling ... 103
5.5.1 Introduction ... 103
5.5.2 Modelling ... 106
5.5.3 Results ... 109
CHAPTER 6 INTEGRATION OF DISTRIBUTED GENERATORS AND THERMAL MODEL OF THE BUILDING ... 111
6.1 Introduction ... 111
6.2 Application ... 112
6.3 Results and Discussion ... 119
CHAPTER 7 PROPOSED MICRO-CHP CONTROLLER ... 130
7.1 Introduction ... 130
7.2 Fuzzy Logic Control ... 131
7.3 Design of a Fuzzy Logic Controller ... 134
7.3.1 Membership function... 135
7.3.2 Rule base ... 138
7.3.3 Fuzzy inference process ... 139
7.4 Results and Discussion ... 140
7.4.1 Network operating under healthy voltage condition ... 141
7.4.1.1 Feed-in-tariff (FIT) scenario ... 141
7.4.1.2 Electricity trading scenario ... 145
7.4.2 Network operating close to statutory limits ... 147
7.4.2.1 Network operating close to upper voltage limit ... 148
7.4.2.2 Network operating close to lower voltage limit ... 152
CHAPTER 8 CONCLUSIONS AND FURTHER WORK ... 154
8.1 Energy Flow within a Building ... 154
8.2 Proposed Fuzzy Logic Controller ... 156
8.3 Suggested Further Work ... 158
APPENDIX A: SPECIFICATION OF ‘WHISPERGEN’ STIRLING ENGINE BASED MICRO-CHP ... 170
V APPENDIX C: SPECIFICATION OF THE WIND TURBINE ... 172
APPENDIX D: PARAMETERS OF THE LV NETWORK ... 173
VI
LIST OF FIGURES
Figure 1.1 Micro-CHP system with proposed controller ... 6
Figure 2.1 Comparison of the actual and annual averaged daily electricity demand at one minute resolution ... 14
Figure 3.1 Thermodynamic processes in the ideal Stirling-cycle engine as shown on a simplified β-configuration machine. ... 31
Figure 3.2 Thermodynamic processes in the ideal Stirling-cycle engine. (A) Pressure-volume diagram. (B) Temperature-entropy diagram. ... 32
Figure 3.3 Key components of Stirling engine based micro-CHP ... 33
Figure 3.4 A typical breakdown of the overall efficiency of a fuel cell based micro-CHP system ... 36
Figure 3.5 The part load efficiency for fuel cell based micro-CHP, ENEFARM ... 37
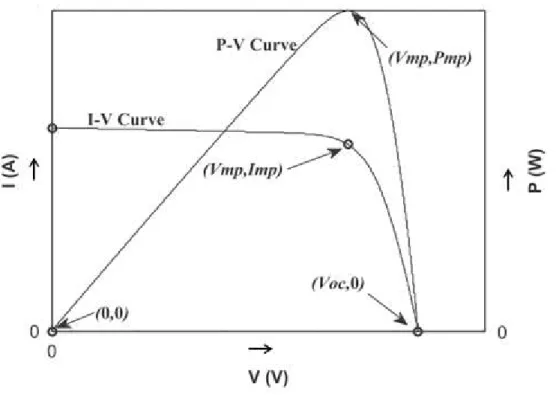
Figure 3.6 I-V and P-V characteristics curves of a typical PV array ... 39
Figure 3.7 Power flow in a wind energy conversion system ... 43
Figure 3.8 Power curve of a wind turbine ... 45
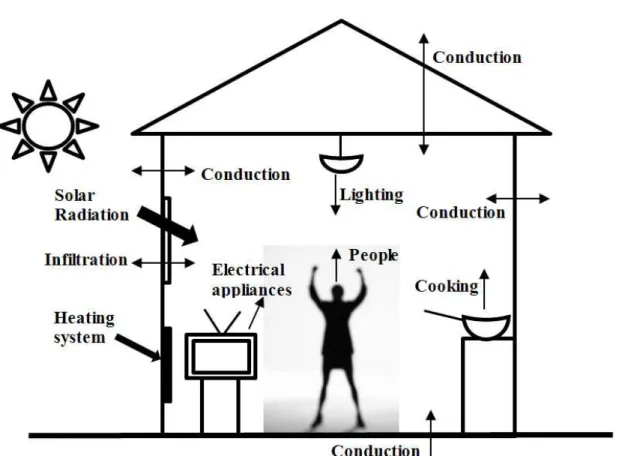
Figure 4.1 Building energy balance ... 57
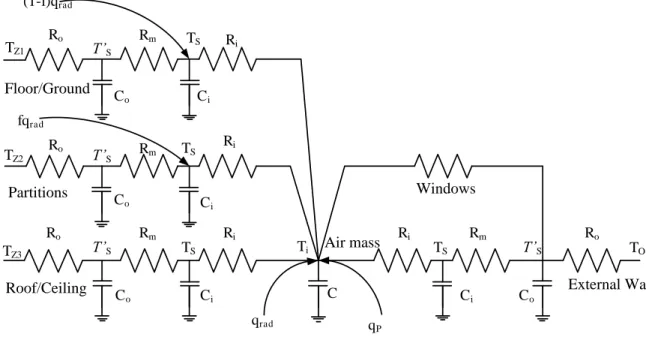
Figure 4.2 Second-order lumped-parameter construction element ... 61
Figure 4.3 Simplified building energy transfer paths ... 63
Figure 4.4 Third order room emitter ... 65
Figure 4.5 Plan view of semi-detached house ... 67
Figure 4.6 Zone air temperatures with no heating ... 70
Figure 4.7 Zone air temperatures for a week ... 71
Figure 4.8 Zone temperatures for weekdays (1&2) and weekend (3) ... 71
VII
Figure 4.10 Heat emitted for weekdays (1 & 2) and weekend (3) ... 72
Figure 4.11 Comparison of balance zone air temperature without heating ... 75
Figure 4.12 Comparison of balance zone air temperature with heating ... 75
Figure 4.13 Comparison of living room air temperature without heating ... 76
Figure 4.14 Comparison of living room air temperature with heating ... 76
Figure 5.1 Micro-CHP system test rig ... 79
Figure 5.2 Simulink model of micro-CHP (a) Power component (b) Heat component ... 81
Figure 5.3 Fitted model to micro-CHP data ... 82
Figure 5.4 Comparison of coolant outlet temperature ... 83
Figure 5.5 Two diode model of PV cell ... 84
Figure 5.6 Algorithm used to adjust the I-V model ... 87
Figure 5.7 I-V and P-V characteristic curves ... 88
Figure 5.8 Comparison of I-V curves of PV model with data sheet value at different Irradiation ... 89
Figure 5.9 PV model with MPPT in Matlab/Simulink ... 91
Figure 5.10 PV power generation during a winter week ... 92
Figure 5.11 Schematic diagram of small scale wind turbine power system ... 93
Figure 5.12 Control system for WECS using lookup table method ... 95
Figure 5.13 The wind rotor characteristics ... 97
Figure 5.14 Simulink model of wind rotor ... 98
Figure 5.15 The d.c. load circuit of a PMG. ... 99
Figure 5.16 The equivalent d.c. circuit of PMG ... 99
Figure 5.17 Simulink model of PMG equivalent d.c. model ... 101
VIII
Figure 5.19 Single line diagram of typical low voltage network in UK ... 105
Figure 5.20 MATLAB/Simulink model of the typical low voltage network in the UK ... 107
Figure 5.21 Detail of lumped 400V feeder in 11kV ... 108
Figure 5.22 Detail of low voltage feeder (400V) ... 108
Figure 5.23 Averaged daily load profile for month of February [115] ... 109
Figure 5.24 Voltage profile at different busbar of the distribution network ... 110
Figure 6.1 Integrated simulation model... 112
Figure 6.2 Plan view of detached house type ... 114
Figure 6.3 Daily power demand pattern for semi-detached type house ... 116
Figure 6.4 Daily power demand pattern for detached type house ... 117
Figure 6.5 Domestic hot water demand profile ... 118
Figure 6.6 Typical winter week zone temperatures (semi-detached house type) ... 120
Figure 6.7 Typical winter week electrical power flows (semi-detached house type) ... 121
Figure 6.8 Typical winter week thermal power flows (semi-detached house type) ... 122
Figure 6.9 Typical summer week thermal power flows (semi-detached house type) ... 123
Figure 6.10 Typical summer week electrical power flows (semi-detached house type) ... 124
Figure 6.11 Typical winter week zone temperatures (detached house type) ... 124
Figure 6.12 Typical winter week electrical power flows (detached house type)... 125
Figure 6.13 Typical winter week thermal power flows (detached house type) ... 125
Figure 6.14 Typical summer week thermal power flows (detached house type) ... 126
Figure 6.15 Typical summer week electrical power flows (detached house type) ... 126
Figure 7.1 Fuzzy controller for micro-CHP ... 134
Figure 7.2 Membership function of hot water temperature difference ... 136
IX Figure 7.4 Membership function of voltage ... 137 Figure 7.5 Annual operating costs for semi-detached and detached house for different
scenario ... 144 Figure 7.6 Annual CO2 emission for the semi-detached and detached house for different
scenarios. ... 145 Figure 7.7 Voltage profile when micro-CHP operating at 0.97 lagging was considered. .... 149 Figure 7.8 Operation of fuzzy logic controller when is voltage close to upper limit ... 151 Figure 7.9 Operation of fuzzy logic controller when is voltage close to lower limit ... 153
X
LIST OF TABLES
Table 2-1 Comparison of different micro-CHP technologies ... 17
Table 3-1 Benefits of distributed generations ... 46
Table 3-2 General table of technologies and their characteristics. ... 53
Table 4-1 Active occupancy pattern ... 68
Table 5-1 Model parameters for the test case micro-CHP module ... 80
Table 6-1 Calculation of Internal Gains ... 113
Table 6-2 Electrical appliances in use in houses... 115
Table 6-3 Annual energy account (power) ... 129
Table 6-4 Annual energy account (heat) ... 129
Table 7-1 Rules of the proposed Fuzzy logic controller ... 139
Table 7-2 Operators for the fuzzy logic controller... 140
Table 7-3 Feed-in-tariff for different technologies ... 142
Table 7-4 Annual operating costs and savings when electricity trading scenario is considered for both houses ... 146
XI
ACKNOWLEDGEMENTS
I wish to express my sincere thanks and gratitude to my supervision team, Professor Ghanim Putrus, Professor Chris Underwood and Professor Khamid Mahkamov for their great support and guidance to make the project a success. I appreciate their idea for allowing me to create my own academic interest. I wish to express my profound thanks to Dr. Steve McDonald at NaREC, Blyth, UK for his guidance and advice for my project as the industrial supervisor.
I would like to thank Northumbria University and NaREC, Blyth, UK for the financial support they provided during the project.
I would like to give great appreciation and thanks to my colleagues at the Power and Wind Energy Research group, Northumbria University for their kind help in doing this project. Also, I would like to thank all administrative staff at the Faculty of Engineering and Environment for their support and all others who directly or indirectly helped me doing this research project.
I am very grateful to my parents, Mr Daya Man Karmacharya and Mrs. Usha Karmacharya, my brother, sister for their continuous support. I am very grateful to my beloved wife, Sarina, and son who are giving me never ending support by sacrificing a lot of things in their life.
XII
DECLARATION
I declare that the work contained in this thesis has not been submitted for any award and that it is all my own work. I also confirm that this work fully acknowledges opinions, ideas and contributions from the work of others. The work was done in collaboration with National Renewable Energy Centre, Blyth.
I declare that the Word Count of this Thesis is 36,771 words.
Name: Samir Karmacharya
Signature:
XIII
NOMENCLATURE
ε(s) Uniformly distributed error
τ Time constant (sec)
ρ Density of air (kg/m3)
φm Magnetic flux linkage (Wb)
λ Tip speed ratio of wind rotor
ω Rotational speed of the wind rotor (rad/s)
ωs Rotational speed of electric field of d.c. motor (rad/s)
a, a1, a2 Ideal factor of diode, diode 1 and diode 2 respectively
cp Specific heat capacity of water (J/g˚C)
C Total thermal capacity (J /kgK) Ci Internal thermal capacity (J /kgK)
Co Outer thermal capacity (J /kgK)
CP Power coefficient of wind rotor
Ct Torque coefficient of wind rotor
Cw
Overall thermal capacity of emitter (include the radiator material and water) (J/kgK)
D Duty ratio of buck-boost converter E0 Generated EMF (V)
EG Energy band gap of semiconductor (1.12 eV)
G Surface irradiance of the cell (W/m2)
GSTC Surface irradiance of the cell at STC (W/m2)
Ginh Inherent valve characteristics
Gins Installed valve characteristics
Go Valve let-by
G(s) Transfer function to represent response in heat/power output I Output current from solar cell (A)
Id d.c. current (A)
XIV Io1, Io2 Reserve saturation current of diode 1 and diode 2 respectively (A)
IB Current flowing towards d.c. bus (A)
IG Current flowing from the PMG generator (A)
IPV Current generated by incident of sunlight (A)
IPV_STC Current generated by incident of sunlight at STC (A)
k Boltzmann constant (1.3806503×10⁻²³ J/K)
k' Constant
K Gain
KI Short-circuit current coefficient of the PV cell (%/°C)
Ke Overall emission constant for the emitter
KV Open circuit voltage coefficient of the PV cell (%/°C)
Lph Phase Inductance (La = Lb = Lc) (mH)
mw Mass of water (kg)
n Heat transfer index N Valve authority (fraction)
Ns Number of cell connected in series
p Number of pole pairs
P Power captured by the wind rotor (W) Pmax_C Maximum power calculated (W)
Pmax_E Maximum power from data sheet (W)
q Electronic charge (= 1.60217646×10⁻¹⁹ C) qrad Heat input by solar radiation (W)
qp Heat input by heating system (W)
R Total thermal resistance (m2/kW) Rdc Effective armature resistance (ohm)
Ri Internal thermal resistance (m2/kW)
Rm Middle thermal resistance (m2/kW)
Ro Outer thermal resistance (m2/kW)
Rover Overlap resistance (ohm)
XV Rp0 Initial shunt resistance of PV cell (ohm)
Rph Phase resistances (Ra = Rb = Rc) (ohm)
Rr Radius of the wind rotor (m)
Rs Series resistance of PV cell (ohm)
Rs0 Initial series resistance of PV cell (ohm)
td Time delay (S)
T Temperature of p-n junction (K) Ta Aerodynamic torque (N.m)
Te Electromagnetic torque (N.m)
Ti Internal air temperature (°C)
To Outside air temperature (°C)
Toff Off time of the duty cycle of buck-boost converter (S)
Ton On time of the duty cycle of buck-boost converter (S)
TSTC Temperature of p-n junction at STC (K)
Tw1 Temperature of water in zone 1 (°C)
Tw2 Temperature of water in zone 2 of emitter (°C)
Twi Temperature of water going into the emitter (°C)
Twr Temperature of water coming out of emitter (°C)
Tz1 Temperature of zone 1 (°C)
Tz2 Temperature of zone 2 (°C)
Tz3 Temperature of zone 3 (°C)
u Stem position (fraction) Vd Output d.c. voltage (V)
Vmp Voltage across PV cell during the maximum power (V)
VB Voltage at the DC bus (V)
VG Voltage at the generator side of PMG (V)
VOC_STC Open circuit voltage of PV cell at STC (V)
VT1, VT1 Thermal voltage of diode 1 and diode 2
xi, xm, xo Ratio of total thermal resistance (fraction)
XVI
ABBREVIATION
AC Alternating Current
ASHRAE American Society of Heating Refrigeration and Air-Conditioning Engineers BESTest Building Energy Simulation Test
CHP Combined Heat and Power CPF Carbon Price Floor
DC Direct Current
DG Distributed Generation DHW Domestic Hot Water
DNO Distribution Network Operator
ECBCS Energy Conservation in Building & Community Systems EPS Emissions Performance Standards
FIT Feed-in-Tariff IC Internal Combustion
IEA International Energy Agency
IWEC International Weather form Energy Calculations micro-CHP Micro-Combined Heat and Power
MPP Maximum Power Point
MPPT Maximum Power Point Tracking OLTC On load Tap Changing
PEMFC Polymer Electrolyte Membrane Fuel Cell PCC Point of Common Coupling
PMG Permanent Magnet Generator
PV Photovoltaic
RHI Renewable Heat Incentive SOFC Solid Oxide Fuel Cell STC Standard Test Condition
1
Chapter 1
Introduction
1.1
Background
Climate change, insecurity of the supply of energy and reduction in fossil fuels resources are leading to continuous increase in energy prices and the desire of countries to be energy self-sufficient. Different climatic agreements made in Kyoto, Bali and Copenhagen reflect human realisation about the threat of climate change and its impact on humanitarian crisis and global ecology. The UK government (through the European Union) has set legally binding carbon emission reduction targets of at least 80% lower than the 1990 baseline by 2050 and has introduced carbon budgets to meet these targets through the climate change Act 2008. To meet these targets carbon emissions are to be decreased from different sectors including domestic sector by increasing the thermal insulation and using higher energy efficiency technologies. The UK government has lowered VAT for households installing energy saving material and technologies and set out the targets for households to reduce carbon emissions by 60% by 2050 [1].
Existing centralised thermal power stations not only produce electricity but they also produce large amounts of heat in the process of power generation, which is simply wasted to the environment. The size and location of centralised plants prevent the use of this heat for building and industry. In the UK, building heating is usually on-site and gas boilers fired by natural gas are common, with an average efficiency of 80% [2].
A distributed system of heat and electricity generation in individual houses or buildings could offer significant advantages over the traditional systems. This concept is known as
2
‘Combined Heat and Power (CHP)’ which is widely used in energy intensive industries
where both electricity and heat generated are fully used to reduce the cost of fuel. This technology is based on utilizing waste heat in order to significantly increase the total efficiency of the CHP system to over 80% compared to an efficiency of 30-35% in conventional electricity generation system, resulting in significant reduction of operation costs and carbon dioxide emissions.
Small scale version of such technology, suitable for dwellings or small buildings, is referred as micro-CHP. Micro-CHP is a growing technology in Europe due to its advantages such as higher energy efficiency, low emissions, increased energy security, lower transmission losses etc. There are many technologies of micro-CHP based on the energy conversion method: Stirling engine, internal combustion engine, fuel cell, organic Rankine cycle and micro gas turbine. Out of these, the internal combustion engine is commercially available, the Stirling engine is close to market availability and fuel cells are in prototype stage. Research has shown that the Stirling engine based micro-CHP provides economical and emission benefits when compared to a condensing boiler in domestic scenario [3]. Much of the progress concerning the behaviour of micro-CHP plant in domestic applications has focused on comparing the seasonal economics of alternative module types [4-6] and on the measurement of the individual and comparative performances of these systems [7, 8]. Stirling engine based micro-CHP is considered as best current option for a range of domestic operating scenarios when compared to other micro-CHP technologies [5].
Control of a micro-CHP in a single dwelling is a challenge as the thermal demand and electrical demand does not coincide. Peacock and Newborough [9] have stated that annual
3 heat to power ratio in a UK single house varies from approximately 2:1 to 8:1 approximately and this ratio is not always constant over the operation of the CHP. As a result, micro-CHP systems must be connected to the electrical distribution network or storage devices (for both thermal and electrical storage).
In the future, residential combined heat and power units at the domestic user level are expected to be installed on a large scale along with other distributed generators such as photovoltaics (PV) and micro wind turbines. These will have significant impact on the low voltage power network performance, the generation methods, transportation and supply of electricity. At least 20% of domestic heating systems are expected to be replaced by micro-CHP in future and this rollout of micro-micro-CHP technology on such a scale will change the way electricity networks have to be controlled [10, 11].
Even though there are benefits of micro-CHP, there are still challenges which needs to be addressed such as
Integrating these units into an unfamiliar application in which both thermal demand and power demand vary throughout the season often with a significant random component,
Wide ranges of electrical and fuel tariff possibilities,
Possible existence of other competing embedded renewable energy supply technologies and the way micro-CHP response to the change in power distribution network parameters such as voltage, dynamic pricing or frequency.
Among the issues mentioned above, fulfilling the energy demand (electrical and thermal) of the building and responding to the change in voltage (or frequency) of supply power in order
4 to reduce strain on the power network and thus avoid black out would be the most important issues. These issues need to be addressed before the full potential of micro-CHP systems within the building can be realised. Reducing strain in the power distribution network refers to supply of power from micro-CHP when the grid voltage decreases and is close to lower
limit or drop in frequency and switching ‘off’ of the micro-CHP system when the grid voltage increases (and is close to the upper limit) or a rise in frequency. Changes in power distribution network can be communicated through smart meters, which will replace the gas and electricity meters in the houses by 2020. So this research focuses on these issues by trying to optimise the benefit of micro-CHP system not only from the user’s point of view
(energy efficiency) but also from the power distribution network operator’s (DNO) point of
view (network support).
To address the above issues, a fuzzy logic controller has been developed which will respond based on space heating requirement, hot water demand and voltage of the supply power. Here, voltage is taken as a reference to support the grid. However, other reference signals such as dynamic pricing or supply frequency could be taken to support the grid and reduce the stress on the power supply infrastructure. Dynamic pricing (also known as real-time pricing) refers to time based pricing where electricity price may change as often as hourly.
1.2
Research Aims and Objectives
This research aims to develop a controller for micro-CHP which would optimise the energy efficiency on the basis of dwelling energy demand as well as to support the power distribution network depending upon the signal received from the DNO via smart meter. The proposed control strategy will enable the micro-CHP to:
5 Communicate with the DNO via the smart meter.
Consider energy demands (both heat and power) of the dwelling and manage energy produced by micro-CHP.
Consider other local renewable energy sources.
On the basis of these factors, an appropriate control strategy based on fuzzy logic is to be developed.
The objectives of the research may be summarized as follow:
Develop a dynamic simulation model of a typical house in the UK, to analysis the thermal and electrical demands.
Develop a model of micro-CHP incorporating start-up and shut down characteristic. Analyse the performance of the micro-CHP for typical electrical load profile and
heat demand in the dwelling.
Investigate the possibility of integrating the operation of the micro-CHP with other renewable energy sources such as micro PV and wind turbines.
Develop a smart controller which would manage the energy available in the dwelling and support the power distribution network.
The conceptual arrangement of the residential micro-CHP system with the proposed controller is shown in Figure 1.1. The renewable energy sources, shown in Figure 1.1 only contribute in the electrical energy flow as micro-CHP does.
6 Figure 1.1 Micro-CHP system with proposed controller
1.3
Original Contribution
Development of generic model of a typical house with its heating system in the UK incorporating a micro-CHP, which enables dynamic analysis of the thermal and electrical requirements of the house.
Dynamic model of a Stirling engine based micro-CHP featuring its start-up and shut down of thermal and electrical characteristics.
The proposed model is of first kind which involves micro-CHP coupled to heating system of a house that is fully dynamic, allowing to deal with spikes of load demands (i.e. hot water and electrical demands) as well as being able to interact with energy storage systems.
7 Design of a controller for Stirling engine based micro-CHP which would manage the available energy conversion in the building and support the distribution power network.
As shown in the literature review, described in the following section, no previous work has been carried out on the dynamic modelling of this combination of system components.
1.4
Overview of the Thesis
This thesis is structured as follows:
In chapter two, the energy used within the building and the means of reducing the energy is discussed. A literature review is presented on the performance of micro-CHP, modelling of CHP with energy demands within the building and strategies used to operate micro-CHP to fulfil the energy need of the dwelling.
Chapter three describes energy generation systems and energy storage systems for domestic applications. Characteristics of different distributed generation technologies (such as micro-CHP, PV, wind turbine) that are usually used in dwellings and considered in this work are discussed. The advantages of these technologies and their impact on the grid such as voltage rise, increase in fault level, etc, are also presented in this chapter.
Chapter four presents a dynamic thermal model of the building envelop, dynamic modelling of the heating system within a building and solar radiation model (solar gain model). These models are put together and presented as a case study for a two storey 3-bedroom house in
8 the city of Newcastle. The results obtained from the case study are then compared with the results obtained from another reference program with identical inputs.
The developed mathematical models of different distributed generators considered in this work are presented in chapter five along with a model of a typical UK power distribution network. These models are implemented in Matlab/Simulink and the results obtained are presented in this chapter.
Chapter six analyses the results obtained when all the above mentioned models are put together in two case study houses with different design, construction and energy demands. Chapter seven describes the development of the proposed controller for micro-CHP. It presents the inputs considered and discusses the fuzzy logic controller and the results obtained.
In the last chapter, chapter eight, the results have been further discussed and conclusions have drawn from the thesis and the steps identified for the required further studies in the field are described.
9
Chapter 2
Literature Review
2.1
Introduction
This chapter summarises the background research that has been conducted to extract the key points that outlines the trends of current research carried out in the field of technologies developed for energy use within the residential buildings.
2.2
Energy Use within a Dwelling
In 2011, the domestic sector consumed 1626.24 TJ (38,842 thousand tonnes of oil equivalent) which accounts 26% of total UK consumption of energy. Of all the energy consumed in the domestic sector, space heating accounted for 60%, water heating 18%, lighting and appliances 19% and cooking was responsible for 3% [12]. Energy demand in a house can be divided into two categories: thermal energy demand and electricity demand. Both energy demands vary significantly from one household to another due to different characteristics of each house and the occupants living in that house. Peacock and Newborough [13] found that for nine dwellings, the annual thermal demand varied from 9.3 to 27.2 MWh and the annual electrical power demand varies from 3.5 to 7.5 MWh resulting in annual heat to power ratios ranging from 1.5 to 5.7. These variations in energy demand depend on various factors such as geographical location, building design, occupancy patterns, economic status of the occupants and efficiency of the heating system. Therefore, determining the thermal and electrical demand of a residential building is important in order to maximise the energy conversion of the micro-CHP systems. The pattern of use of
10 electricity, space heating and hot water consumed over the course of time are critical when analysing micro-CHP system.
2.2.1 Thermal energy
The thermal demand of a house may be considered to consist of three components
I. Space heating: Space heating is provided by the central heating system and mainly depends on the season/weather, house design and occupancy pattern. It is usually supplied by a central heating system using a boiler. If all the occupants are not at home during the day, such as on weekdays the heating system is turned on only in the morning and evening. However for weekends, it may be turned on all day when the occupants are at home.
The heating demand is a combination of comfort aspirations, economic circumstances and living habits. There are different factors which influence the space heating energy requirement which can be divided into five categories:
Physical characteristic of the house: U-values, thermal capacity, internal heat transfers, infiltration rate, etc.
External weather condition: temperature, solar radiation, wind speed, etc. Physical characteristic of heating system: system efficiency, responding time
according to heat requirement, controls, etc.
User requirement: temperature level in different parts of the house at different times of the day and times of the year, window opening, etc.
Internal heat gain due to the use of electrical equipment and from the
11 II. Domestic hot water (DHW): The majority of hot water is required for one of the main activities: washing machine, shower, bath, washing dishes and hand and face washing. Other miscellaneous uses such as car washing are not daily and cannot be predicted. In general, the pattern of hot water used in a house is very irregular and the quantity varies widely for several different purposes. The common pattern of hot water use is in the morning and in the evening around the limited occupancy periods. DHW demand is mostly met by the central heating boiler but sometimes it can be supplied by electricity (immersion heater). However, hot water energy supply can be decoupled from the demand in most houses by means of a conventional hot water storage tank.
In the UK, on average 49 litres of hot water is used per person per day, with little variation [14]. Yao and Steemers [15] developed a simple method to generate domestic hot water load profiles based on the energy profile of each appliance such as dish washer, bath/shower, hand wash etc. A report published by the Energy Saving Trust [16], based on the hot water consumption data from 120 houses, indicates that the mean consumption per household is 122 litres/day, with a 95% confidence interval of ± 18 litres/day. The report revealed that the consumption is mainly influenced by the number of occupants (including children) not the geographical region or the boiler type. The report also mentions that some households heat water as and when it is required and the remainder generally heat between 8 a.m. and 10 a.m. in the morning and between 6 p.m. and 11 p.m. in the evening.
12 III. Cooking: Cooking which may be characterised as the requirement of small heat inputs at high temperature for relatively short durations. The fuel used for cooking may be gas, electricity, oil or solid fuel. Mostly gas is used for cooking, however if electricity is used for cooking, relatively large fluctuations in the electrical demand profile tend to occur during the peak periods. Heat produced during cooking contributes to the thermal gain in the house, though not significantly.
2.2.2 Electrical energy
Electrical demand in a house is dynamic and energy use varies dramatically with time of day and time of year. Electrical demand in a house depends on many factors such as social status of occupants, size of dwelling, number of occupant, time of day and year, geographical location and ownership of the appliances. It mainly depends on the behaviour of the occupants and their use of the appliances. The component of electrical consumption in a house may be classified in three categories: predictable, moderately predictable and unpredictable [17]. Energy consumed by appliances in a house when unoccupied or occupants are asleep are predictable such as a refrigerator, security lights, standby appliances. Moderately predictable energy consumption is related to the habitual behaviour patterns of the occupants such as watching TV, switching lights on/off and occupancy times/durations. However, washing clothes, ironing of clothes and other kitchen appliances are unpredictable energy consumptions.
Daily electrical demand data are available at half-hour intervals [18, 19] and averaged over a year [20]. Figure 2.1 compares the actual daily electricity demand of a house and annual averaged daily electricity demand of a house at an interval of 1 minute obtained from a
13 survey published in [21]. The actual electrical demand curve shows rapid variations and many higher peaks of short intervals whereas annual averaged daily load curve shows relatively slow steady rise and fall in electrical demand. The maximum and minimum load for actual demand is 11.43 kW and 0.164 kW respectively whereas for the annual averaged maximum and minimum load is 1.65 kW and 0.265 kW. Similarly using daily electricity demand at a time interval of 30 minutes tends to hide loads with short intervals and there are numbers of appliances which operate for short intervals in dwellings. This could lead to over/under estimates of the import and export of power and consequently affect the feasibility of installing on-site generation in the dwelling [22, 23]. Therefore, a proper representation of the actual electrical demand of a house requires actual (not averaged) and high temporal resolution data.
14 Figure 2.1 Comparison of the actual and annual averaged daily electricity demand at one minute resolution[21].
Widen and Wackelgard [24] developed a stochastic model that generates domestic electricity demand for an individual household on the basis of occupancy pattern. Similarly, Yao and Steemers [15] developed a simple method to predict the daily load profile which can be applied to individual houses and regional levels. Richardson, et al. [25] developed a domestic electricity use model which is based on a combination of patterns of active occupancy and daily activity profile. All these models are developed with a high resolution; i.e. they can generate electrical demand of a house at an interval of 1 min. The international research project conducted by the IEA Energy Conservation in Buildings & Community
0 4 8 12 16 20 24 0 4 8 12 X: 8.617Y: 11.43 Time (hr) A c tu a l L o a d ( k W) X: 6.283 Y: 0.1649 0 4 8 12 16 20 240 0.5 1 1.5 X: 18.05 Y: 1.651 A v e ra g e d L o a d ( k W) X: 5.317 Y: 0.2653
15 Systems (IEA/ECBCS) [26] has published data sets referred as Annex 42 European Domestic Electrical Energy Consumption Profile based on actual data monitoring which took place between 2002 and 2005. The time interval for monitoring was 5 minutes.
Data sets of daily load (kW) at 1 minute intervals were obtained from UK Data Archive [21] for 22 dwelling in East Midlands of England between January 2008 and December 2009. Three different types of dwelling were included in the data set: detached, semi-detached and terraced with the number of occupants varying from 1 to 6. Along with these data sets, the electrical monitoring equipment available at Northumbria University were used to monitor domestic electrical demand in selected dwellings and these results were also used in this research.
2.3
Reduction of energy consumption
It is has been clear for many years that inefficient consumption of both thermal and electrical energy, derived from fossil fuel sources, has both environmental and economic effects. Thus there is a clear need to improve the energy efficiency of buildings. There are three general routes for reducing the energy consumption in the domestic sector and thereby reducing CO2 emissions [17]:
I. Minimise the heating and cooling loads by replacing the existing housing stocks with low-energy building design (i.e. reducing the energy consumption at end-use).
II. Develop and install low energy using domestic equipment (e.g. appliances, lighting and IT) and
16 The rate of demolition, new build and refurbishment are very slow which will take decades to achieve nationally significant energy savings. Replacements of domestic appliances are relatively frequent but increasing the energy efficiency of those appliances and restocking is a slow process. The application of energy labels is increasing the awareness about the energy performance of the particular appliance but the behaviour to use the appliance efficiently is hard to develop. Research is therefore needed to develop new control strategies depending upon the demand and user behaviour.
Another option would be to integrate micro-generators such as micro-CHP systems, photovoltaics, micro-wind turbine etc. along with the storage systems if necessary to displace imported electricity from the grid and to store renewable energy generation for later use.
There are many types of micro-CHP systems: Stirling Engine, internal combustion engine, fuel cell, organic Rankine cycle and gas turbine [27]. Among these, the Stirling engine micro-CHP, internal combustion micro-CHP and fuel cell are suitable for use in single dwelling [28]. A detailed review of different residential micro-CHP can be found in [29]. Table 2-1 shows a comparison of three micro-CHP technologies suitable for residential buildings. Of these, the natural gas fired micro-CHP based on Stirling engine are considered to be most suitable for domestic installation due to its high overall efficiency, low noise level and less maintenance requirements.
17 Table 2-1 Comparison of different micro-CHP technologies [27, 30]
No. Characteristics Stirling Engine IC Engine Fuel Cell 1. Noise level Low Relatively high Lowest
2. CO2 Emission Low Low but increases
with age
Low
3. Other pollutants Low High Lowest
4. Overall efficiency 70-90% 85-90% 85-90% 5. Electrical efficiency ≈ 20% (theoretical)
5-10% (practical)
20-25% Up to 50%
(theoretical) 6. H:P ratio 12:1(approx.) 3:1(approx.) 1(approx.)
7. Capital cost High Low Relatively
higher 8. Maintenance required Low Frequently Lowest
9. Life time Long Long Relatively short
10. Fuel type Natural gas or renewable fuels
Natural gas Hydrogen or natural gas 11. Start-up time Quick Quick Relatively slow 12. Load following
capability
Good Good Relatively quick
13. Market availability Soon Available Not commercial yet
2.3.1 Performance of micro-generation systems for domestic buildings
Clearly, an integrated power generating system in a building has become an important feature in recent years. However to achieve the potential benefits of such systems they must be properly designed and controlled as an integrated part of a building.
Existing prototypes of micro-CHP systems have very low electrical efficiencies, as low as 2-3% even though overall efficiency is higher (Stirling engine based micro-CHP) [2], and some are yet to be practically proven even though it has high electrical efficiency (fuel cell
18 based micro-CHP) [31]. As such, it is essential to utilise the thermal output of micro-CHP systems to meet the heat demand of the dwelling otherwise using micro-CHP systems would not be more favourable (in terms of carbon saving) than the existing systems. However, a perfect exploitation of the energy from these technologies is not an easy task because of the mismatch between the electrical and thermal demands of dwellings which varies a lot throughout the year and varies from one dwelling to another considerably. Carbon savings can be significant when micro-CHP systems are installed in appropriate applications [2]. Carbon savings from Stirling engine micro-CHP systems are reported to be higher in the dwelling with higher heat demands [2].
Much of the progress concerning the behaviour of micro-CHP systems in domestic applications has focused on comparing the seasonal economics of alternative module types [4-6] and on the measurement of the individual and comparative performances of these systems [7, 14, 32]. Barbieri, Spina, and Venturini [5] evaluated the feasibility of five different micro-CHP systems technologies for two different single family dwellings and found that energy savings can be achieved and that correct sizing of the thermal storage capacity is crucial. Regarding economic feasibility, the study showed that at present these technologies are not very attractive and that micro-CHP systems based on Stirling engine is best in almost all scenarios. Peacock and Newborough [28] studied the Stirling engine (1 kW) and fuel cell (3 kW) modules using constant effective module data and one minute recording of domestic energy demand and concluded that 25% (using 1 kW SE system) and 46% (using 3 kW FC system) of annual electrical demand of single dwelling can be supplied by micro-CHP systems. However, Paepe, et al. [33] concluded that only 10-15% of the electricity generated by 5 different types of micro-CHP modules can be used within the
19 dwelling. The difference in electrical energy used in the house could be due to the energy demand considered for the dwelling as Peacock and Newborough considered monitored one minute data in the UK whereas Paepe, et al. considered hourly data generated by the building energy analysis software for the Belgium family house and other considered parameters such as the electrical efficiency of micro-CHP (15% by Peacock and Newborough and 12% by Peape et al.) Ren and Gao[26] analysed the performance of gas engine and fuel cell based micro-CHP with minimum-cost operation and minimum-emission operation modes for residential buildings in Japan. They concluded that fuel cell micro-CHP was better option from both economic and environmental aspect. TeymouriHamzehkolaei and Sattari [34] carried out a technical and economic feasibility study of Stirling engine based micro-CHP in different climate zones of Iran. Their analysis indicated that profitability of micro-CHP system is sensitive to energy prices as well as the operation time. The fuel cells for micro-CHP have been considered in several feasibility studies and broad assessments of micro-generation. Conroy et al. [35] performed the comparative energy, economic and environmental analysis of Stirling engine based micro-CHP and found that the annual saving of €180 with an simple payback period of 13.8 years could be achieved with CO2 emissions decreased by 16.1%. Field trial carried out by Carbon Trust [2] came
with conclusions that Stirling engine based micro-CHP performed better in the households with higher thermal demands and identified the key drivers of the performance of micro-CHP systems. Key driver include reducing installed cost, targeting appropriate applications, increasing electrical efficiency and optimising installation and controls.
The general impression is that fuel cells have great potential to reduce costs and environmental impacts in this sector, but the technology is still emerging from its infancy.
20 However, the immaturity of the technology hinders such studies, limiting both the accuracy and validity of their conclusions, and preventing a more thorough and integrated analysis from being undertaken. The most notable gaps in current understanding relate to the current and future price of fuel cell micro-CHP systems, and the efficiency and durability that can be achieved in real-world use.
Building mounted micro-wind turbines and photovoltaics have the potential to provide widely applicable carbon free electricity generation. Research into wind speed estimation for the urban environment has shown that street canyons affect urban wind flow, that wind speed up over the roof ridge is only evident for isolated single buildings, that the wind
resource “seen” by a building mounted wind turbine is affected by positioning (height above roof ridge and position relative to the prevailing wind direction), that urban terrain roughness is high, and that adjacent buildings can cause wind shadow [36]. This multiplicity of factors makes it difficult to generalise a wind resource estimation methodology for the urban environment. Current methods of estimating the wind speed are reported to over predict by approximately 2 m/s [37]. Viability of micro-wind turbine varies for individual household taking into consideration of local climate condition and the surrounding. Micro-wind turbine, however, is far more complex and in comparison poorly understood. Li et al. [38] evaluated the economic viability of six micro wind turbine for Irish conditions and found that it was not economically viable to install micro-wind turbine if the wind speed of the location is lower than 5 m/s and it is more promising only when it is installed in location where wind speed is greater than 6 m/s and higher financial incentives are given for installation. Greening and Azapagic [39] evaluated the life cycle environment sustainability of micro wind turbine compared to PV and grid and the contribution micro-wind turbine can
21 have on the UK climate change targets. The result showed that the wind turbine was more
environmentally sustainable, however the contribution to the UK’s climate change targets
was very little even for the most optimistic assumptions in terms of their market penetration. Paper presented by James et al. [40] based on UK micro-wind trial under taken by the Energy Saving Trust found that performance of urban and suburban micro-wind sites was poor with annual generation of less than 75 kWh/m2 swept area, the majority of which were less than 25 kWh/m2 and good rural sites had annual generation of between 100 and 280 kWh/m2, far less than the nominal 360 kWh/m2.
For grid connected residential PV system, Pillai et al. [41] found that for most locations in the UK, cost reduction is needed to achieve near-term financial benefits and it varies depending on the location of installation. It also concluded with the importance of location specific system planning and demand-generation matching through optimal sizing of the PV system and demand side management. Li et al. [42] have shown that the unclear economics of domestic solar PV systems for Irish condition is the biggest obstacle for expanding domestic solar PV system installation in Ireland.
2.4
Modelling of micro-CHP systems with energy demands
Modelling of micro-CHP systems has received reasonable attention, however most of them are related to the proton exchange membrane fuel cell [22, 43, 44] and the solid oxide fuel cell [45]. Along with that, some models applied to assess different technologies of micro-CHP systems in terms of cost and emissions could also be found in the literature [4, 46, 47]. A detailed semi-empirical dynamic model of a domestic-scale Stirling engine micro-CHP systems has been presented by Lombardi, Ugursal, and Morrison [48], which demonstrate
22 improvements over existing models as well as a reduction in the number of experimental parameters needed. However, no attention is given in this model to the balance of system components and sub-systems (i.e. building, heating, electrical connections etc.).
Very little work has been done on the dynamic simulation of these plants including the detailed dynamic response of the local heating and electrical demand environment. Dorer and Weber [49] used a simulation modelling approach to compare two types of fuel cells, internal combustion engine and Stirling engine based micro-CHP systems at domestic scale using the modular simulation program TRNSYS. Onovwiona, Ugursal, and Fung [50], proposed a simple empirical model to simulate the performance of internal combustion engine based micro-CHP systems in building-integrated application. However most of their simulations were conducted at time intervals of 15-minutes which is adequate for capturing daily and seasonal energy profiles and mean performances but can fail to capture many of the shorter term dynamics particularly in relation to local loading changes and electrical grid interaction.
2.5
Operating strategies for micro-CHP systems
An operating strategy describes the way of operating micro-CHP systems and controlling the flow of thermal and electrical energy from the system. The purpose of controlling the micro-CHP system is to achieve specific beneficial targets for the household and the distribution network such as to reduce operating cost, decrease carbon emission and reduce the stress on the distribution network. Many feasible micro-CHP systems control strategies are limited due to the operating constraints of the prime mover technology and balance of
23 plant. A field trial of micro-CHP systems [2] has indicated that one of the key drivers of the performance of micro-CHP systems is by optimising their installation and control.
Various control options can be found in the literature and these can be summarized into two main categories: conventional and non-conventional operating strategies. Conventional operating strategies are heat-led [4, 8, 9, 51, 52] and electricity-led operating strategies [4, 51]. In a heat-led operating strategy, micro-CHP systems are controlled based on heat demand in the building. This type of strategy is mostly prominent in Stirling engine based micro-CHP systems due to its high heat to power ratio. Internal combustion engine based micro-CHP systems are also suitable for heat-led operation. Similarly, in electricity-led operating strategies micro-CHP systems are controlled based on electrical demand in the building. Fuel cell micro-CHP systems are suitable to operate in this mode, due to its lowest heat to power ratio. The idea behind these conventional strategies is to fulfil heat or electricity demand only.
The main aim of non-conventional operating strategies is to search for the optimal or near- optimal working condition of the system at each time step which can be in terms of cost or carbon emissions or efficient energy use. Online linear programming [53] and fuzzy logic operating strategy [51] for micro-CHP systems have been presented in the literature as possible operating strategies for micro-CHP in terms of reduction in operating cost and carbon emissions as compared to conventional operating strategies. Arsalis, Nielsen, and Kær [43] have also proposed an improved control strategy based on a combination of heat-led and electricity-heat-led operation, for better performance (higher efficiencies) for the Danish single-family dwellings on averaged load profile. However, these control strategies were all
24 proposed for fuel cell based micro-CHP systems taking into account domestic loads only. Operating control strategies for Stirling engine based micro-CHP systems have not been proposed yet. Along with that, supporting the grid in terms of voltage control due to the export of electricity from a high penetration of micro-CHP has also not been considered.
2.6
Effects of micro-CHP systems on distribution networks
It is very difficult to predict the future penetration level of micro-CHP systems in the LV network. An estimate of the UK market potential for SE micro-CHP systems of 13.5 million units has been made [54], and if 1 kW size of micro-CHP system is assumed, this would represent 13.5 GW of installed capacity. However, the application of different sizes and types of micro-CHP, plus deployment of those independent of gas network may ultimately result in higher installed capacity within the electricity network. Installing this higher capacity in the LV network would affect the electricity distribution system in terms of power flow and its protection system. Different studies [18, 19, 55] have investigated the effect of mass deployment of micro-CHP system of 1.1 kW upon the LV network Barbier et al. [18] have shown that voltage control is the primary issue of concern when large amounts of micro-CHPs are connected to the LV network, with penetration levels over 40% having a detrimental impact on the LV network in the worst case scenario. Other issues that could arise due to the connection of large number of micro-CHPs are increase in fault level due to its contribution to the fault current, reverse power flow when penetration levels of micro-CHP reaches 100% and voltage unbalance when penetration level exceeds 150%. A 40% penetration of micro-CHP thus means that 40% of the total households considered have 1.1kW of micro-CHP installed. For penetration higher than 100%, it is assumed that the
25
“effective” size of the CHP is increased proportionally. A 200% penetration of micro-CHP thus means that “effectively” 100% of the households have 2.2kW of micro-CHP installed.
26
Chapter 3
Distributed Generation & Storage
Systems
3.1
Introduction
A large share of greenhouse gas emission (especially CO2) is due to power generation. So,
many new sustainable technologies for electricity generation are currently under development. Many of these technologies are designed for application at the distribution level of the power network. Such small-scale electricity generation systems are referred as distributed generation (DG). Distributed generation refers to power generators that produce power from a fraction of kilowatt (kW) to tens of megawatts (50 MW) and are generally connected to the grid at the distribution levels (below 33 kV) [18]. Photovoltaic systems, wind energy conversion systems (wind turbine), combined heat and power technologies, biomass, gas turbine and small hydroelectric generators are examples of distributed generation technologies. Distributed generation can be owned and operated by utilities or individual customers. Large DG units are typically controlled and communicate with DNO like central power generating stations do. However, neither network operators nor utilities typically monitor or control the operation of small DG units, especially those in residential applications.
3.2
Small Scale Distributed Generation
From a recently published UK White Paper [56], the UK government is committed to
27 low-carbon and affordable. The aim is to provide flexible, smart and responsive electricity systems powered by a secure and diverse range of low-carbon electricity sources where demand management, storage and interconnection will help to keep the costs down. There are various types of power generating sources that could be installed in buildings and connect to the grid. Some of these technologies considered in this project are discussed below.
3.2.1 Micro-combined heat and power
The concept of combined heat and power (CHP) or cogeneration has been known for long time. Combined heat and power production is defined as “the process of producing both electricity and usable thermal energy (heat and/or cooling) at high efficiency and near the
point of use” [57]. This definition incorporates three defining elements: simultaneous production of electricity and useable heat; performance of higher total efficiency compared to separate electricity and heat generation; and location of the CHP with regards to load (or point of use) and reduced transmission losses.
The discussion on micro-CHP has recently gained momentum. However, the technology of micro-cogeneration goes back to the 18th and 19th centuries with the development of steam and Stirling engines respectively. Advancement in the technology and trend toward smaller unit size power plants have led to boosted interest in micro-CHP with the expectation to meet partial or full electrical and heat demand for individual buildings. So, micro-CHP is defined based on small energy conversion units below 15 kWel for individual building [58]
in which heat produced is used for space heating and water heating and electricity produced is used within the building or exported to the grid. Opposed to that, the EU cogeneration
28 directive [59] has defined micro-CHP as a unit with a maximum capacity below 50 kWel. Pehnt et al. [58] have given sensible reasons for limiting up to 15 kWel as micro-CHP which are: these systems are used for single-family dwellings, apartment houses, small business etc. which can be distinguished from district heating systems and no additional heat distribution grid is required and the system be connected directly to the three-phase grid.
Micro-CHP is currently in focus for domestic application so they are also termed as
‘domestic-CHP’. Different micro-CHP conversion technologies have been developed based on combustion and subsequent conversion of heat into mechanical energy, which then drives a generator for production of electricity such as Stirling engine, reciprocating engine, gas turbine etc. Alternatively, micro-CHP can be based on direct electrochemical conversion from chemical energy to electrical and heat energy such as in case of fuel cells.
Micro-CHP is operated in mainly two modes of operation: heat-led and power-led. Stirling engine and internal combustion engine based micro-CHP are suited to operate in heat-led mode, sized to meet the full heat demand of a house [27]. Whereas, fuel cell based micro-CHP has potential to operate in power-led mode sized to generate electricity constantly with the associated heat , providing small part of the overall heat demand, with a separate boiler providing the remaining heat [27]. Apart from these two modes, Newborough [8] has investigated six different modes of operation for micro-CHP taking into account the size of prime mover, length of operation per day and whether or not to charge an electricity storage bank. He did not attempt to minimize the cost of operation nor considered managing the thermal energy (assumed thermal load to be greater than micro-CHP output per day). However, these six modes of operation could be generally classified as heat-lead mode or
29 power-lead mode. Hawkes and Leach [4] looked into two main modes considering cost as main factor. He concluded that running heat-led mode may not provide the minimum cost of meeting energy demand but following heat and electricity load during winter months would provide least cost operation rather than using either heat-led or electricity-led as the only dispatch signal.
3.2.1.1 Stirling engine micro-CHP
Stirling engine micro-CHP is an emerging technology. It is an external combustion engine that utilizes heat from combustion to drive pistons. A working fluid, helium or nitrogen, expands and contracts within each cylinder by means of hot and cold heat exchanger, forcing the piston to move in and out. A transmission system converts the linear piston motion to rotation that drives an alternator. Heat is provided to the hot end of the cylinder by an external flame and cooling water removes heat from the cold piston end. The cooling water through the cold side of the piston in series with an exhaust gas heat exchanger provides the thermal output which can be used domestically. The engine and lubrication system are typically fully sealed and good designed, requiring less maintenance. Stirling engine micro-CHP can be divided into two types: crank-driven and free piston [29]. It can have many complex designs ranging from single cylinder free piston to four cylinder
‘wobble’ yoke. Most commonly, Stirling-cycle machine uses a piston cylinder in either an α or β configuration.
In an ideal Stirling-cycle engine the components of the machine interact to produce four separate thermodynamic processes. The processes are illustrated using a simplified β
-30 configured machine in Figure 3.1 and the pressure-volume and temperature-entropy diagrams are shown in Figure 3.2.
Process 1-2, Isothermal (constant temperature) expansion: the high-pressure working gas absorbs heat from the external source (via the heat absorbing heat-exchanger) and expands isothermally, thus doing work on the power-piston.
Process 2-3, Isochoric (constant volume) displacement: the displacer-piston transfers all the working gas isochorically through the regenerator to the cold end of the machine. Heat is absorbed from the gas as it passes through the regenerator, thus lowering the temperature of the gas to that of the cold space. As the temperature reduces, the gas pressure drops significantly.
Process 3-4, Isothermal compression: the power-piston does work on the gas and compresses it isothermally at cold end temperature, hence rejecting heat to the cold space (via the heat rejecting heat-exchanger). Because the gas is at low pressure, less work is required for compression than was obtained from the gas during expansion (in 1-2). The cycle therefore has a net work output.
Process 4-1, Isochoric displacement: the displacer-piston transfers all the working gas isochorically through the regenerator to the hot end of the machine. Heat is delivered to the gas as it passes through the regenerator, thus raising the temperature of the gas to that of the hot space. As the temperature rises, the gas pressure increases significantly, and the system returns to its initial conditions.
31 Figure 3.1 Thermodynamic processes in the ideal Stirling-cycle engine as shown on a simplified β-configuration machine.
![Figure 3.5 The part load efficiency for fuel cell based micro-CHP, ENEFARM [61]](https://thumb-us.123doks.com/thumbv2/123dok_us/10959170.2984260/56.918.169.800.249.812/figure-load-efficiency-fuel-cell-based-micro-enefarm.webp)
![Table 3-1 Benefits of distributed generations [73]](https://thumb-us.123doks.com/thumbv2/123dok_us/10959170.2984260/65.918.161.819.690.1083/table-benefits-of-distributed-generations.webp)

![Figure 5.1 Micro-CHP system test rig [102]](https://thumb-us.123doks.com/thumbv2/123dok_us/10959170.2984260/98.918.182.807.170.666/figure-micro-chp-system-test-rig.webp)


