CAViz, an Interactive Graphical
Tool for Image Mining
Nguyen-Khang Pham
1,2, Annie Morin
1and Patrick Gros
11IRISA, Campus de Beaulieu, Rennes Cedex, France 2Cantho University, Cantho City, Vietnam
We propose an interactive graphical tool, CAViz, which allows us to display and to extract knowledge from the results of a Correspondence Analysis CA on images. CA is a descriptive technique designed to analyze simple two-way and multi-way tables containing some measure of correspondence between the rows and columns. CA is very often used in Textual Data Analysis(TDA)where the contingency table crosses words and documents. In image mining, the first step is to define “visual” words in images(similar to words in texts). These words are constructed from local descriptors(SIFT, Scale Invariant Feature Transform)in images. Our tool CAViz is inter-active, and it helps the user interpretating the results and the graphs of CA. An application to the Caltech4 base
[15]illustrates the interest of CAViz in image mining.
Keywords: correspondence analysis, image mining, vi-sualization
1. Introduction
Data mining [5] intends to extract useful hid-den knowledge from the large datasets in a given application. This usefulness relates to user goal. In other words, only a user can deter-mine whether the resulting knowledge answers his goal. Therefore, data mining tools should be highly interactive. We want here to increase human involvement through interactive visual-ization techniques in data-mining environment. In the past years, many visual methods develo-ped in different domains have been used for data exploration and knowledge extraction pro-cess[6],[11]. The visual methods are used for data selection at the pre-processing step or at the post-processing step to view the results. Some recent visual data mining methods[1],[4]try to involve more intensively human factors in the
data mining step through visualization. The ef-fective cooperation can bring some advantages such as using the domain knowledge during the model construction, improving the confidence and comprehensibility of the obtained models, using the human pattern recognition capabilities in model exploration and construction.
Our goal is to explore the results of a Corres-pondence Analysis (CA) [2], [8] et [9]. In textual data analysis, the Bi-Qnomis tool [14]
developed by M. Kerbaol allows to visualize the results and to find relevant topics in a text corpus analyzed by a CA. The projections of the cloud of row-profiles(documents)and the cloud of column-profiles (terms/words) take place onto any low-dimensional subspace, in general a two-dimensional one, usually with the first principal axes. For each side of each axis, a list of words(called metakey)whose contribu-tions to inertia are large, generally three times the average contribution by word or/and docu-ments, is defined. Total inertia on an axis is equal to the corresponding eigenvalue; so the threshold is easy to compute. We display on the same graph the metakeys and the titles of the documents with high contributions. We can click on the title of the document to get immedi-ately the plain text. When examining metakeys and/or documents, an expert can summarize the content of these documents. Bi-Qnomis sup-ports also a visualization of metakeys using a hyperbolic tree.
allocation) [17]have been applied to images, to perform either image classification [16], topic discovery in the image[15], scene classification
[3], or image retrieval[18].
This paper will focus on adapting CA to im-ages and on the interpretation of its results us-ing relevant indicators through a visualization tool, in which the user can interactively explore the results to better understand them. The arti-cle is organized as follows: we briefly describe the CA method and how to build an appropri-ate contingency table with images in Section 2. Section 3 presents interactive knowledge ex-traction from the CA results. We conclude with some perspectives for this work.
2. Correspondence Analysis on Images 2.1. CA
CA is a classical exploratory method for the analysis of contingency tables. It was proposed first by J. P. Benz´ecri[2]in a linguistic context, i.e. textual data analysis. Theoretical develop-ments and various applications can be found in
[8] and[9]. CA on a table crossing words and documents (texts or images)allows answering the following questions: is there any proximity between certain words? Is there any proximity between certain documents? Is there any link between certain words and certain documents? Like most factorial methods, CA uses a singu-lar value decomposition of a particusingu-lar matrix and translates two-way tables into more read-able graphical forms in low-dimensional space. One fundamental concept of CA is that of a profile which is a set of frequencies divided by their total. In analyzing a frequency table, we can look at the relative frequencies for rows or for columns, called row or column profiles respectively. Each row (resp. column) has its own mass. And these masses are proportional to the marginal sums of the table. If the table has r rows and c columns, each row(resp. col-umn)profile can be represented in a(c 1) (resp.
(r-1)) dimensional space. The inertia of the row-profiles cloud and the inertia of the column profiles cloud are both equal to the chi-square statistics of the two-table divided by the total number of observations.
In most applications, the table of interest has many rows and columns. So r and c are large and it becomes necessary to reduce the dimen-sionality of the points. The objective of CA is
to discover the subspaces where the clouds of projected row(resp. column)profiles have the largest inertia. This is done through a SVD. The accuracy of display is measured by the percen-tage of inertia of the projected profiles related to the original cloud inertia. In addition, CA provides relevant indicators for the interpreta-tion of the axes which define a subspace. The contribution of a word or a document to the in-ertia of the axis, or the representation quality of a word and/or document on an axis[14], is one of these indicators.
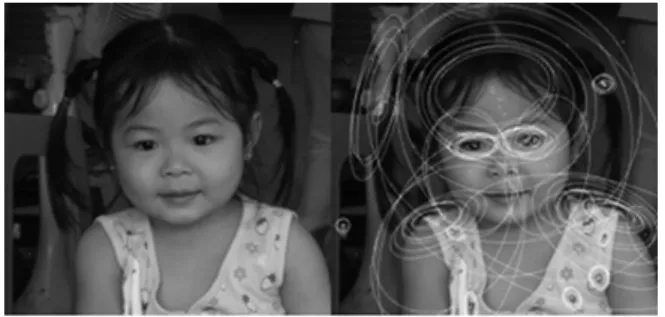
Figure 1.Interest point detected by Hessian-affine detector.
2.2. Construction of Visual Words and Images Representation
In order to adapt CA to images, we must re-present the image corpus in the form of contin-gency table. Here images are treated as docu-ments and the “visual words”(to be defined)as terms/words. The words in the images, called visual words, must be calculated to form a vo-cabulary ofNwords. Each image will be finally represented by a word histogram. The construc-tion of visual words is processed in two steps:
(i) computation of local descriptors for a set of images,
(ii)clustering of the previous descriptors, gene-rally by a K-means.
Each cluster will define a visual word. There would thus be as many words as clusters ob-tained at the end of step(ii). The local descrip-tor computation in an image is also done in two stages.
1) We first detect the interest points in the ima-ge(Figure 1). These points are either maxi-mums of Laplace of Gaussian[19]or 3D lo-cal extremes of Difference of Gaussian[20]
2) Then, the descriptor of the interest points is computed on the gray level gradient of the region around the point. The rotation and scale invariant descriptor, SIFT [12]is usu-ally preferred. Each descriptor SIFT is a 128 dimension vector. This second step is to form visual words from the local descrip-tors computed in the previous step. In most cases, we perform ak-means on descriptors and take the averages of each cluster as vi-sual word [3], [15], [16]. The visual word is of course very different from a real word. And a list of visual word will be more diffi-cult to interpret than a list of real word which generally defines a topic.
After building the visual vocabulary, all descrip-tors are assigned to their nearest cluster. For this, we compute distances, in R128, from each descriptor to representatives of previously de-fined clusters. An image is then characterized by the frequency of its descriptors. The image corpus will be represented by a contingency ta-ble crossing images and clusters and a cell(i,j)
contains the number of descriptors of the image I assigned to the cluster j.
3. Interactive Exploration of CA Results
3.1. Projection on Factorial Plan
In CA, visual words and images are displayed on the same plane. Here, a dot “image” is dis-played as a red square; and a dot “word” as a blue square To help the user for interpretation, the screen is divided into two parts: the projec-tion of images and/or visual words on the left, and the right part is reserved to display some selected images. The user can select one or a group of images by pointing on it. All the images found in a neighborhood of radiusr of the interesting image will be displayed on the right of the screen. The points corresponding to the selected images will have another color
(from red to green). The visual words(in the form of an ellipse)will be also drawn on the im-ages. The selected images are listed on the right hand side. This gives us immediately a general summary of the content of these images. For focusing on the images and/or interest-ing words, we display only the images and/or words whose contributions to inertia are high,
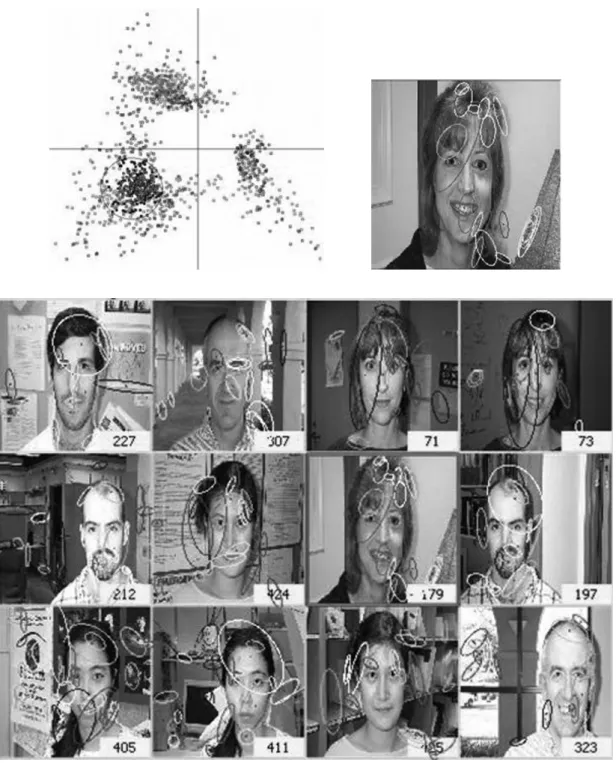
usually 2 or 3 times the average contribution. The total inertia on one axis is equal to the eigenvalue associated to this axis. The thre-shold is easy to determine. Figure 2 shows the projection of the Caltech4 base[15]on the axes 1 and 2 with the threshold equal to 2 times the average. Mr. Kerbaol calls metakeys groups of words whose contribution is very high on one side of an axis. We therefore have 2 metakeys by an axis, a positive one and a negative one. The words belonging to each metakey will be displayed on the correspondent image.
In Figure 3, we have metakeys and their visual words. The images located at each end of the axes display a metakey. The image on the upper left is superimposed with visual words close to it, that means the ones inside the circle around the image. It is easy to see that most of these words are found in both the left metakey and the bottom metakey.
Figure 3.Visualization of metakeys.
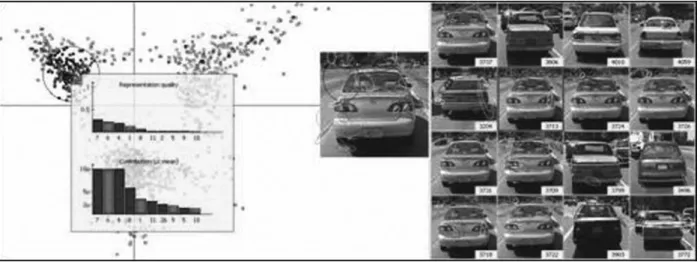
Interesting information on an image is interac-tively extracted by selecting the image. There are two relevant indicators for interpreting the CA results: the representation quality on the one hand and the contribution to the inertia on the other hand. This information will assist us in some subsequent tasks. Figure 4 shows an ex-ample of the interactive information extraction. The image in this example is well represented by the axis 2 (negative part), 3 (negative), 18
(negative), 12 (positive). . . and it contributes greatly to the inertia of axes 2, 18, 3, 12. . .
Figure 4.Image information extraction: hist. of representation quality on axes and hist. of contribution
to inertia of axes of an image(red: positive, blue: negative.
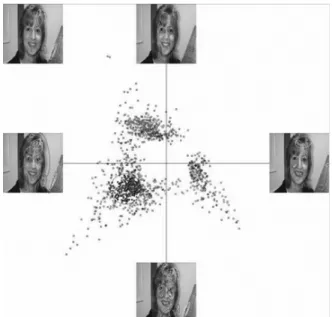
One of advantages of CA is a double repre-sentation of documents and words on the same factorial plan. The words close to an image well characterize this image. It is easy to visualize words well characterizing an image or an image group (correspondent to a topic) by selecting the image and displaying the words close to this image. CAViz allows to show the words well representing a given topic(Figure 5).
3.2. Image Display and Knowledge Extraction
Figure 5.The words characterizing the topic “face”.
3.2.1. Quality of Displayed Images
CAViz allows the user to display the informa-tion about the quality of axes. We set the origin of an axis at the gravity center of the cloud. The quality of a projected point i (image i) on the axisjis the square cosine of the angle between the original point iand its projection on axisj. If the square cosine is close to 1, that means that the position of the projected point is close
3.2.2. Dual Views
CAViz displays the points on the left part and the selected images on the right part. Clicking on an image on the right the point corresponding on the left is also selected and its information is showed. The dual view allows us to select easily interesting images. The human visual perception is a good tool for pattern recogni-tion. We select the similar images on the right hand side and look at their information on the left. If we find that there are the same axes which well represent the selected images, we will take these axes and project the points on them.
3.2.3. Image Topic Discovery
Here we give a case study about topic discovery in Caltech4 database(Sivic et al., 2005)drawn from the Caltech101 database[7]. This database contains 4090 images divided into 5 categories. Table 1 describes this database.
Category Number of images
Faces 435
Motorbikes 800
Airplanes 800
Backgrounds 900 cars(rear) 1155
Table 1.Description of the Caltech4 database.
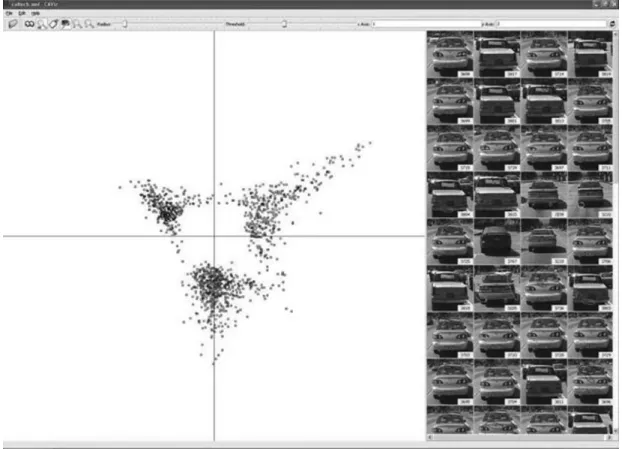
First a CA is applied on images. We then project the clouds onto the first factorial plan and
se-lect the group on the left(cars category). The selected images are displayed on the right part of the screen. We are beginning to select im-ages by clicking on the right and looking at their representation quality on axes. We found that there were images that are well represented by the axes 6(negative)and 7(positive) (Figure 6)
and there were many images well represented by the axes 11(negative)and 12(positive). Pro-jecting the point clouds on these axes, we found some finer topics which include very similar images.
Projecting on the axes 6 and 7, we found that there was a point group on the top left(axis 7 – positive and axis 6 – negative). We selected this group and looked at the images displayed on the right part: these images are very similar
(they are white cars, Figure 6).
In addition, there is also another group on the bottom left. We do the same thing as the pre-ceding group and find another topic(red cars)! Similarly, on the axes 11 and 12, there is another topic for cars.
4. Conclusion and Future Works
In this article we have presented a graphical tool, called CAViz, which visualizes the results of the CA on images. This tool helps users to extract knowledge, to interpret the CA results. We have also shown an application on the image topic discovery in the Caltech4 database. The topics obtained in this study show the value of CAViz for interpreting the CA using indicators such as representation quality and contribution to inertia.
Some improvements will be useful such as a quick search of important axes for an image group and flexibility in the selection of images. To these ends we can extract information from the group’s gravity center; use a rectangle, el-lipse or an arbitrary shape instead of a circle. One of the possible developments of this method is the construction of a system that would fa-cilitate the exploration, navigation, and image labeling by integrating visual information and other information associated with the images.
5. Acknowledgments
We would like to thank A. Zisserman for Cal-tech4 database and F. Poulet for useful discus-sions.
References
[1] M. ANKERST, M. ESTER AND H-P KRIEGEL, To-wards an effective cooperation of the computer and the user for classification.Proceedings of KDD’00, 6th ACM SIGKDD, 2000. pp. 179–188.
[2] J. P. BENZECRI, L’analyse des correspondances.´ Paris: Dunod, 1973.
[3] A. BOSCH, A. ZISSERMAN ANDX. MUNOZ, Scene classification via plsa.Proceedings of the European Conference on Computer Vision. 2006.
[4] T-N. DO ANDF. POULET. Enhancing svm with visu-alization. Discovery Science 2004, E. Suzuki et S. Arikawa Eds. 2004. pp. 183–194.
[5] U. FAYYAD, G. PIATETSKY-SHAPIRO ANDP. SMYTH. From data mining to knowledge discovery in databases.AI Magazine1996; 17(3): pp. 37–54.
[6] U. FAYYAD, G. GRINSTEIN ANDA. WIERSE Informa-tion VisualizaInforma-tion in Data Mining and Knowledge Discovery. Morgan Kaufmann Publishers; 2001.
[7] R. FERGUS, P. PERONA ANDA. ZISSERMAN, Object Class Recognition by Unsupervised Scale-invariant Learning.In Proceedings of the IEEE Conference on Computer Vision and Pattern Recognition2003. pp. 264–271.
[8] M. J. GREENACRE, Theory and Applications of Cor-respondence Analysis Wiley; 1984.
[9] M. J. GREENACRE, Correspondence Analysis in Practice, Second Edition, Chapman & Hall/CRC, London; 2007.
[10] T. HOFMANN, Probabilistic latent semantic analysis.
Proceedings of the 15th Conference on Uncertainty in Artificial Intelligence(UAI’99); 1999.
[11] D. KEIM, Information visualization and visual data mining. IEEE Transactions on Visualization and Computer Graphics 2002; 8(1): pp. 1–8.
[12] D. G. LOWE, Distinctive image features from scale-invariant keypoints,International Journal of Com-puter Vision 2004; 60(2): pp. 91–110.
[13] K. MIKOLAJCZYK ANDC. SCHMID. Scale and affine invariant interest point detectors. In Proc. IJC V; 2004; 60(1): pp. 63–86.
[14] A. MORIN, Intensive Use of Correspondence Anal-ysis for Information Retrieval,Proceedings of the 26th International Conference on Information Tech-nology Interfaces; 2004 Jun 19–22; Cavtat, Croatia. Zagreb: SRCE University Computing Centre, Uni-versity of Zagreb; 2004. pp. 255–258.
[15] J. SIVIC, B. C. RUSSELL, A. A. EFROS, A. ZISSERMAN ANDW. T. FREEMAN. Discovering object categories in image collections.Proceedings of the Interna-tional Conference on Computer Vision. 2005.
[16] J. WILLAMOWSKI, D. ARREGUI, G. CSURKA, C. DANCE AND L. FAN. Categorizing nine visual classes using local appearance descriptors. Work-shop Learning for Adaptable Visual Systems (ICPR 2004)Cambridge, United Kingdom. 2004.
[17] D. M. BLEI, A. Y. NG ANDM. I. JORDAN. “Latent dirichlet allocation”,Journal of Machine Learning Research, 2003; 3: pp. 993–1022, 2003.
[18] R. LIENHART, M. SLANEY. “PLSA on Large Scale Image Databases”, Proceedings of IEEE Interna-tional Conference on Acoustics,Speech and Signal Processing, Vol. 4, 2007. pp. 1217–1220.
[19] T. LINDEBERG “Feature detection with automatic scale selection”,International Journal of Computer Vision, 1998; 30(2): pp. 79–116.
[20] D. G. LOWE, “Object Recognition from Local Scale-invariant Features”, Proceedings of International Conference on Computer Vision, 1999. pp. 1150– 1157.
Received:June, 2008
Accepted:September, 2008
Contact addresses:
Nguyen-Khang Pham IRISA, Campus de Beaulieu F-35042 Rennes Cedex, France Cantho University, Campus III 1 Ly Tu Trong, Cantho City, Vietnam e-mail:[email protected], [email protected]
Annie Morin IRISA, Campus de Beaulieu F-35042 Rennes Cedex, France e-mail:[email protected]
NGUYEN-KHANGPHAMholds a MSc in computer science from the In-stitute of French Speaking for Informatics in Hanoi(Vietnam). He is currently a PhD student at IRISA, France. Nguyen-Khang is a lecturer at the College of Information Technology of CanTho University( Viet-nam)where he teaches image processing. His current research focuses on the information retrieval using correspondence analysis.
ANNIEMORINgot a PhD degree from the University of Rennes in 1989. She is associate professor in the Computer Science Department of the University of Rennes, France. Her areas of expertise include data anal-ysis, clustering and classification, and text mining. More precisely, she works on image and text retrieval using factorial analysis methods. She is on the programme committee of several international conferences and manages several cooperation programs with Japan, Croatia(University of Zagreb)and Slovenia(University of Ljubljana)on multimedia(texts or/and images)indexing.