Hungarian Association of Agricultural Informatics European Federation for Information Technology in Agriculture, Food and the Environment
Journal of Agricultural Informatics. Vol. 9, No. 2 journal.magisz.org
A novel technique for fast determination of K in partitioning cluster analysis
Zeynel Cebeci1, Cagatay Cebeci2
I N F O
Received 6 Mar 2018 Accepted 10 May 2018 Available on-line 18 Jun 2018 Responsible Editor: M. Herdon
Keywords:
cluster analysis, partitioning clustering, initialization of clustering, number of clusters, k selection.
A B S T R A C T
The input argument k refers to the number of clusters is needed to start all of the probabilistic and possibilistic partitioning algorithms. Although some progress has been made toward its solution, determining this user-specified argument is still one of the main issues in partitioning cluster analysis. Therefore, fast and even automated techniques are needed for determining k in partitioning clustering. In this paper, for determination of k, we proposed the KPEAKS, a simple and fast technique based on the descriptive statistics of peak counts of the features for clustering multidimensional datasets. The experiments on the synthetic and real datasets revealed that the mean of the largest two peak counts and the mean of third quartile and maximum peak count of the features can be successfully used for the estimates of k.
1. Introduction
The enormous expansion of agricultural activities and practices based on the information technologies such precision agriculture, sensory networks, RFID etc. leaded to collect the large amount of data in agriculture. Therefore data mining and big data analytics become more popular in agriculture today as well as in other areas. Clustering is one of the widely applied data mining techniques because of its usefulness in discovering the meaningful information such as the grouping structures and patterns in datasets. Clustering divides the instances in datasets into subsets called clusters by using the proximity measures (Liu et al 2010). According to a common taxonomy, it is possible to categorize them into three groups as hierarchical methods, partitioning methods and hybrid methods. Among them, the partitioning algorithms such as well-known K-means and Fuzzy C-means and their variants are preferred in clustering large volume of multidimensional numerical data because of their higher computational efficiencies.
Although the partitioning algorithms provide some significant advantages in clustering, they also have some disadvantages since they require a set of user-specified input arguments. However, the number and types of these arguments vary from one algorithm to another, most of the partitioning algorithms require k, an input argument specifying the number of partitions (or clusters) in datasets (Pakhira 2012). Using different k values results with different partitions, and thus, it has direct effect on the quality or validity of the final clusters. So, the choice of an appropriate value of k is one of the most important topics in partitioning clustering analysis (Ray & Turi 1999, Celebi et al 2013).
In order to determine the k, various subjective and objective methods have been proposed in the literature. In the subjective methods the value of k is determined as a priori by users. Hence, a good level of domain knowledge and experience is required with the subjective methods. On the other hand, setting it by the objective methods is mainly based on time-consuming trial and error experiments. In these experiments, a suitable clustering algorithm must be run for several times with the different values of k. At the end ofthese runs, the number of partitions which produces the best clustering result is determined by using some validity indices. Due to their computational costs, the objective methods seem impractical
1 Zeynel Cebeci
Div. of Biometry & Genetics, Faculty of Agriculture, Çukurova University, 01330 Adana - Turkey
2 Cagatay Cebeci
Dept. of Electronic & Electrical Eng., Technology and Innovation Centre, Univ. of Strathclyde, Glasgow-UK
for suggesting an optimal value of k especially on the real datasets that are often quite very big. Moreover, the validity indices may be sensitive to the volumes, shapes and orientations of cluster structures in the datasets.
As discussed above, deciding an optimal value of k is a common problem for all partitioning clustering algorithms although some progress has been made. For this reason, one of the most studied research topics on cluster analysis is on the choice of k. We need algorithms that will yield faster and computationally low cost solutions as datasets grow even more complex in terms of both data volume and dimensionality. Additionally, since there are differences in the information provided by the algorithms, it is not expected that the validity indices perform the same for all the clustering algorithms. Therefore, it may be necessary to use different algorithm-specific indices or robust methods that are not much influenced by cluster structures. It should be noted again that finding out a number of possible partitions and then validating them by using a validity measure is a very time consuming task. Therefore, we need the techniques giving the estimates of k before applying a clustering algorithm.
In this study, a novel technique, so-called “Determination of K Using Peak Counts of Features for Clustering” or shortly KPEAKS, is proposed for fast determination of k. The technique is based on some descriptive statistics of peak counts of the features which are found by a peaks counting algorithm. This paper is organized in different sections such that Section 2 provides the related works, Section 3 describes basic Fuzzy C-means algorithm used as a representative of partitioning clustering algorithms, Section 4 introduces the proposed technique, Section 5 discusses the performance of the proposed technique on some experimental datasets, and finally, Section 6 concludes the current study and future works.
2. Related Works
Since the partitioning algorithms produce a valid or invalid result with any value of k, the quality of clustering depends on the optimal choice of this input parameter. Thus, before partitioning, the number of clusters in a dataset should be determined or estimated for achieving the quality results. The value of k can be determined with the subjective and objective methods. In general, the subjective methods are based on heuristic approaches to understand the underlying structure of the datasets by means of various exploratory graphs (Hamerly & Elkan 2004). In this case, some degree of previous experience and domain knowledge are needed (Morissette & Chartier 2013). The subjective methods may result with poor quality clustering since the clustering algorithms may produce different results depending on the shapes and orientations of the clusters in datasets (Kodinariya & Makwana 2013). Additionally, using the subjective methods to choose k is exceedingly difficult and time consuming task for high dimensional data.
Objective methods mainly include the validity indices which have been primarily proposed to validate the quality of clustering results, but they can also be utilized to determine the value of k. These indices can be classified into three groups as the external, internal and relative indices (Kovács et al 2005, Rendón et al 2011). The external indices use some kind of external information associated with data instances. They compare the cluster labels found in a clustering analysis to the already known class labels, which can be used as the external information for deciding to an appropriate k value (Dudoit & Fridlyand 2002). In practice, since the external information is often not available with data, the internal validity indices are become the only applicable options. They are the validation criteria that reveal the quality of the clustering by using results obtained directly from datasets themselves (Thalamuthu et al 2005). Finally, the relative indices are the validity measures based on comparisons of clustering results by running one or more clustering algorithms with different input parameters on the same dataset. For instance, the best partitioning is determined by comparing the objective function values which are calculated in multiple runs of a clustering algorithm.
external validity indices introduced in the literature (Halkidi et al 2001, Rendón et al 2011, Charrad et al 2015).
There are differences in the information provided by clustering algorithms, and hence, it is not expected that all validity indices can perform in the same way in all of the clustering algorithms. For example, fuzzy and possibilistic clustering algorithms produce fuzzy membership degrees instead of crisp membership degrees, and therefore, more sophisticated internal indices may be necessary for validating their results (Wang & Zhanga 2007). Although various fuzzy indices do exist in the literature (Schwämmle and Jensen, 2010), the indices of Partition Entropy, Partition Coefficient (Bezdek 1974), Modified Partition Coefficient (Dave 1996), Xie-Beni (Xie & Beni 1991), Tang-Sun-Sun (Tang, Sun & Sun 2005), Chen-Linkens (Chen & Linkens 2004) and Pakhira-Bandyopadhyay-Maulik Fuzzy (Pakhira et al 2004) are often used to validate the results in fuzzy environments. These indices use membership degrees and cluster centroids obtained as a result of clustering task, and dataset itself with some indices.
In order to determine k, another approach tries to find the best one among all possible values with model choice via penalization by designing an appropriate penalty shape and derive an associated oracle-type inequality as proposed by Fischer (2011). The composite indices based on sensitivity and uncertainty analysis techniques, which can be used together with several cluster validity indices, have been also proposed (Marozzi 2014, Saisana et al 2005).
Apart from the validity indices, the information criteria such as Akaike Information Criterion (AIC) and Bayesian Information Criterion (BIC), and some other criteria such as Minimum Description Length (MDL) and GAP statistics can also be used for determining the argument k. Recently, the techniques such as the Visual Assessment of Clustering Tendency (VAT) (Bezdek & Hathaway, 2002, Bezdek et al 2007) and an improved version of VAT (iVAT) (Havens & Bezdek 2012) have been proposed for visual determination of k. In addition to these, Dark Block Extraction (DBE) and Cluster Number Extraction (CCE) using the visual outputs of VAT matrices are the examples of the automated techniques for determining k (Pakhira 2012). Visual Assessment of Cluster Tendency Using Diagonal Tracing (VATdt) (Hu 2012) and spectral VAT (spectVAT) (Krishnamoorthi 2011) are other recently proposed algorithms in determination of k.
Although many validity indices are available to determine k, some of them are very complex to implement and some others may be computationally expensive for large datasets in many real-world applications because they require the clustering results from several runs of the algorithms. Whereas, the simpler and faster methods that can determine k before cluster analysis can contribute to a remarkable decrease in computational cost in partitioning cluster analysis. In Section 4 of this paper, as a new member of this kind of techniques, a novel technique enabling the fast determination of k is proposed.
3. Fuzzy C-means Clustering Algorithm
In the literature, the choice of k has mainly been worked for hard partitioning cluster algorithms with a special reference to K-means and its derivatives. In this paper, for testing the performances of the studied techniques we used the basic Fuzzy C-means Clustering (FCM) algorithm (Bezdek 1981) as the representative of partitioning clustering algorithms. As one of the most widely used soft clustering algorithms, FCM differs from hard K-means algorithm with the use of weighted squared errors instead of using squared errors only. Therefore, the proposed technique in this paper can be applied not only for FCM but also for all hard, fuzzy, possibilistic clustering algorithms and their variants in the same way. In this section, we briefly introduce the basic terminology and FCM algorithm for easy understanding the studied techniques in the paper.
Let 𝑿𝑿= {𝒙𝒙1,𝒙𝒙2, … ,𝒙𝒙𝑛𝑛}∈ ℝ𝑛𝑛𝑛𝑛be a dataset to be analysed, where n is the number of instances, 𝑝𝑝 is the number of features. For dataset X, FCM tries to minimize the objective function in Eq. (1).
𝐽𝐽𝐹𝐹𝐹𝐹𝐹𝐹(𝑿𝑿; 𝑼𝑼,𝑽𝑽) = ∑𝑛𝑛𝑖𝑖=1∑𝑘𝑘𝑖𝑖=1𝑢𝑢𝑚𝑚𝑖𝑖𝑖𝑖𝑑𝑑𝑖𝑖𝑖𝑖𝑨𝑨2 (1)
The membership matrix 𝑼𝑼 with 𝑛𝑛×𝑘𝑘 dimension, where k is the number of clusters, is a fuzzy partition of dataset 𝑿𝑿as shown in Eq. (2).
𝑼𝑼=�𝑢𝑢𝑖𝑖𝑖𝑖� ∈ 𝑀𝑀𝐹𝐹𝐹𝐹𝐹𝐹 (2)
𝑽𝑽= {𝒗𝒗1,𝒗𝒗2, … ,𝒗𝒗𝑐𝑐}, 𝒗𝒗𝑖𝑖∈ ℝ𝑘𝑘𝑛𝑛 (3)
In Eq. (1), 𝑑𝑑𝑖𝑖𝑖𝑖𝑨𝑨2 is the distance between ith data instance and the prototype of jth cluster. It is computed using a squared inner-product distance norm in Eq. (4):
𝑑𝑑𝑖𝑖𝑖𝑖𝑨𝑨2 =�𝒙𝒙𝑖𝑖− 𝒗𝒗𝑖𝑖�𝑨𝑨2 = (𝐱𝐱𝑖𝑖− 𝐯𝐯𝑖𝑖)𝑇𝑇𝑨𝑨(𝒙𝒙𝑖𝑖− 𝒗𝒗𝑖𝑖) (4)
In Eq. (4), 𝑨𝑨 is a positive and symmetric norm matrix, and the inner product with norm 𝑨𝑨 is a measure of distances between data points and cluster prototypes. When 𝑨𝑨 is equal to 𝑰𝑰,𝑑𝑑𝑖𝑖𝑘𝑘𝑨𝑨2 is obtained in squared Euclidean norm. In Eq. (1), 𝑚𝑚 is a fuzzifier parameter (or weighting exponent) whose value is chosen as a real number greater than one (𝑚𝑚 ∈[1,∞), usually it is 2 in the literature). While m approaches to one, clustering tends to crisp like K-means but when it approaches to the infinity clustering becomes more fuzzified. The objective function JFCM is minimized using the update formulas in Eq. (8) and (9)
in each iteration step with the constraints in Eq. (5), (6) and (7):
𝑢𝑢𝑖𝑖𝑖𝑖 ∈[0,1]; 1≤ 𝑖𝑖 ≤ 𝑛𝑛, 1≤ 𝑗𝑗 ≤ 𝑘𝑘 (5)
∑𝑘𝑘𝑖𝑖=1𝑢𝑢𝑖𝑖𝑖𝑖 = 1; 1≤ 𝑖𝑖 ≤ 𝑛𝑛 (6)
0 < ∑𝑛𝑛𝑖𝑖=1𝑢𝑢𝑖𝑖𝑖𝑖 <𝑛𝑛; 1≤ 𝑗𝑗 ≤ 𝑘𝑘 (7)
FCM stops when the iteration counts has reached to a predefined maximum iteration counts, or when the difference between the sums of membership values in U obtained two consecutive iterations is less than a predefined convergence value (𝜀𝜀). The steps involved in FCM are:
1. Initialize the prototype matrix 𝑽𝑽 and the membership matrix 𝑼𝑼. 2. Update the cluster prototypes by using Eq. (8).
𝒗𝒗𝑖𝑖=∑ 𝑢𝑢𝑖𝑖𝑖𝑖
𝑚𝑚𝒙𝒙 𝑖𝑖 𝑛𝑛 𝑖𝑖=1
∑𝑛𝑛𝑖𝑖=1𝑢𝑢𝑖𝑖𝑖𝑖𝑚𝑚 ; 1≤ 𝑗𝑗 ≤ 𝑘𝑘 (8)
3. Update the membership values by using Eq. (9). 𝑢𝑢𝑖𝑖𝑖𝑖(𝑡𝑡)= 1
∑𝑖𝑖𝑖𝑖=1�𝑑𝑑𝑖𝑖𝑖𝑖𝑨𝑨/𝑑𝑑𝑙𝑙𝑖𝑖𝑨𝑨�2/(𝑚𝑚−1)
; 1≤ 𝑖𝑖 ≤ 𝑛𝑛 , 1≤ 𝑗𝑗 ≤ 𝑘𝑘 (9)
4. If �𝑼𝑼(𝑡𝑡)− 𝑼𝑼(𝑡𝑡−1)�<𝜀𝜀 then stop else go to the step 2, where 𝑡𝑡 is the iteration number.
4. Determination of K Using Peak Counts
The proposed technique, so-called “K-selection Using Peak Counts” or shortly KPEAKS, is based on some descriptive statistics of the peak counts of features by using a peaks counting algorithm. The steps involved in the technique KPEAKS are listed as follows:
1. Draw the histogram of ith feature in the dataset with the breaks which are computed by using a
binning rule, i.e. Sturges and Scott or an arbitrary specified integer (Cebeci & Yildiz, 2017). 2. Run the peak finding algorithm with input arguments which are middle values and frequencies
of the bins of the histogram obtained in step 1.
3. Count the peaks of ith feature in the analysed dataset, and add the obtained count into f, the peak
counts vector.
4. Repeat the steps 1-3 in order to count the peaks of all of the features in the dataset. 5. Calculate the descriptive statistics from the full set of peak counts in the vector f.
6. Build a reduced set of peak counts by removing the peak counts smaller than a predefined threshold value of peak counts (usually 1).
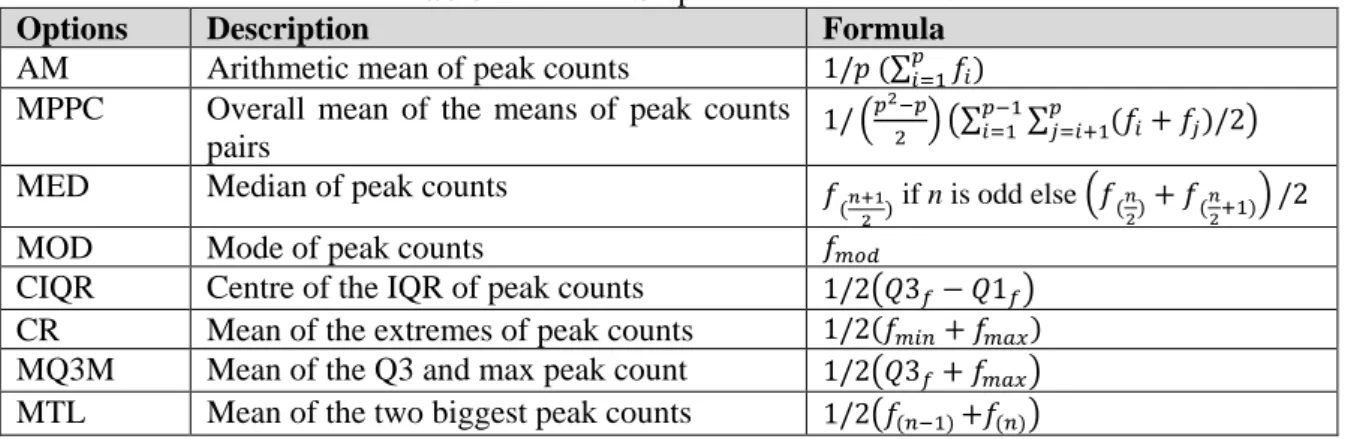
7. Calculate the estimates of k on the full and reduced sets of peak counts by using the formulas in Table 1.
8. Return the list of estimates of k obtained in step 7.
range (IQR) while KPEAKSCR is simply the centre of range (R), or, in other words, the mean of extreme values. Finally, KPEAKSMQ3M is the mean of the third quartile (Q3) and maximum of peak counts, and KPEAKSMTL is the mean of two largest peak counts.
Table 1. KPEAKS options to determine k
Options Description Formula
AM Arithmetic mean of peak counts 1/𝑝𝑝 (∑ 𝑓𝑓𝑛𝑛𝑖𝑖=1 𝑖𝑖) MPPC Overall mean of the means of peak counts
pairs 1/�
𝑛𝑛2−𝑛𝑛
2 � �∑ ∑ (𝑓𝑓𝑖𝑖+𝑓𝑓𝑖𝑖)/2 𝑛𝑛
𝑖𝑖=𝑖𝑖+1 𝑛𝑛−1
𝑖𝑖=1 �
MED Median of peak counts 𝑓𝑓
(𝑛𝑛+12 ) if n is odd else �𝑓𝑓(𝑛𝑛2)+𝑓𝑓(𝑛𝑛2+1)�/2
MOD Mode of peak counts 𝑓𝑓𝑚𝑚𝑚𝑚𝑑𝑑
CIQR Centre of the IQR of peak counts 1/2�𝑄𝑄3𝑓𝑓− 𝑄𝑄1𝑓𝑓� CR Mean of the extremes of peak counts 1/2(𝑓𝑓𝑚𝑚𝑖𝑖𝑛𝑛+𝑓𝑓𝑚𝑚𝑚𝑚𝑚𝑚) MQ3M Mean of the Q3 and max peak count 1/2�𝑄𝑄3𝑓𝑓+𝑓𝑓𝑚𝑚𝑚𝑚𝑚𝑚� MTL Mean of the two biggest peak counts 1/2�𝑓𝑓(𝑛𝑛−1)+𝑓𝑓(𝑛𝑛)�
*The indices between parentheses denote the order statistics of the peak counts.
Algorithm 1: findpolypeaks Input:
xc, vector for the frequencies of classes of a frequency polygon
xm, vector for the middle values of classes of a frequency polygon
tc, threshold frequency value for filtering frequency polygon data, default value is 1
Output:
PM: Peaks matrix for a feature
Init:
1: xmxm[xc >= tc] ; xcxc[xc >= tc] //Filter xm and xc for the class frequencies >= tc
2: pfreqs {} //Vector for the frequencies of peaks 3: pvalues {} // Vector for the values of peaks 4: nc length of xc //Number of classes (bins) 5: pidx1 //Index of the first peak
Run:
6: IF nc > 1 THEN
7: IFxc[1] > xc[2] THEN
8: pvalues[1]xm[1] ; pfreqs[1]xc[1] 9: pidx2
10: ENDIF
11: FORi = 2 to nc-1DO
12: IFxc[i] not equal to xc[i-1] THEN
13: IFxc[i] > xc[i-1] AND xc[i] >= xc[i+1] THEN
14: pvalues[pidx] xm[i] 15: pfreqs[pidx] xc[i] 16: pidxpidx + 1 17: ENDIF
18: ENDIF
19: ENDFOR
20: IFxc[nc] > xc[nc-1] THEN
21: pvalues[pidx]xm[nc] ; pfreqs[pidx]xc[nc] 22: ENDIF
23: ELSE
24: pvalues[pidx]xm[1] ; pfreqs[pidx]xc[1]
25: ENDIF
26: np length of pvalues
29: RETURNPM, np
Robustness of any estimator is important in determining k. It is a measure indicating the sensitivity of the estimators to the biases caused by the outliers in a dataset (Äyrämö & Kärkkäinen 2006). In this regard, KPEAKSMED can be considered as a robust measure of k because unlike KPEAKSAM, it is not affected by the outlying values of peak counts. KPEAKSMOD can also be regarded a robust metric but does not work well in multimodal cases of peak counts. When compared to KPEAKSAM, KPEAKSMPPC can provide a better estimate of k because it is the overall mean of the means of pairs of peak counts. As clearly seen in Figure 1, the patterns become more apparent between the features with higher peak counts. This observation shows that if estimators using higher peak counts are employed, it is possible to get more accurate estimates of k. Although they are not robust estimators of k, we could use KPEAKSMQ3M and KPEAKSMTL as useful options when the distribution of peak counts is skewed.
Finding and counting the peaks of the features in datasets are the most crucial steps in working with KPEAKS. In this paper, findpolypeaks (Algorithm 1), a peak finding algorithm which has been implemented in a CRAN package (Cebeci & Cebeci 2017) has been used. The input arguments of this algorithm are the frequencies (xc) and middle values (xm) of the classes of frequency polygon for the processed feature, and a threshold counts value (tc) for tuning the height of peaks. Here, tc is used for removing the little and scattered peaks formed by the outliers in analyzed datasets. The output of findpolypeaks algorithm are the peaks matrix (PM) which contains the frequency and middle values of the peaks, and peak counts (np) of the feature being processed.
KPEAKS can be run on the full set (FPCS) or reduced set (RPCS) of peak counts. In the first case, KPEAKS directly uses FPCS which is returned by the algorithm findpolypeaks. In the second case, it is applied on RPCS handled by removing the peak counts which are below a threshold level of counts from FPCS. With RPCS, it is expected that KPEAKS could produce more accurate estimates of the k because the features with one peak in FPCS may usually not contribute much to the formation of clustering structures.
5. Experiments on Datasets
5.1. Experiments on a Synthetic Dataset
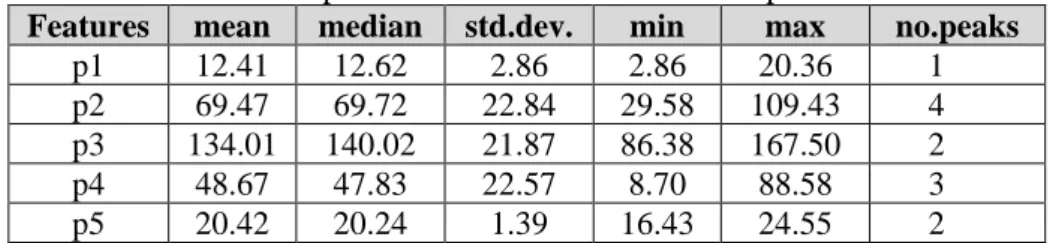
All of the required scripts in our experiments have been implemented in R environment (R Core Team, 2018). A multidimensional synthetic dataset (dataset 5p4c) is generated using rnorm function in the stats library of R, and it consists of five features with the descriptive statistics shown in Table 1. In the dataset consisting of 400 data instances, the first feature (p1) was unimodal, the second feature (p2) was four modal, third feature (p3) was three modal, fourth feature (p4) was four modal and fifth feature (p5) was bimodal.
Table 1. Descriptive statistics of the features in 5p4c dataset
Features mean median std.dev. min max no.peaks
p1 12.41 12.62 2.86 2.86 20.36 1
p2 69.47 69.72 22.84 29.58 109.43 4
p3 134.01 140.02 21.87 86.38 167.50 2
p4 48.67 47.83 22.57 8.70 88.58 3
p5 20.42 20.24 1.39 16.43 24.55 2
Modified Partition Coefficient (IMPC), Xie-Beni (IXB), Tang-Sun-Sun (ITSS), Chen-Linkens (ICL) and Pakhira-Bandyopadhyay-Maulik Fuzzy index (IPBMF). In addition to the fuzzy indices listed above, the internal indices which are present in ‘NbClust' package of R (Charrad et al 2014) have been used. Moreover, k-selection algorithm proposed by Pham et al (2005) and implemented by Rodriguez (2015) is also included because it has been argued that the algorithm is not influenced by cluster volumes. The values of all these indices have been obtained by running basic K-means algorithm with default input parameters as indicated in the package documentations. For finding the peaks of features in the analysed datasets an R implementation of Algorithm 1 have been utilized. Furthermore, an R version of the KPEAKS technique for counting the peaks and estimating the values of k have been coded.
Figure 1. Histograms, scatter plots and correlations of the features in the dataset 5p4c
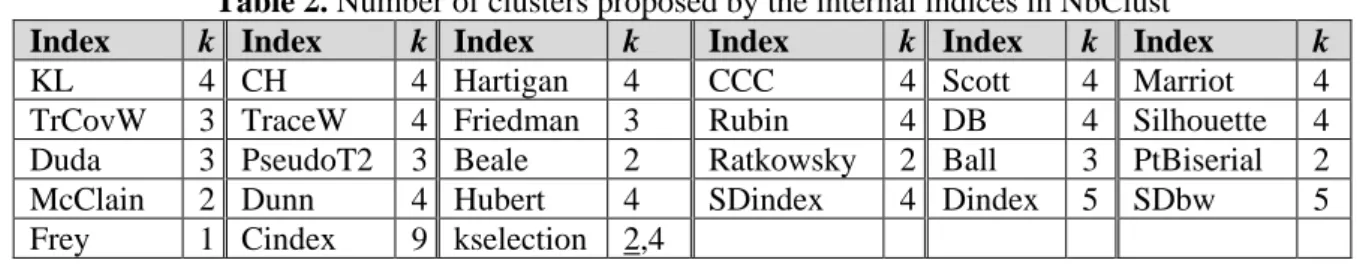
In our tests, firstly the number of clusters have been estimated by using the indices in NbClust package of R (Charrad et al 2014). As seen in Table 2, most of the internal indices (thirteen) suggested the number of clusters as 4 for the examined synthetic dataset. Following this, five of them suggested 3 clusters, four of them suggested 2 clusters, and again two of them suggested 5 clusters. Two of the indices are evaluated as useless (i.e. Cindexproposed the number of cluster is as high as 9 while Frey proposed only 1 cluster). The k-selection algorithm suggested the number of clusters between 2 and 4 while its optimal suggestion was 2.
Table 2. Number of clusters proposed by the internal indices in NbClust
Index k Index k Index k Index k Index k Index k
KL 4 CH 4 Hartigan 4 CCC 4 Scott 4 Marriot 4
TrCovW 3 TraceW 4 Friedman 3 Rubin 4 DB 4 Silhouette 4
Duda 3 PseudoT2 3 Beale 2 Ratkowsky 2 Ball 3 PtBiserial 2
McClain 2 Dunn 4 Hubert 4 SDindex 4 Dindex 5 SDbw 5
Frey 1 Cindex 9 kselection 2,4
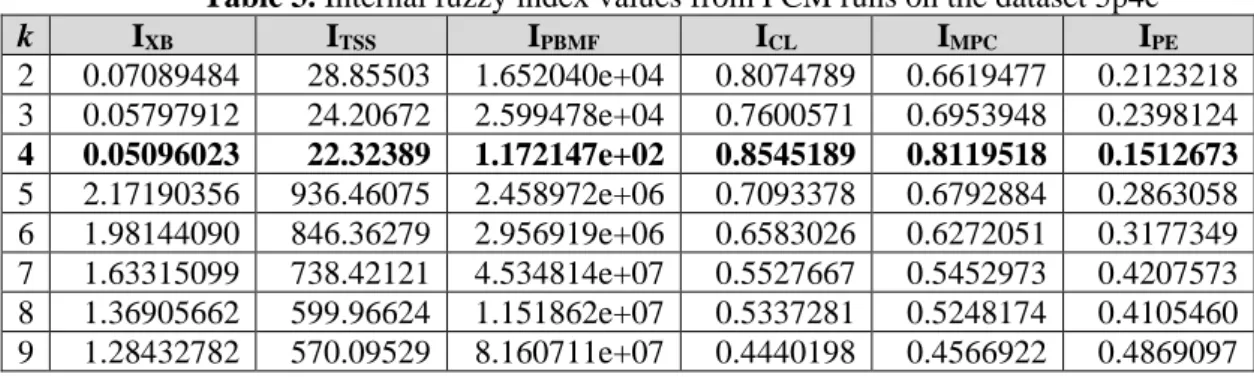
Table 3. Internal fuzzy index values from FCM runs on the dataset 5p4c
k IXB ITSS IPBMF ICL IMPC IPE
2 0.07089484 28.85503 1.652040e+04 0.8074789 0.6619477 0.2123218 3 0.05797912 24.20672 2.599478e+04 0.7600571 0.6953948 0.2398124
4 0.05096023 22.32389 1.172147e+02 0.8545189 0.8119518 0.1512673
5 2.17190356 936.46075 2.458972e+06 0.7093378 0.6792884 0.2863058 6 1.98144090 846.36279 2.956919e+06 0.6583026 0.6272051 0.3177349 7 1.63315099 738.42121 4.534814e+07 0.5527667 0.5452973 0.4207573 8 1.36905662 599.96624 1.151862e+07 0.5337281 0.5248174 0.4105460 9 1.28432782 570.09529 8.160711e+07 0.4440198 0.4566922 0.4869097
Peak counting function of KPEAKS have returned the peak counts vector as f ={1,4,2,3,2} by using histograms with the Sturges binning rule (Sturges 1926). The peak counts in the vector f are completely the same with the simulated numbers of the peaks which are listed in the last column of Table 1. By using descriptive statistics of the peak counts, KPEAKS proposes the estimates of k as shown in Table 4 which varies between 2 and 4. In general, these estimates are similar to those of the indices in Table 2. When the optimal value of k is concerned as 4 according the findings from the indices in Table 2 and Table 3, KPEAKSMQ3M and KPEAKSMTL are completely successful to suggest the optimal number of clusters in the dataset 5p4c. KPEAKSCR, KPEAKSCIQR and KPEAKSMPPC has given the number of clusters as 3 which is the same with those from most of the indices in Table 2. On the other hand, KPEAKSAM, KPEAKSMED and KPEAKSMOD produce smaller estimates of k when compared to the others.
As seen in Table 4, slightly better results have been obtained on RPCS when compared to the results from FPCS. Therefore, removing of the peak counts which are equal to 1 could produce more successful results especially for the estimates with KPEAKSAM, KPEAKSMED, KPEAKSMOD and KPEAKSMPPC.
Table 4. Number of clusters determined with KPEAKS
Sets AM MED MOD MPPC CIQR CR MQ3M MTL
FPCS 2 2 2 2 3 3 4 4
RPCS 3 3 2 3 3 3 4 4
5.2. Experiments on the Real Datasets
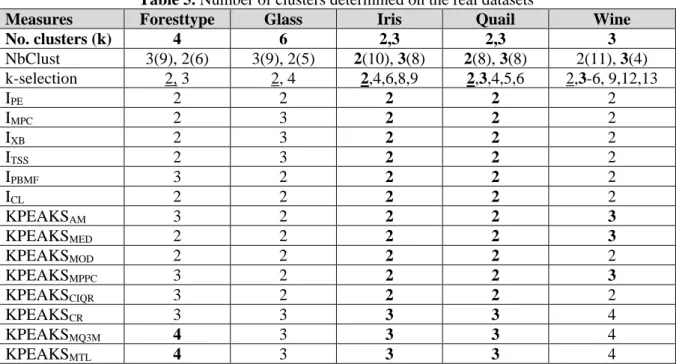
Table 5 shows the k values determined by the studied indices and KPEAKS on the real datasets. In the second row of this table, the numbers on the left of parentheses and the numbers between parentheses stand for the suggested k values and the number of indices suggesting them, respectively. In the third row, the underlined numbers show the optimal k, and the other numbers show all of the recommended k values by k-selection algorithm. According to the results shown in Table 5, KPEAKSMQ3M and KPEAKSMTL successfully find the number of clusters for the Foresttype dataset. While none of the indices determines the reported number of clusters which does exist in the dataset Glass, KPEAKSCR, KPEAKSMQ3M and KPEAKSMTL have given the similar results to those of the majority of indices listed in Table 2 and Table 3. Although the most of indices including the fuzzy indices propose the number of clusters as 2 for the dataset Iris, KPEAKSCR, KPEAKSMQ3M and KPEAKSMTL have been more successful like those of eight of the indices in NbClust. For the dataset Quail, eight of the indices in NbClust propose the number of cluster as 2, and the other eight of them propose it as 3. Similarly, KPEAKSCR, KPEAKSMQ3M and KPEAKSMTL have found the number of clusters as 3 while other options of KPEAKS have estimated it as 2. The majority of the indices in Table 2 and Table 3 suggest the number of cluster to be 2 for the dataset Wine. It is again 2 according to k-selection, however it also proposes 3 as one of the recommendations. For this dataset, the number of clusters has been determined as 3 by KPEAKSAM, KPEAKSMED and KPEAKSMPPC. On the other hand, KPEAKSCR, KPEAKSMQ3M and KPEAKSMTL determine the number of cluster as 4 which has not been proposed by the other indices.
Table 5. Number of clusters determined on the real datasets
Measures Foresttype Glass Iris Quail Wine
No. clusters (k) 4 6 2,3 2,3 3
NbClust 3(9), 2(6) 3(9), 2(5) 2(10), 3(8) 2(8), 3(8) 2(11), 3(4)
k-selection 2, 3 2, 4 2,4,6,8,9 2,3,4,5,6 2,3-6, 9,12,13
IPE 2 2 2 2 2
IMPC 2 3 2 2 2
IXB 2 3 2 2 2
ITSS 2 3 2 2 2
IPBMF 3 2 2 2 2
ICL 2 2 2 2 2
KPEAKSAM 3 2 2 2 3
KPEAKSMED 2 2 2 2 3
KPEAKSMOD 2 2 2 2 2
KPEAKSMPPC 3 2 2 2 3
KPEAKSCIQR 3 2 2 2 2
KPEAKSCR 3 3 3 3 4
KPEAKSMQ3M 4 3 3 3 4
KPEAKSMTL 4 3 3 3 4
6. Conclusions
In this paper, a fast and simple technique has been proposed to estimate k which is an input argument of partitioning clustering algorithms. The technique so-called KPEAKS calculates the value of k by using various descriptive statistics of peak counts of features in datasets. Although there are several other options that the technique can offer for determining k, KPEAKSMQ3M and KPEAKSMTL were found to be the most successful according to majority of the findings from experiments on the synthetic and studied real datasets.
peaks in frequency polygons. In this direction, a future study on an algorithm to remove the foothills and take only major peaks into account for increasing the efficiency of KPEAKS is within our scope.
Acknowledgement
This research was supported by the Scientific Research Projects Coordination Unit at the Cukurova University (Grant #: FBA-2017-9730).
References
Arthur, D & Vassilvitskii, S 2007, K-means++: The advantages of careful seeding. Proc. of the 18th Annual ACM-SIAM Symp. on Discrete Algorithms, p. 1027-1035.
Äyrämö, S & Kärkkäinen L, 2006, Introduction to partitioning based clustering methods with a robust example.
Reports of the Dept. of Math. Info. Tech. (Univ. of Jyväskylä); Series C: Software & Comp. Eng., C1, pp.1-36.
Bezdek, JC, 1974, Cluster validity with fuzzy sets. J. of Cybernetics, vol. 3, no. 3. pp. 58-73.
https://doi.org/10.1080/01969727308546047
Bezdek, JC, 1981, Pattern recognition with fuzzy objective function algorithms. New York, Plenum.
https://doi.org/10.1007/978-1-4757-0450-1
Bezdek, JC & Hathaway RJ, 2002, VAT: A tool for visual assessment of (cluster) tendency. Proc. of IEEE Int.
Joint Conf. on Neural Networks (IJCNN 02), May 12-17, 2002. vol. 3, pp. 2225-2230.
https://doi.org/10.1109/IJCNN.2002.1007487
Bezdek, JC, Hathaway, RJ & Huband JM, 2007 Visual assessment of fuzzy clustering tendency for rectangular dissimilarity matrices. IEEE Transactions on Fuzzy Systems, vol. 15, no. 5, pp. 890-903.
https://doi.org/10.1109/TFUZZ.2006.889956
Cebeci, Z & Cebeci, C 2017, kpeaks: Determination of k by using peak counts of features. R package version 0.1.0. https://CRAN.R-project.org/package=kpeaks.
Cebeci Z & Yildiz, F 2017, Unsupervised discretization of continuous variables in a chicken egg quality traits dataset. Turkish J of Agriculture-Food Science and Technology, vol. 5, no. 4, pp. 315-320.
https://doi.org/10.24925/turjaf.v5i4.315-320.1056
Chen, MY & Linkens, DA 2004, Rule-base self-generation and simplification for data-driven fuzzy models. Fuzzy Sets and Systems 142: 243–265. https://doi.org/10.1016/S0165-0114(03)00160-X
Charrad, M, Ghazzali, N, Boiteau, V & Niknafs, A 2015, Package NbClust. R package version 3.0.
https://CRAN.R-project.org/package=NbClust.
Charrad, M, Ghazzali, N, Boiteau, V & Niknafs, A 2014 NbClust: An R Package for determining the relevant number of clusters in a dataset. J. Statistical Software, vol. 61, no. 6, pp. 1-36.
https://doi.org/10.18637/jss.v061.i06
Dave, RN 1996, Validating fuzzy partitions obtained through c-shells clustering. Pattern Recognition Letters, vol. 17, no. 6, pp. 613-623. https://doi.org/10.1016/0167-8655(96)00026-8
Dudoit, S & Fridlyand, J 2002, A prediction-based resampling method for estimating the number of clusters in a dataset. Genome Biology, vol. 3, no. 7, pp. 1-21. https://doi.org/10.1186/gb-2002-3-7-research0036
Fischer, A 2011, On the number of groups in clustering. Statistics & Probability Letters, vol. 81, no. 12, pp. 1771– 1781. https://doi.org/10.1016/j.spl.2011.07.005
Halkidi, M, Batistakis, Y & Vazirgiannis, M 2001, On clustering validation techniques. J. of Intelligent Information Systems, vol. 17, no. 2/3, pp. 107–145.
Hamerly, G & Elkan, C 2004, Learning the k in k-means. Advances in Neural Information Processing Systems,
16, Eds. S. Thrun and L.K. Saul and B. Schölkopf. pp. 281-288. MIT Press.
Havens, TC & Bezdek, JC 2012, An efficient formulation of the improved visual assessment of cluster tendency (iVAT) algorithm. IEEE Transactions on Knowledge & Data Engineering, vol. 24, no. 5, pp. 813-822.
https://doi.org/10.1109/TKDE.2011.33
Kodinariya, TM & Makwana, PR 2013, Review on determining number of cluster in K-Means clustering. Int. J of Advanced Research in Computer Science &Management Studies, vol. 1, no.6, pp. 90-95.
Kovács, F, Legány, C & Babos, A 2005, Cluster validity measurement techniques. 6th Int. Symp. of Hungarian Researchers on Computational Intelligence, Nov 18-19, 2005, Budapest, Hungary.
Krishnamoorthi, 2011, Automatic evaluation of cluster in unlabeled datasets. Proc. of Int.Conf. on Information
and Network Technology. IACSIT Press, Singapore. pp. 120-124.
Liu, Y, Li, Z, Xiong, H Gao, X & Wu, J 2010, Understanding of internal clustering validation measures. 2010 IEEE Int. Conf. on Data Mining, pp. 911-916. https://doi.org/10.1109/ICDM.2010.35
Marozzi, M 2014, Construction, dimension reduction and uncertainty analysis of an index of trust in public iInstitutions’, Quality and Quantity, vol. 48, no. 2, pp. 939–953. https://doi.org/10.1007/s11135-012-9815-z
Morissette, L & Chartier, S 2013, The k-means clustering technique: General considerations and implementation in Mathematica. Tutorials in Quantitative Methods for Psychology, vol. 9, no. 1, pp. 15-24.
https://doi.org/10.20982/tqmp.09.1.p015
Pakhira, MK 2012, ‘Finding number of clusters before finding clusters’ Procedia Technology vol. 4, pp. 27-37.
https://doi.org/10.1016/j.protcy.2012.05.004
Pakhira, MK, Bandyopadhyay, S & Maulik, U 2004, Validity index for crisp and fuzzy clusters. Pattern Recognition vol. 37, no. 3, pp. 487-501. https://doi.org/10.1016/j.patcog.2003.06.005
Pham, DT, Dimov, SS & Nguyen, CD 2005, Selection of k in K-means clustering. J of Mechanical Engineering Science, no. 219, pp. 103-119. https://doi.org/10.1243/095440605X8298
R Core Team, 2018. R: A language and environment for statistical computing. R Foundation for Statistical Computing, Vienna, Austria. http://www.R-project.org.
Ray, S & Turi, RH 1999, Determination of number of clusters in K-Means clustering and application in colour image segmentation. Proc. of4th Int. Conf. on Advances in Pattern Recog. & Digital Techniques, Calcutta, India. Narosa Publishing House, New Delhi, India, pp. 137-143.
Rendón, E, Abundez, I, Arizmendi, A & Quiroz, EM 2011, Internal versus external cluster validation indexes. Int. J of Computers and Communications, vol. 5, no. 1, pp. 27-34.
Rodriguez, G 2015, kselection: Selection of k in K-means clustering. R package version 0.2.0. http://CRAN.R-project.org/package=kselection.
Saisana, M, Saltelli, A & Tarantola, S, 2005, Uncertainty and sensitivity analysis techniques as tools for the quality assessment of composite indicators. J of the Royal Statistical Society: Series A (Statistics in Society) vol. 168, no. 2, pp. 307-323. https://doi.org/10.1111/j.1467-985X.2005.00350.x
Schwämmle, V & Jensen N 2010, A simple and fast method to determine the parameters for fuzzy c–means cluster analysis. Bioinformatics, vol. 26, no. 22, pp. 2841–2848, doi:10.1093/bioinformatics/btq534.
https://doi.org/10.1093/bioinformatics/btq534
Sturges, H 1926, The Choice of a class-interval. J. Amer. Statist. Assoc. vol. 21, no. 153, pp. 65-66.
https://doi.org/10.1080/01621459.1926.10502161
Tang, Y Sun, F & Sun, Z 2005, Improved validation index for fuzzy clustering. Proc. American Control Conf., 2005. pp. 1120-1125.
Thalamuthu, A, Mukhopadhyay, I, Zheng, X & Tseng, GC 2005, Evaluation and comparison of gene clustering methods in microarray analysis. Bioinformatics, vol. 22, no. 19, pp. 2405-2412.
https://doi.org/10.1093/bioinformatics/btl406
Wang, W & Zhanga, Y 2007, On fuzzy cluster validity indices. Fuzzy Sets and Systems, vol. 158, pp. 2095– 2117.
https://doi.org/10.1016/j.fss.2007.03.004
Xie, XL & Beni, G 1991, A validity measure for fuzzy clustering. IEEE Transactions on Pattern Analysis and