ASSOCIATION OF MID-LIFE ALCOHOL CONSUMPTION WITH STROKE AND COGNITIVE DECLINE IN THE ATHEROSCLEROSIS RISK IN COMMUNITIES STUDY
Sara Bingham Jones
A dissertation submitted to the faculty at the University of North Carolina at Chapel Hill in partial fulfillment of the requirements for the degree of Doctor of Philosophy in the Department of
Epidemiology in the Gillings School of Global Public Health.
Chapel Hill 2015
Approved by: Wayne D. Rosamond Laura Loehr
iii ABSTRACT
Sara Bingham Jones: Association of Mid-Life Alcohol with Stroke and Cognitive Decline in the Atherosclerosis Risk in Communities Study
(Under the direction of Wayne D. Rosamond)
One in three adults will experience stroke or develop dementia in their lifetime, underscoring the need to identify modifiable factors to delay or prevent disease. Alcohol, a common exposure in most populations, may confer cardiovascular benefits at light-to-moderate doses. Its association with stroke and cognitive function is uncertain.
This dissertation aims to estimate the associations between mid-life alcohol consumption and incident stroke and rate of cognitive decline using data from the Atherosclerosis Risk in Communities Study, a biracial population-based cohort of 15,792 adults aged 45-64 at baseline with >20 years of follow-up. Alcohol consumption was self-reported as usual drinks per week; categorized as never, former, light (≤3), moderate (4-17), and heavier (≥18). One-third of participants were light drinkers, roughly one-fifth each were moderate, never and former drinkers and only 4% reported heavier consumption.
iv
Cognitive status was assessed at visits 2, 4, and 5 using three validated tests. Linear regression with generalized estimating equations estimated the difference in 20-year decline by alcohol intake. We used multiple imputation with chained equations to address informative attrition in sensitivity analysis. Global 20-year cognitive change did not differ between light drinkers and abstainers (0.019 z-score units; 95% CI -0.032, 0.070) and was somewhat faster for heavier drinkers (-0.041; -0.0152, 0.070). No consistent pattern in 20-year change was observed across tests, but effects were somewhat larger on tests of verbal fluency and executive function.
v
ACKNOWLEDGEMENTS
I have received tremendous support, guidance, and encouragement over the years from many sources – professors, colleagues, family and friends. Together, they created an environment of learning that has enabled me to complete my dissertation. I would like to thank my committee members for their insightful comments and suggestions on my research approach. I wish to convey my deepest gratitude to my advisor and chair, Wayne Rosamond, who patiently worked with me to design and implement my research and whose positive attitude and practical advice helped guide me forward. My friends and family provided incredible support and encouragement – my heartfelt thanks goes out to them all for giving me a solid foundation on which to grow, from which to explore, and to which to return for comfort and advice. Thank you to my parents who taught me the importance of hard work and personal integrity, who prioritized my education, and who continue to give unwavering and unending support. Finally and most importantly, I thank God, who has blessed me throughout my life with wisdom, opportunity, and direction and who has bestowed upon me the gifts of scientific curiosity and the necessary skills to successfully pursue doctoral work and contribute to the public health field.
The ARIC Study is carried out as a collaborative study supported by National Heart, Lung, and Blood Institute contracts (HHSN268201100005C, HHSN268201100006C, HHSN268201100007C,
HHSN268201100008C, HHSN268201100009C, HHSN268201100010C, HHSN268201100011C, and
HHSN268201100012C). Neurocognitive data is collected by U01 HL096812, HL096814, HL096899,
vi
TABLE OF CONTENTS
LIST OF TABLES ... x
LIST OF FIGURES ... xii
CHAPTER 1: INTRODUCTION ... 1
CHAPTER 2: STUDY OBJECTIVES AND SPECIFIC AIMS ... 4
CHAPTER 3: BACKGROUND AND SIGNIFICANCE ... 7
3.1 Public Health Burden of Stroke and Cognitive Impairment ... 7
A. Stroke and its Epidemiology... 7
B. Cognitive Decline and its Epidemiology ... 10
C. Summary ... 14
3.2 Alcohol Consumption Patterns in the U.S. ... 15
A. Summary ... 18
3.3 Mechanisms Linking Alcohol with Stroke and Cognitive Impairment ... 19
A. Alcohol as a Risk Factor for Stroke and Cognitive Decline- Effects of Heavy Alcohol Consumption ... 20
B. Alcohol as a Protective Factor for Stroke and Cognitive Decline – Effects of Low-to-Moderate Consumption ... 25
C. Summary ... 28
3.4 Measurement of Alcohol Consumption ... 29
A. Measurement Tools in Epidemiologic Research ... 29
B. Measurement Error and Validation Studies ... 35
vii
3.5 Outcome Measurement... 43
A. Ascertainment and Definition of Stroke Events ... 43
B. Summary ... 50
C. Measurement of Cognitive Function ... 51
D. Summary ... 55
3.6 Studies Assessing the Relationship Between Alcohol and Stroke ... 56
A. Overview ... 56
B. Description of Seven Key Studies ... 58
C. Meta-Analyses of the Association between Alcohol and Stroke ... 72
D. Gaps and Challenges for Future Research ... 76
3.7 Studies Assessing the Relationship Between Alcohol and Cognitive Decline ... 80
A. Overview ... 80
B. Description of Four Key Studies ... 81
C. Summary and Gaps in the Current Literature ... 88
3.8 Public Health Significance ... 90
CHAPTER 4. RESEARCH METHODS ... 92
4.1 Study Population ... 92
4.2 Research Plan for the Assessment of Alcohol and Stroke (Aims 1 and 2) ... 93
A. Analytic Sample ... 93
B. Exposure Assessment ... 94
C. Outcome Assessment ... 95
D. Confounder Selection and Assessment ... 97
viii
F. Strengths and Limitations ... 103
4.3 Research Plan for the Assessment of Alcohol and Cognitive Decline ... 105
A. Analytic Sample ... 105
B. Exposure Assessment ... 105
C. Outcome Assessment ... 106
D. Confounder Selection and Measurement... 107
E. Statistical Analysis ... 108
F. Strengths and Limitations ... 110
4.4 Sensitivity Analyses... 111
A. Alternative Approaches of Specifying Alcohol Exposure ... 111
B. Accounting for Informative Visit Nonattendence and Death ... 112
C. Additional Sensitivity Analyses ... 115
CHAPTER 5. MANUSCRIPT #1: MIDLIFE ALCOHOL CONSUMPTION AND THE RISK OF STROKE IN THE ATHEROSCLEROSIS RISK IN COMMUNITIES STUDY ... 116
5.1 Overview ... 116
5.2 Introduction ... 117
5.3 Methods ... 118
5.4 Results... 121
5.5 Discussion ... 126
CHAPTER 6. MANUSCRIPT #2: MIDLIFE ALCOHOL CONSUMPTION AND COGNITIVE DECLINE IN THE ATHEROSCLEROSIS RISK IN COMMUNITIES STUDY ... 131
6.1 Overview ... 131
6.2 Introduction ... 132
ix
6.4 Results... 137
6.5 Discussion ... 144
CHAPTER 7. CONCLUSIONS AND PUBLIC HEALTH IMPLICATIONS ... 149
APPENDIX 1: NATIONAL SURVEY OF STROKE CLASSIFICATION SCHEME ... 153
APPENDIX 2: ALCOHOL AND STROKE LITERATURE REVIEW TABLES ... 157
A. Part 1: Population, Study Design, and Measurement ... 157
B. Part 2: Analysis and Ischemic Stroke Results ... 166
C. Part 3: Hemorrhagic and Total Stroke Results... 174
APPENDIX 3: ALCOHOL AND COGNITIVE DECLINE LITERATURE REVIEW TABLES ... 180
A. Part 1: Population, Study Design, and Measurement ... 180
B. Part 2: Analysis and Results ... 185
APPENDIX 4: ALCOHOL QUESTIONNAIRES USED IN THE ARIC STUDY AT VISITS 1 & 2 ... 190
APPENDIX 5: COGNITIVE FUNCTION ASSESSMENTS USED IN THE ARIC STUDY ... 191
x LIST OF TABLES
Table 1. Description of selected cognitive domains ... 11 Table 2. Prevalence of heavy and binge drinking by sociodemographic
characteristics, BRFSS 2006 ... 16 Table 3. Tools for the measurement of alcohol consumption ... 29 Table 4. Ranking of individuals according to alcohol intake: weighted averages of
correlations (range across studies) ... 38 Table 5. Methods of stroke case ascertainment recommended for use in
community-based studies ... 43 Table 6. Standard definitions for comparing pathological types of stroke ... 48 Table 7. Relative risk of subtypes of stroke according to alcohol consumption ... 58 Table 8. Adjusted odds for ischemic stroke stratified by sex, age, and
race/ethnicity. ... 60 Table 9. Risk and hazard ratio of IS according to total ethanol intake among
participants of the Framingham Study ... 62 Table 10. Relative risk of ischemic stroke according to usual alcohol consumption
among CHS participants ... 64 Table 11. Risk for ischemic stroke according to baseline frequency and quantity of
alcohol consumption among 38,156 male health professionals ... 67 Table 12. RR (95% CIs)* of Stroke by Categories of Alcohol Consumption (g/d) in
Women and Men ... 69 Table 13. Multivariable association between alcohol and incidence of total, ischemic
and hemorrhagic stroke ... 71 Table 14. Overall relative risk (95% confidence interval) of stroke associated with
alcohol consumption and test for trend ... 73 Table 15. Stratified analyses of pooled relative risks (95% CI) for stroke outcomes ... 76 Table 16. Odds ratios for occurrence of clinically significant declines of 8 or more
units in 3MSE score from baseline, Women's Health Initiative Memory
Study, 1996-2002 ... 82 Table 17. Relative risks of a substantial decline in cognitive function over a 2 year
xi
Table 19. Relation between reported alcohol intake and performance on repeated
measures of TICS-m... 88 Table 20. Selected characteristics of ARIC cohort participants at Visit 1, 1987-1989 ... 93 Table 21. Percent missing alcohol intake data according to the cumulative number
of missing measurements from Visit 1 through 4 ... 94 Table 22. Neuropsychological assessments in the ARIC study ... 106 Table 23. Characteristics of ARIC participants according to self-reported usual
alcohol consumption at baseline ... 122 Table 24. Hazard ratios and 95% confidence intervals (CI) for the association of
alcohol consumption and IS and ICH ... 123 Table 25. Cause-specific and subdistribution hazard ratios and 95% confidence
intervals (CI) for the association of alcohol consumption and IS and ICH ... 126 Table 26. Characteristics of ARIC Participants at Visit 2 (1990-1992) According to
Self-Reported Usual Mid-Life Alcohol Consumption ... 138 Table 27. Mean Global and Test-Specific z Scores at Visits 2 (1990-1992), 4
(1996-1998), and 5 (2011-2013) by Alcohol Intake in the ARIC study ... 139 Table 28. Estimated Average 20-Year Cognitive Decline and Additional Adjusted
20-Year Cognitive Change Associated with Alcohol Consumption Category in the ARIC study, Complete Case Analysis compared with MICE-Corrected
xii LIST OF FIGURES
Figure 1. Types of ischemic stroke ... 8 Figure 2. Prevalence of alcohol consumption levels by sex and age, NHANES
1999-2002... 15 Figure 3. Per capita ethanol consumption by beverage type, United States,
1977-2009... 18 Figure 4. Metabolism of ethanol into acetaldehyde by alcohol dehydrogenase and
the MEOS pathway ... 20 Figure 5. Effect of ethanol on NMDA receptors and excitotoxicity... 22 Figure 6. Percent change in biomarkers associated with intake of 30g (~2 drinks) of
alcohol per day ... 26 Figure 7. Standard drink sizes in international populations3 (A) and in the United
States (B) ... 41 Figure 8. Sources of case identification in the BASIC project ... 46 Figure 9. Dose response relationship between alcohol and ischemic stroke ... 60 Figure 10. Risk of ischemic stroke according to baseline alcohol intake and ApoE
genotype... 65 Figure 11. Scatterplot of log-RR and meta-regression curve of stroke associated with
alcohol consumption by stroke subtype (top panel) and sex (bottom
panel) ... 73 Figure 12. Meta-analytic results of ischemic and hemorrhagic stroke incidence and
mortality in women (panels A & C) and men (panels B & D) ... 75 Figure 13. Directed acyclic graph for the association between alcohol and stroke ... 98 Figure 14. Directed acyclic graph for the relationship between alcohol and cognitive
decline ... 108 Figure 15. Associations of midlife alcohol consumption and IS by sex-race group ... 124 Figure 16. Dose-response relationship between midlife alcohol consumption and IS
estimated with quadratic splines. ... 125 Figure 17. The ARIC study timeline and number of participants attending visits 1-5 ... 133 Figure 18. Adjusted additional 20-year cognition change in global and test-specific z
1
CHAPTER 1: INTRODUCTION
Brain-related diseases are important targets for public health prevention, particularly given the ageing population and expected concomitant increases in disease burden. Stroke is a leading cause of mortality and disability, and dementia prevalence is estimated to be as high as 50% among adults aged 85 years and older.7, 8 Approximately 1 in 3 Americans will have a stroke or develop dementia in their lifetime, underscoring the need for continued examination of modifiable risk factors for these diseases.9
The association between alcohol and coronary heart disease has been widely studied, with relatively consistent findings of a J-shaped relationship such that moderate drinkers have the lowest risk of disease.10-1415 Whether similar dose-response relationships exist between alcohol
consumption and diseases of the brain, including stroke and cognitive impairment, is less well understood. Previous studies have reported that heavy alcohol consumption is associated with increased ischemic and hemorrhagic stroke risk as well as cognitive decline and dementia.2, 6, 16-19
However, results are conflicting with regard to whether low-to-moderate intake is associated with reduced risk of stroke and cognitive decline.1, 14, 18, 20-26 Several of these studies rely on a single
2
Furthermore, there are few studies of the effects of alcohol in African-American populations despite the fact that African-Americans have a higher incidence of stroke and dementia and higher
prevalence of problem drinking.7, 38 Some evidence suggests that effects on stroke risk may differ by race, but studies are few. 39-41
Alcohol may exert protective effects for ischemic stroke by increasing high-density lipoprotein, apolipoprotein A, insulin sensitivity, and fibrinogen levels as well as by decreasing inflammation, thrombotic factors, and platelet activity.6, 42-44 Moderate alcohol consumption may
reduce the risk of cognitive decline through similar mechanisms, resulting in preserved brain vasculature, fewer subclinical infarcts and microbleeds, and less white matter degradation. In addition, moderate alcohol may facilitate learning and memory by increasing acetylcholine, a neurotransmitter involved in attention and memory storage, in the hippocampus.8, 18 In contrast, high doses of alcohol have clear deleterious effects through direct neurotoxic effects on brain structures, elevated blood pressure, reduced cerebral blood flow, and development of atrial fibrillation and cardiomyopathy that increase the risk of stroke and cognitive decline.18 The anti-thrombotic effects of alcohol that may protect against ischemic stroke may increase hemorrhage risk. Heavy drinking can also lead to Wernicke-Korsakoff syndrome, a thiamine deficiency
characterized by cognitive and memory deficits. Chronic alcohol abuse indirectly leads to thiamine deficiency through malnourishment and directly plays a role by decreasing absorption from the gastrointestinal tract, interfering with the conversion of thiamine into its active form.45 Moderate
alcohol intake may have harmful effects as well. There is risk of addiction for certain populations and studies suggest that moderate intake may be associated with increased stomach, esophageal and breast cancer risk.46 Additional risks include disruption of sleep, medication interaction, and
3
recommend initiation of moderate drinking among abstainers for the purpose of reducing risk of heart disease.47 Instead, public health messages focus on reduction of heavy drinking and binge
drinking episodes and encouragement of current drinkers to consume alcohol in moderation. The risk-benefit tradeoff of moderate drinking versus abstention may differ with age, with benefits outweighing risks beginning in middle age.48 Currently, the definition of moderate intake is not standardized and U.S. and international guidelines differ.49 There is some evidence that current
recommendations for moderate drinking among older adults by the National Institute on Alcohol Abuse and Alcoholism may be conservative. Continued research will help to better identify harmful and beneficial doses of alcohol.
Public health recommendations regarding alcohol consumption require integration of evidence on many outcomes including injury, cancer, coronary heart disease, and all-cause
mortality.14 Herein, we propose to contribute further understanding through additional research of
the association between alcohol consumption and diseases of the brain, conditions for which evidence to date has been inconsistent. There remains a need for further elucidation of the
4
CHAPTER 2: STUDY OBJECTIVES AND SPECIFIC AIMS
The proposed study seeks to estimate the association between alcohol consumption and stroke and cognitive decline in a population-based sample of White and Black participants aged 45-64 at baseline in the Atherosclerosis Risk in Communities study. The proposed study will utilize data from the 5 study visits of the ARIC study as well as data collected at annual follow-up and through surveillance of community hospital discharge lists. Manuscript 1 will address Specific Aims 1 and 2 and manuscript 2 will address Specific Aim 3.
Specific Aim 1: Estimate the dose-response relationship between alcohol intake over time and incident total, ischemic, and hemorrhagic stroke among White and Black participants in the Atherosclerosis Risk in Communities (ARIC) Study (Manuscript 1; Chapter 5). Time-to-event analysis will be used to obtain effect estimates for the association of mid-life alcohol consumption with incident total, ischemic, and hemorrhagic stroke. Models will be adjusted for potential confounders, and account for the competing risk of death. We hypothesize that heavy drinking will be associated with the highest rate of all stroke types and that light-to-moderate drinking will be associated with reduced rate of ischemic, and to a lesser degree hemorrhagic, stroke compared with lifetime abstention from drinking. We will assess modification of these relationships by race and sex given the previous findings that effects of alcohol on cardiovascular disease risk may vary by race-ethnicity and that the dose-response relationship may differ by sex.
Specific Aim 2: Investigate the feasibility of estimating the proportional changes in stroke incidence among sex-race groups that could result from population-level shifts in alcohol
5
hemorrhagic stroke events resulting from changes in the distribution of alcohol intake will be estimated using generalized impact fraction methods. Generalized impact fractions will be estimated within strata of age, sex, and race using effect estimates obtained from Cox regression models in Specific Aim 1. We will estimate the expected change in stroke incidence that
corresponds with achievement of the 2020 Healthy People Goals for reductions in heavy drinking.50
These goals target a ~3% reduction in the prevalence of heavy drinking, defined as consumption of
>2 drinks per day for men and >1 drink per day for women.
Specific Aim 3: Estimate the association between alcohol consumption and rate of cognitive decline among the ARIC participants attending Visit 2(Manuscript 2; Chapter 6). Linear regression with generalized estimating equations will be used to estimate the rates of cognitive decline across levels of alcohol consumption. Inverse-probability weights will be calculated to account for the different mechanisms of attrition (drop-out and death) that may induce selection bias. Alternative methods to address attrition will be considered in the event that inverse-probability weights prove infeasible. We hypothesize that moderate consumption of alcohol will be associated with a slower rate of decline in cognitive function than lifetime abstention. Heavy alcohol intake is hypothesized to result in the steepest decline in cognitive function. We will explore modifications of these relationships by sex, race, and ApoE ε4 allele status.
6
7
CHAPTER 3: BACKGROUND AND SIGNIFICANCE 3.1 Public Health Burden of Stroke and Cognitive Impairment
Stroke and pathological cognitive decline are important targets for public health prevention. Both are associated with significant morbidity and heath care costs and are estimated to increase in burden over the next few decades due to longer life expectancies and demographic population changes.51, 52 Worldwide, dementia contributes to 11.2% of total years lived with disability and
stroke to 9.5% for adults aged 60 years and older.53 With approximately 1 in 3 Americans estimated to have a stroke or develop dementia in their lifetime, there is urgent need for continued
examination of modifiable risk factors for these diseases. Cardiovascular (CV) risk factors such as high blood pressure, obesity, diabetes, physical inactivity, and smoking have been implicated in disease risk. Identifying additional modifiable factors such as alcohol consumption may provide further avenues for preventing or delaying disease. This is particularly important for cognitive decline, as there are no effective pharmaceutical treatments for dementia.
A. Stroke and its Epidemiology
Stroke has historically been defined using variations of the World Health Organization criteria as a “sudden impairment of brain function resulting from the interruption of circulation to one or other parts of the brain following either an occlusion (ischemic stroke) or hemorrhage (hemorrhagic stroke) of the artery supplying that area”.54 A more recent definition has been
established that incorporates both clinical and tissue-based criteria.55 Under these new definitions,
8
injury based on symptoms lasting more than 24 hours. Intracerebral hemorrhage is defined as “rapidly developing clinical signs of neurological dysfunction attributable to focal collection of blood within the brain parenchyma or ventricular system that is not caused by trauma”. Subarachnoid hemorrhage is defined as “rapidly developing signs of neurological dysfunction and/or headache because of bleeding into the subarachnoid space (between the arachnoid membrane and the pia mater)”.
Despite its sudden onset, many strokes are the result of an atherosclerotic disease process that begins decades earlier. Atherosclerosis is an inflammatory disease of the arterial wall that can result in
weakening of the vessel wall and protrusion of atherosclerotic plaques into the lumen.56
This narrowing can lead to restriction or
cessation of blood flow to the brain (ischemia) and subsequent infarction. In the U.S., strokes of ischemic etiology are common and account for 87% of all strokes.7 Ischemic events may occur by
way of thrombosis, wherein a blood clot forms around an atherosclerotic lesion, or embolism, wherein clots that develop in the heart or break off from a thrombus become lodged in circulation and obstruct blood flow to the brain.57 Large artery stenoses result from occlusion of one of the
large arteries that supplies the brain such as the internal carotids, cerebral, and basilar arteries (Figure 158). Lacunar infarctions occur in the deep penetrating arteries of the brain with resultant lesions often seen in the putamen, thalamus, and pons. Cardioembolic strokes result from arterial occlusions (often in the middle or posterior cerebral artery) from emboli of a cardiac source.
9
respectively, of strokes in the U.S.7 Their etiology is not atherosclerotic in nature, but can still result
from many years of exposure to CV risk factors, particularly the damaging effects of high blood pressure, cigarette smoking, and other harmful lifestyle habits. Hemorrhagic events result from rupture of a blood vessel and bleeding in the brain, either in the deep portions of the cerebral hemisphere in the case of ICH or in the subarachnoid spaces in the case of SAH.57 Rupture may
result from weakening of the vessel wall, as from sustained elevated blood pressure, or from malformation in the vessel as in arteriovenous malformations. Brain damage from hemorrhagic strokes results from the increased pressure of blood on surrounding tissue and the direct toxic effects of blood on brain tissue.57
Stroke is the 4th leading cause of death in the United States, accounting for 1 in 19 deaths,
and is a leading cause of disability. There are 610,000 new and 185,000 recurrent strokes each year in the U.S. Since 1950, death rates from stroke have declined.54 Despite this, the number of deaths
attributed to stroke are projected to increase from 5.7 million currently to 7.8 million in 2030 and
the number of first-ever strokes will increase from 16 to 23 million worldwide. Overall prevalence is 2.8% in the U.S. and is projected to increase to 3.4% by 2030.7 Prevalence rates increase with age
and reach 13-17% in adults aged ≥80 years.54 The burden of stroke is higher among African
Americans compared with whites (age-adjusted incidence per 100,000 person-years: white men 150, white women 130, black men 300, black women 300).54 Lifetime risk of stroke at age 65 is
20.6% for women and 16.8% for men, with 5-year survival averaging approximately 40%.54 Direct
and indirect costs exceed $38 billion annually and the lifetime cost of stroke to an individual
averages more than $140,000.7
Elevated blood pressure is a strong risk factor for both ischemic and hemorrhagic stroke.7
10
data are inconsistent as to whether smoking increases the risk of ICH. High cholesterol levels increase the risk for stroke in some studies, but effects are smaller than those observed for heart disease and are absent in some studies. Finally, there are risk factors specific to women that include pregnancy, hormone use, and age at menopause. Several of these risk factors are also associated with alcohol intake including low social support, HDL-C, smoking, and physical activity.
B. Cognitive Decline and its Epidemiology
Cognitive function, defined as “the mental processes that are required to receive, analyze, and act on information from the environment”, is classified into cognitive domains including, among others, reception, memory and learning, attention, visuoperception and visual reasoning, language, construction, motor ability, decision making, and executive control (Table 1).51, 59 Declines in
function over time are common with aging, but a complete understanding of ‘normal’ cognitive aging is lacking.60 On average, most aspects of cognition decline with age including working memory
and processing speed.59 Other functions, for example expert knowledge and vocabulary, remain
stable or even increase with age. Declines exist on a continuum from normal aging to pathological declines. The latter may hinder independent living, social relationships, and quality of life. The definition of pathological declines is somewhat arbitrary and studying declines that have yet to reach the threshold for clinical diagnosis will improve our understanding of modifiable factors that affect the entire disease process. Cognitive aging is not uniform across the population; some individuals experience very little decline well into their 80s while others exhibit declines beginning in their 60s.59 This variation in degree and rate of decline is of interest to researchers, particularly if it
11 Table 1. Description of selected cognitive domains
Cognitive function Description Task
Orientation Awareness of self in relation to one’s surroundings, including time, place, and person. Requires
integration of attention, perception, and memory
Knowledge of today’s date
Attention and
concentration Ability to sustain and focus thoughts and behavior Symbol substitution Mental tracking Hold information in memory while performing a
mental operation Repeat numbers in reverse order Memory Capacity to retain information and utilize it for
adaptive purposes Short-term word recall
Language Ability to comprehend and produce speech Verbal fluency – name as many words as possible beginning with ‘F’ Construction Combined perception and motor response. Draw a clock face Reasoning Thinking with a conscious intent to reach a
conclusion Arithmetic calculations, organize pictures in logical temporal order
Psychomotor speed Amount of time it takes to process information, plan a response, and carry out a physical movement; combines decision time and motor components
Digit symbol substitution
Executive function Ability to respond in an adaptive manner to novel situations. Comprised of several other functions including planning, organization, coordination, implementation, and evaluation.
Route finding task
Cognitive declines that have progressed to a certain degree of severity are defined clinically as mild cognitive impairment (MCI) and dementia. MCI is an intermediate state of cognitive
function between normal cognition and dementia that generally does not impair daily life.51 MCI
can be thought of as a sub-clinical impairment and is a risk factor for development of dementia later in life.60 Not all individuals with MCI appear to develop dementia and some even show
improvements in cognitive function. Dementia is a “clinical syndrome caused by neurodegeneration and characterized by inexorably progressive deterioration in cognitive ability and capacity for independent living”. Common pathologies include Alzheimer’s disease (AD), vascular dementia, and Lewy body dementia.52 A relatively new definition of vascular cognitive impairment has been
developed and includes impairments ranging from mild to severe affecting at least 1 cognitive domain and with evidence of clinical stroke or subclinical vascular brain injury.61
12
manifest themselves as declines in one or more domains of cognition. These include, among others, vascular disease, degenerative diseases, traumatic brain injury, and toxicity. Alcohol has the most direct effects through neurotoxicity and alterations in vascular risk factors, but also can be an upstream contributor to traumatic brain injury. The latter, however, is beyond the scope of this dissertation.
Vascular and neurodegenerative processes occur over the life course, are multi-factorial, and incompletely understood. Neurodegenerative and vascular-related pathologies overlap
considerably and share several risk factors including alcohol consumption. Alzheimer’s disease, one of the more common neurodegenerative dementias, is characterized by accumulation of amyloid plaques and neurofibrillary tangles as well as neuronal loss. Mixed pathology is seen in 25-80% of dementias and there is some evidence that cerebrovascular and AD lesions may act synergistically in the development of dementia.62 Vascular dementia is the end result of vascular lesions in the brain
that impair its function. Because the brain relies on a constant supply of blood for proper
functioning, interruption of blood flow results in tissue death.61 Important factors in the likelihood
of developing dementia are the volume of brain damage, the number of lesions, and their location; however, the types of lesions that result in dementia are quite heterogeneous.
Contributors to vascular-related cognitive impairment include clinical stroke (likely reflecting both tissue damage from the event itself and the presence of CV risk factors such as high blood pressure that contribute to additional brain damage), microbleeds, white matter lesions, and silent brain infarctions. Silent brain infarctions are 5 times as prevalent as clinical strokes in the
population, with prevalence estimates ranging from 8-28%.55, 59 These, along with white matter
13
arteriosclerosis are associated with impairment. Atherosclerosis of medium and large arteries contributes to cognitive impairment through emboli that arise from carotid plaques and thrombotic occlusion of large vessels that result in cerebral hypoperfusion and subsequent brain damage. Small vessel disease, similar to atherosclerotic changes but without calcification, can result in
hemorrhages, microinfarcts and microbleeds, white matter hyperintensities, as well as lacunar infarcts.62 Finally, cerebral amyloid angiopathy in which amyloid β-protein is deposited in vessel
walls, may lead to disturbances in blood flow, microinfarcts and microbleeds, white matter lesions, and hemorrhages. Collectively, atherosclerosis, small vessel disease, and cerebral amyloid
angiopathy can lead to cerebrovascular lesions and subsequent cognitive decline.
Cardiovascular risk factors that are associated with cognitive decline include diabetes (via damaging effects of elevated insulin and glucose) and hypertension, which is associated with MCI even in the absence of lesions.59 Randomized controlled trials have largely been unable to show a
beneficial effect of glucose and blood pressure modification on later development of dementia. However, trials are few in number given the long-term follow-up required, have had somewhat inconsistent results, and are subject to methodological limitations.61 In addition to the CV risk
factors discussed above, age, race, education, obesity, hypercholesterolemia, physical inactivity, smoking, dietary factors, depression, and social isolation have been implicated in cognitive decline.35, 51 Alcohol consumption is one of the dietary factors that has received attention from
researchers as both a protective and harmful factor, though its putative causal relationship with cognitive decline has not been rigorously evaluated and evidence to date is weak.33, 63 Assessing this association in a study with long-term follow-up and multiple measures of cognitive function will contribute to this literature.
14
sampling).64 The prevalence of MCI is reported at 2-20%, and is thought to be 13% among adults
≥65 years of age representing 5.4 million adults.64, 65 Data from the Aging, Demographics, and
Memory Study of adults aged over 70 years reported 13.7% prevalence of dementia (10.8% in men
and 15.5% in women), with 70% attributed to AD and 17% to vascular dementia.66 Prevalence of
non-dementia cognitive impairment was 22%. Global prevalence is estimated to triple within 40 years and in the U.S. prevalence will rise to 11-16 million by 2050.51 The incidence of AD and
dementia increase with age, doubling roughly every 5 years after age 65. Age-adjusted incidence of dementia ranges from 2.4 per 1000 person-years in the age group 65-69 to 27.5 per 1000 p-y in the age group 85-89 and ranges from 9-26 per 1000 person-years for ‘pre-dementia syndromes’.65, 66
Healthcare costs totaled $183 billion dollars in 2011 and the cost of informal care in the U.S. was an
additional $18 billion per year.53 Persons with dementia have higher annual health care costs than similarly-aged persons without dementia ($42,072 versus $13,515). Finally, dementia confers significant costs to care givers, who can experience high levels of stress, depression, financial difficulties, and adverse health outcomes. In summary, the prevalence of dementia is high and will continue to increase over time given the sharp increase in incidence associated with aging coupled with expected demographic shifts and individuals attaining older ages.
C. Summary
Stroke and cognitive impairment represent a significant health burden nationwide and globally. The prevalence of these conditions is projected to increase dramatically as the population demographic shifts to a greater proportion of older adults and people experience increased
15
factors and vascular disease, alcohol represents a viable target for intervention.
3.2 Alcohol Consumption Patterns in the U.S.
Several national surveys collect data on alcohol consumption including the National Health and Nutrition Examination Survey (NHANES), the Behavioral Risk Factor Surveillance System (BRFSS), the National Health Interview Surveys (NHIS), and the National Epidemiologic Survey on Alcohol and Related Conditions (NESARC) conducted by the National Institute on Alcohol Abuse and Alcoholism (NIAAA).
NHANES is a cross-sectional, nationally representative survey of US civilian,
non-institutionalized persons and includes an in-person home interview and health examination. Alcohol consumption information was collected on adults aged 20-85 years in two 2-year waves from 1999 to 2002 (Figure 2).67 Overall,
70% of adults were current drinkers, 17% were former drinkers, and 13% were
lifetime abstainers. Binge drinking, defined as consumption of 5 or more
drinks in 1 day at least once in the past year was reported by 42% of white males, 18% of white
females, 27% of black males, and 10% of black females.
The BRFSS is a state-based, cross-sectional telephone survey of non-institutionalized, civilian U.S. adults aged 18 years or older. Questions on alcohol in this survey include one on frequency of
drinking (days per week), quantity of drinking (average drinks per occasion), and frequency of binge drinking (occasions in the past 30 days during which at least 5 (for men) or 4 (for women) drinks
16
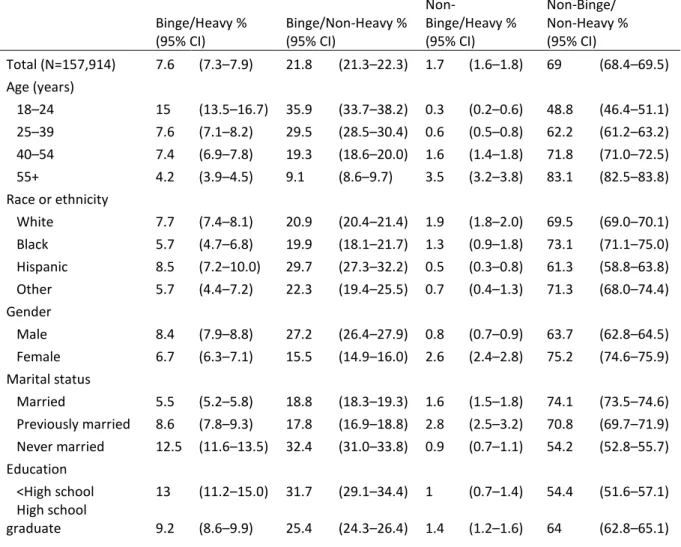
were consumed). A report from the 2006 survey cross-classified individuals according to average consumption (calculated by multiplying frequency x quantity) and binge drinking.68 Nearly 70% of current drinkers were both non-binge and non-heavy drinkers. Table 2 shows the frequency of the four drinking patterns according to socio-demographic characteristics. Consistent with other survey findings, both heavy and binge drinking were more prevalent among younger compared with older adults, in men compared with women, and among Whites compared with Blacks. Assessment of drinking patterns is important to the study of alcohol consumption because average consumption measures may under-represent harmful drinking patterns such as infrequent episodes of excessive drinking.
Table 2. Prevalence of heavy and binge drinking by sociodemographic characteristics, BRFSS 2006
Binge/Heavy % (95% CI) Binge/Non-Heavy % (95% CI)
Non-Binge/Heavy % (95% CI)
Non-Binge/ Non-Heavy % (95% CI)
Total (N=157,914) 7.6 (7.3–7.9) 21.8 (21.3–22.3) 1.7 (1.6–1.8) 69 (68.4–69.5) Age (years)
18–24 15 (13.5–16.7) 35.9 (33.7–38.2) 0.3 (0.2–0.6) 48.8 (46.4–51.1) 25–39 7.6 (7.1–8.2) 29.5 (28.5–30.4) 0.6 (0.5–0.8) 62.2 (61.2–63.2) 40–54 7.4 (6.9–7.8) 19.3 (18.6–20.0) 1.6 (1.4–1.8) 71.8 (71.0–72.5) 55+ 4.2 (3.9–4.5) 9.1 (8.6–9.7) 3.5 (3.2–3.8) 83.1 (82.5–83.8) Race or ethnicity
White 7.7 (7.4–8.1) 20.9 (20.4–21.4) 1.9 (1.8–2.0) 69.5 (69.0–70.1) Black 5.7 (4.7–6.8) 19.9 (18.1–21.7) 1.3 (0.9–1.8) 73.1 (71.1–75.0) Hispanic 8.5 (7.2–10.0) 29.7 (27.3–32.2) 0.5 (0.3–0.8) 61.3 (58.8–63.8) Other 5.7 (4.4–7.2) 22.3 (19.4–25.5) 0.7 (0.4–1.3) 71.3 (68.0–74.4) Gender
Male 8.4 (7.9–8.8) 27.2 (26.4–27.9) 0.8 (0.7–0.9) 63.7 (62.8–64.5) Female 6.7 (6.3–7.1) 15.5 (14.9–16.0) 2.6 (2.4–2.8) 75.2 (74.6–75.9) Marital status
Married 5.5 (5.2–5.8) 18.8 (18.3–19.3) 1.6 (1.5–1.8) 74.1 (73.5–74.6) Previously married 8.6 (7.8–9.3) 17.8 (16.9–18.8) 2.8 (2.5–3.2) 70.8 (69.7–71.9) Never married 12.5 (11.6–13.5) 32.4 (31.0–33.8) 0.9 (0.7–1.1) 54.2 (52.8–55.7) Education
<High school 13 (11.2–15.0) 31.7 (29.1–34.4) 1 (0.7–1.4) 54.4 (51.6–57.1) High school
17
Some college 8.4 (7.7–9.0) 22.3 (21.4–23.3) 1.4 (1.3–1.6) 67.9 (66.8–68.9) College graduate 5.3 (5.0–5.7) 18 (17.3–18.7) 2 (1.8–2.2) 74.7 (74.0–75.4) Income, $
<20,000 10.3 (9.1–11.6) 27.3 (25.3–29.4) 1.4 (1.0–1.7) 61 (58.9–63.1) 20,000–34,999 8.8 (7.9–9.8) 23.2 (21.9–24.7) 1.5 (1.3–1.8) 66.4 (64.9–67.9) 35,000–49,999 7.8 (7.1–8.6) 22.7 (21.5–24.0) 1.8 (1.5–2.1) 67.7 (66.3–69.0) 50,000–75,000 6.9 (6.2–7.5) 22 (20.9–23.0) 1.4 (1.2–1.6) 69.8 (68.7–71.0) >75,000 7 (6.5–7.6) 19.9 (19.1–20.7) 1.8 (1.6–2.0) 71.2 (70.4–72.1) * Binge drinking was defined as consuming ≥5 drinks on an occasion for men and ≥4 drinks for women. Heavy drinking was defined as consuming on average >2 drinks/day for men and >1 drink/ day for women.
Another analysis of the BRFSS assessed time trends in binge drinking according to
demographic characteristics from 1993 to 2001.69 Binge-drinking episodes increased slightly among
men from 10.8 per person per year to 12.5 and remained stable among women (2.2 to 2.7). Younger aged adults consistently had higher rates of binge drinking; among 35-54 year-olds binge-drinking episodes increased from 5.4 to 6.7 and among adults 55 and older changed little from 2.5 to 2.7. Finally, Blacks had lower binge drinking rates than Whites, increasing from 4.2 to 5.4, while Whites increased from 6.6 to 7.4. In summary, these data suggest that the heaviest drinking occurs in young white males and that this group has experienced the largest increase in consumption from the early 1990s to 2000s.
The National Health Interview Surveys from 5 years (1997-2001) were pooled to assess drinking patterns in adults over the age of 60.70 These interviews represented 15,811 men and
18
average volume estimates by different drinking patterns. It also highlights the importance of studying alcohol exposures in mid-life, which are more variable than in older adults, and that may reflect relevant exposure window.
Sales data support many of the conclusions above from self-reports regarding secular trends in alcohol consumption. Sales data have the advantage of being objective, but may not represent total alcohol actually consumed because of waste or home
production. A recent analysis from NIAAA reports that while alcohol sales have decreased
substantially from the mid-1970s, there has been a steady increase since the late 1990s (Figure 3).4
This increase is largely due to wine and spirits which offset the continued decline in beer sales. Finally, while longitudinal reports are less common than repeated, cross-sectional surveys, they support that on average individuals reduce their average consumption over the life-course. Peak consumption generally occurs in the late teens and early twenties followed by a sharp decline and stabilization in the 30-50s, with declines again in older age (~60s). Trajectories of alcohol
consumption vary by individual, and according to socioeconomic and demographic factors. 69, 71
A. Summary
The consumption of alcohol is relatively common in the United States and has increased over the past decade. Abstention increases with age and is higher in subgroups such as women and individuals of higher SES. While drinking in excess decreases with age, there remains a significant
19
portion of adults that consume more than the recommended average intake (e.g. 20% of men aged 60 and older consume 3+ drinks per day according to the NHIS). Given the high prevalence of
alcohol consumption in the US, examining potential health benefits and risks associated with this exposure may inform population scientists about the extent of disease that is attributable to alcohol exposure. The persistence of heavy drinking, particularly among certain sub-groups, suggests that there is potential reduction in disease burden that may be achieved through population
interventions to reduce heavy drinking. Reducing the proportion of persons engaging in binge and excessive drinking is part of the Healthy People 2020 goals, has been identified as a high priority health issue, and is a Leading Health Indicator.50 Estimates from 2008 for the proportion of adults
that engage in binge and excessive drinking are 27.1% and 28.2%, respectively. Targets were set for each at 24.4% and 25.4%, a reduction of roughly 3% by 2020. These targets will inform Aim 2 and
provide reasonable intervention goals for population shifts in alcohol consumption. We will estimate what effect achievement of these goals will have on stroke burden. Finally, a greater understanding of the benefits and risks of alcohol consumption may inform individual and clinician decision-making regarding risk factor modification.
3.3 Mechanisms Linking Alcohol with Stroke and Cognitive Impairment
The primary component of alcohol is ethanol (C2H5OH), which is an energy-yielding
20 than women. In addition, body composition changes as people age and percentage body water declines. This water loss slows ethanol distribution and results in higher blood alcohol content.49 Women tend to have a lower percentage
of water, which is another reason for their greater alcohol bioavailability relative to men. In addition to ethanol, some alcoholic beverages, notably red wine, contain antioxidant polyphenol compounds of the flavonoid and stilbene classes. These components have been hypothesized to confer health benefits in addition to ethanol and may have
unique cardioprotective properties.72 Red wine has the highest concentration of polyphenolic
compounds, with white wine and beer containing 10-20% the amount in red wine depending on cultivar and age.73, 74
A. Alcohol as a Risk Factor for Stroke and Cognitive Decline- Effects of Heavy Alcohol Consumption High doses of alcohol have clear deleterious effects on health that accumulate over time. There is a direct neurotoxic effect on brain structures as well as indirect health effects through elevated blood pressure, increased reactive oxygen species, reduced cerebral blood flow, and development of atrial fibrillation and cardiomyopathy.18, 75 Heavy drinking can also have negative
health effects in combination with nutritional deficiencies. One example is Wernicke-Korsakoff syndrome, a thiamine deficiency characterized by cognitive and memory deficits. Chronic alcohol abuse indirectly leads to thiamine deficiency through malnourishment and directly plays a role by interfering with the conversion of thiamine into its active form and decreasing its absorption in the intestines.45 Other nutrient deficiencies such as pellagra nicotinic acid deficiency can cause memory
Figure 4. Metabolism of ethanol into acetaldehyde by alcohol
21
impairment and lead to dementia; these symptoms typically reverse upon treatment with nicotinic acid.76
Direct neurotoxic effects of chronic heavy alcohol use can lead to cognitive deficits in the absence of nutritional deficiencies, i.e. in uncomplicated alcoholics.76 Heavy drinking results in
structural brain changes including ventricular enlargement and brain shrinkage. There is atrophy of both the white and grey matter, although evidence suggests that white matter is more severely affected.77 These structural changes are a hallmark of one form of dementia known as alcoholic
dementia, a progressive multi-domain cognitive impairment. Human studies have also shown that heavy alcohol intake can result in changes to dendrite receptors, neurotransmitters, and neuronal loss in several brain areas, most commonly the superior frontal association cortex, hypothalamus, and cerebellum.78 Damage to these areas can result in deficiencies in the areas of planning, organization, problem solving, and disinhibition. The associations of alcohol with brain
abnormalities including brain atrophy, subclinical infarcts, and white matter disease were assessed in the Cardiovascular Health Study.77 Drinking was associated with increased risk of brain atrophy
with no apparent threshold, whereas the relationship between alcohol consumption and white matter disease was U-shaped.
22
binds to the over-expressed receptors and leads to excitotoxicity.80 In this way, chronic alcohol exposure results in increased sensitivity of neurons to excitotoxicity. Upregulation of NMDA receptors leads to generation of free radicals that contribute to oxidative damage. Homocysteine, often present at unusually high concentration in the plasma of heavy drinkers, can also contribute to excitotoxicity. It is an excitatory amino acid and is able to function as an agonist at glutamate binding sites on NMDA receptors. Upon binding of the NDMA receptor, there is a prolonged influx of calcium ions that enter the cell. This leads to a cascade of events that damage cell structures and DNA and ultimately results in neuronal apoptosis (Figure 5).79
Other mechanisms may explain the neurotoxic effects of alcohol beyond those mediated through NMDA receptors.78 First, chronic ethanol exposure reduces the availability of brain-derived neurotrophic factor and receptors for nerve growth factor. These changes can impair intracellular signaling pathways contributing to neuronal cell death and malfunctioning of neural circuits. Second, the oxidative stress brought on by alcohol intake can result in DNA strand breaks and cell death. Third, damaging acetaldehyde protein adduct formation, derived from the highly reactive byproduct of ethanol metabolism, has been observed in white matter and neurons in the frontal cortex. Taken together, the neurotoxicity of alcohol may play a key role in the development of cognitive impairment through direct damage to the brain’s structure and function. These effects are likely cumulative, highlighting the importance of understanding long-term, cumulative alcohol
23 exposure when studying cognitive changes over time.
In addition to the direct neurotoxic effects described above, heavy alcohol intake has indirect effects on the brain through elevated blood pressure, atrial fibrillation and cardiomyopathy, reactive oxygen species, endothelial dysfunction, inflammation, glucose intolerance and insulin insensitivity, and reduced cerebral blood flow. These effects can increase the risk of stroke and dementia and also result in microinfarctions and lesions that contribute to cognitive decline. Alcohol intake has a dose-dependent effect on blood pressure, with consistent findings of increased blood pressure at high doses (usually more than 2 drinks per day,77, 81 but other studies have found thresholds below and above this level).82 The blood pressure response to alcohol is biphasic. Within several hours of consumption, blood pressure is lowered due to vasodilation and then 11-13 hours later rises higher than baseline levels.83 A meta-analysis of randomized controlled trials reported a mean decrease in systolic blood pressure of -3.31 mm/Hg and in diastolic blood pressure of -2.04 mm/Hg associated with interventions to reduce drinking by 67% from a baseline consumption of 3-6 drinks per day.84 Mechanisms through which alcohol affects blood pressure are not completely understood, but could include stimulation of the sympathetic nervous and the renin-angiotensin-aldosterone systems, increases in endothelin (a potent vasoconstrictor), and changes in cortisol and intracellular calcium.81, 82 Elevated blood pressure is a well-established and strong risk factor for both ischemic and hemorrhagic stroke and has been shown in some, but not all, randomized controlled trials to reduce risk of dementia.7, 61
24
proarrhythmic effects (QT interval elongation, impaired vagal heart rate control, and
hyperadrenergic activity), and enhance persistence of otherwise asymptomatic episodes.85-88 Atrial fibrillation is a known risk factor for stroke and is associated with vascular dementia.7, 61
Cardiomyopathy may develop as a result of heavy alcohol consumption and is associated with reduced ejection fraction and stroke volume and can lead to heart failure. 89, 90 Cardiomyopathy in
turn can increase the risk of embolic stroke and dementia.91, 92A common form of cardiomyopathy
identified in chronic heavy drinkers is dilated cardiomyopathy in which the heart is enlarged, weakened and contracts poorly.93 Evidence suggests that even in the absence of clinically manifest cardiomyopathy, heavy alcohol intake has a negative inotropic effect and decreases left ventricular ejection fraction.90
Alcohol increases oxidative stress which has been shown to promote endothelial dysfunction and inflammatory responses.83 Alcohol may negatively impact endothelial function through changes in adhesion molecules, interleukin-6, and C-reactive protein, and also has
prothrombotic effects through decreased fibrinolytic ability, elevations in factor VII, fibrinogen, and plasma viscosity.77, 83, 94 Inflammation and endothelial dysfunction are hallmarks of the atherogenic
process56 and together with impaired hemostatic function contribute to reduced cerebral blood flow
and increased susceptibility of the brain to injury. 61 Some studies have demonstrated that binge
drinkers have more rapid progression of atherosclerosis in carotid arteries compared with moderate and non-drinkers. Atherosclerosis of the carotid artery can lead to cerebral hypoperfusion or infarction by way of emboli from carotid plaque or thrombotic occlusion of the vessel. Measures of carotid intimal-medial thickness, a marker for atherosclerosis, are associated with both stroke and cognitive decline.7, 61 Finally, heavy alcohol consumption is associated with insulin resistance,
25
B. Alcohol as a Protective Factor for Stroke and Cognitive Decline – Effects of Low-to-Moderate Consumption
There are a number of plausible mechanisms through which alcohol may protect against stroke and cognitive decline.72 Low-to-moderate alcohol intake modulates several vascular risk
factors and is associated with increased high-density lipoprotein cholesterol, decreased fibrinogen and platelet aggregation, and improvements in inflammatory markers and insulin sensitivity.6, 42-44
These factors contribute to the formation of atherosclerosis and thrombosis, which when present in the carotid or cerebral arteries, contributes to ischemic stroke risk. Moderate alcohol consumption may reduce the risk of cognitive impairment through similar atherothrombotic mechanisms,
resulting in preserved brain vasculature and fewer subclinical infarcts. Finally, there is evidence that alcohol consumption increases acetylcholine in the hippocampus, a neurotransmitter that facilitates learning and memory.8, 18, 98
Experimental study designs and randomized feeding trials have been used to understand mechanisms of alcohol action. In these studies, participants are randomized to short-term alcohol consumption and their effects on biomarkers can be measured with minimal confounding. However, attributing disease causality to alcohol as mediated through changes in biomarkers requires the assumption that short-term changes in biomarkers reflect a long-term reduction in disease risk assuming these biomarker levels are sustained.99
Numerous trials have reported changes in biomarkers according to alcohol consumption. One of the strongest and most consistent findings is an increase in HDL cholesterol. A meta-analysis of trials with mean duration of 4 weeks reported a 4.0 mg/dl increase in HDL-C associated with intake of 30 grams of ethanol per day (the equivalent of roughly 2 standard drinks of beer (12-oz), wine (5-oz), or liquor (1.5oz)). 13 In addition, apolipoprotein A1 increased by 8.8 mg/dl and
26 authors extrapolated the effect of changes in biomarkers on disease risk and report a
predicted relative reduction in heart disease risk of 25%.13
A more recent meta-analysis, published over a decade after the earlier report by Rimm et al., found dose-dependent increases in HDL-C of 2.8, 4.0, and 5.5 mg/dl for 1-2, 2-4, and ≥5
drinks per day, respectively, and no change in LDL.100 For a similar 30-g dose as assessed in the
previous meta-analysis, HDL increased 3.7 mg/dl and apolipoprotein AI increased 8.7 mg/dL, quite similar to the results of Rimm et al. In contrast to the earlier results, the authors reported significant decreases in fibrinogen (-0.2 g/L) and no change in triglyceride levels except at very high doses of alcohol (>60 g/day was associated with a 24.3 mg/dL increase). Finally, adiponectin increased 0.56
mg/L with alcohol consumption, which is hypothesized to result in improved insulin sensitivity. Results were inconsistent with regard to changes in endothelial and hemostatic factors other than fibrinogen, with some studies reporting cardioprotective changes in these factors and others reporting no change. Put in a clinical context, these findings suggest alcohol produces meaningful changes in biomarkers. Moderate alcohol intake appears to increase HDL-C more than single pharmacological interventions, which increase HDL-C levels roughly 2.6 mg/dl.101 Furthermore, a 1
gram/L increase in fibrinogen may double the risk of heart disease and stroke based on pooled cohort data.102
Alcohol is postulated to increase HDL-C through a variety of pathways, but the precise pathways remains unknown. Potential mechanisms include increased lipoprotein transport and lipase activity.100 HDL-C is responsible for removing LDL particles from vessel walls and therefore
27
contributes to reduced plaque build-up and atherosclerosis. Apolipoprotein A1 is a component of the HDL complex, helping to clear cholesterol from white blood cells in artery walls, and may be involved in anticlotting activity. Fibrinogen is an important factor in thrombosis, contributing to platelet aggregation, fibrin formation, and plasma viscosity and therefore is a risk factor for atherothrombotic disease.103 In addition to reducing fibrinogen concentration, alcohol may also affect its conformation and stability.100 Other studies have reported that ethanol prevents platelet
aggregation, opposes thrombin activity, and reduces inflammatory cytokines. These effects have greater inconsistencies across studies than those of HDL-C and fibrinogen, but remain potential mechanisms through which alcohol may impact risk of stroke and cognitive decline.
Elevated blood pressure is a risk factor for stroke and cognitive decline and there is evidence that light-to-moderate alcohol intake may reduce the risk for hypertension.104 Results are variable,
with some suggesting a J-shaped association in women but not men93 and others findings increased risk in black men with only moderate intake.
Metabolic abnormalities including impaired glucose tolerance, metabolic syndrome, and diabetes have been associated with stroke risk and cognitive decline.7, 95, 96 Light to moderate
drinkers have lower insulin levels, greater insulin sensitivity, and reduced risk of type II diabetes mellitus.93 Postmenopausal women who were randomized to consume 30 grams of alcohol per day had lower insulin concentrations and higher insulin sensitivity than the comparison group
consuming 0 grams of alcohol.105 These studies suggest that improved metabolic factors may
mediate part of the relationship between alcohol and stroke and cognitive decline.
28
most likely the result of ethanol rather than other components found in red wine. It is possible that the added benefit of polyphenols was not detectable in this analysis on top of the effect of ethanol. There is evidence supporting an additional role for resveratrol, a polyphenolic antioxidant found at highest concentration in red wine, and other phenolic compounds on disease risk.7374, 90, 106
Experimental evidence in animal models, cell culture, and clinical studies suggests that polyphenols in red wine (e.g. resveratrol, catechin, kaempferol, and tannic acid) can have anti-atherosclerotic, anti-inflammatory, and antithrombotic effects.74, 106 Namely, they improve endothelial function,
reduce susceptibility of LDL to oxidation, reduce oxidative stress by scavenging for free radicals and interfering with free radical-producing systems, and reduce platelet aggregation.74, 76, 90, 106 A
randomized trial testing the effects of red wine, ethanol, and dealcoholized red wine found both ethanol and polyphenols had anti-inflammatory effects (most of these were non-additive), but that only polyphenols modulated leukocyte adhesion molecules and only ethanol increased interleukin-10.107 The most likely mode of benefit from polyphenols may come from prevention of LDL
oxidation, which has been demonstrated in vitro as well as in some, but not all, human studies.108
C. Summary
29
understood and warrants further research. The goal of this dissertation is to examine the dose-dependent effects of alcohol on stroke and cognitive decline and to quantify the disease burden attributable to heavy intake.
3.4 Measurement of Alcohol Consumption A. Measurement Tools in Epidemiologic Research
Several measurement tools are available to research scientists to assess alcohol
consumption (Table 3).109 The choice of which to use depends on its feasibility, cost, performance
characteristics, and the research goal (i.e. ranking individuals in categories of exposure vs.
estimating absolute levels of intake). Measurement tools may be subjective self-reports or objective measures. Subjective measures are further classified as assessing 1) customary or ‘usual’ drinking, in which the participant is required to average intake over a defined recall period; or 2) recent drinking, which estimates both intake and within-person variability. Usual drinking measurement tools are retrospective and subject to recall errors and reporting errors. Recent drinking approaches can be either retrospective or concurrent, the latter being subject to measurement-induced
behavior change as well as reporting error.
Table 3. Tools for the measurement of alcohol consumption
Measurement Tool
Subjective vs. Objective
Type of drinking
assessed Timing Primary Limitations Single-item frequency Self-report Summary Retrospective Confounds Q and F and
does not detect infrequent heavy drinking episodes Quantity-frequency (QF) Self-report Summary Retrospective Does not capture heavy
episodic drinking or beverage specific consumption
Indexed QF Self-report Summary Retrospective May over-estimate intake depending on algorithm Extended QF Self-report Summary Retrospective May over-estimate intake if
categories overlap
30 Most recent drinking
occasion(s) Self-report Daily Retrospective Biased for irregular drinkers, may over-estimate frequency
Survey period recall Self-report Daily Retrospective Biased for irregular
drinkers, may over-estimate abstention
Diaries Self-report Daily Retrospective
or Concurrent High respondent burden; potential for behavior change
Blood alcohol content (serum, breath, urine, transdermal)
Objective Recent
exposure Retrospective Expensive; may not reflect usual drinking Other biomarkers (e.g.
GGT, CDT) Objective Recent (past 1-8 weeks) Retrospective Detects only chronic, heavy drinking; sensitivity may differ by gender
By far the most common measurement tools used in epidemiological studies are
retrospective, self-reports to assess customary drinking habits. Modes of administration for these questionnaires include interviewer-administered (in person or over the telephone) and self-administered. A variety of measurement tools are available within this category including single-item frequency-based consumption measures, quantity-frequency (QF) measures, and graduated QF.109-112
In single-item frequency-based alcohol measures, respondents are asked to report the frequency (i.e. number of drinking days in a defined period) of alcohol consumption and are provided with response categories consisting of, for example, ‘less than monthly’, ‘once per week’, and ‘one drink per day’. These questions are simple and rapidly administered, but are limited in that the response categories confound quantity and volume. Daily drinkers consuming large amounts would be captured as heavy drinkers, but not infrequent drinkers of large quantity. These questions thus differentiate better at the higher end of intake (i.e. with response options for once per day, twice per day, thrice per day, etc.), but are unable to differentiate between one drink once per week and 5 drinks once per week, because both would be categorized as drinking ‘once per week’.109
31
drinking frequency (number of drinking days over a reference period) and quantity (usual number of drinks per occasion). Quantity and frequency are often collapsed into a 1-dimensional measure, average volume, by multiplying QF responses. QF methods are simple to administer and easy to
compute, but can underestimate heavy drinking occasions. When compared with alcohol sales data, QF methods have been shown to underestimate 23-77% of predicted intake.113 Methods that incorporate additional questions on binge drinking into standard QF measures yield higher levels of reported intake. Reasons for underestimation from standard QF measures are two-fold. First, respondents are typically not given enough time (or do not take enough time) to accurately
calculate average quantity per drinking occasion. Second, respondents are likely to misinterpret the question as referring to the modal quantity or frequency and not the arithmetic mean. Because individual intake distributions are typically right-skewed, the mode will underestimate the mean. As a result of the underestimation of simple QF measures, the NIAAA Task Force recommends that
epidemiological research include at least 3 questions to measure alcohol intake: usual quantity,
usual frequency, and a third item for frequency of heavy drinking, referred to as binge drinking or heavy episodic drinking. The latter question type typically asks the respondent for the number of days over a reference period that he/she has consumed 5 or more drinks (a value of 4 or more is sometimes used for women). Questions on heavy drinking enable researchers to measure drinking patterns and may also be used to adjust average volume measures through an algorithm known as indexing. Indexing methods adjust the average number of drinks per day based on the number of reported heavy drinking days and the quantity consumed on these occasions. Standard QF
measures were compared with indexed QF methods in an analysis of 2003 BRFSS data.113 The authors reported that prevalence estimates of heavy drinking in the U.S. are higher when indexing methods are used (6.8% vs. 8.1%) as is the average number of drinks per day (0.49 vs. 0.43).
32
18-34 years, groups in which heavy drinking is most common. Finally, extended QF measures have been developed that capture drinking frequencies for different beverage types, in different
locations, or in different situations. These measures provide additional detail to researchers and also are intended to reduce the respondent burden of averaging over different situations, reducing variability.
A third measure is a derivative of the standard QF known as the graduated frequency (GF) measure. This assesses the usual frequency of drinking at various quantity levels or ‘bands’. The first step is to establish the maximum number of drinks consumed in any day within the reference period (usually chosen to be 1 year). Next, frequencies of drinking in the maximum band are assessed; this process is repeated successively in lower quantity bands. The respondent burden of averaging quantities is no longer required, but instead the respondent must accurately distribute drinking days into categories of quantity. These question types are able to provide greater detail on consumption, but are more time consuming for the respondent and therefore are infrequently used in epidemiologic studies. In addition, because of their complexity, this measure typically collapses all beverage types whereas QF methods are more easily able to incorporate separate questions on
beverage types such as wine, beer, and spirits. 109, 110, 112
The second broad category of self-reported measurement tools are those that assess recent drinking either retrospectively or prospectively. These include assessment of most recent drinking occasion(s), fixed survey period recalls, and diaries. Most recent drinking occasion questionnaires ask respondents to list all alcohol consumed on the last drinking occasion. Often the questionnaire asks for the last two to four occasions to improve the measurement, but this method is still subject to serious limitations. This technique tends to overestimate drinking frequency, particularly among irregular drinkers, and therefore has differential validity according to drinking pattern.109, 110, 112