PATIENT-CENTERED MEDICAL HOMES FOR PATIENTS WITH SEVERE MENTAL ILLNESS: UTILIZATION AND QUALITY OF CARE VARIATION IN RURAL AND URBAN AREAS
Mona Kilany
A dissertation submitted to the faculty of the University of North Carolina at Chapel Hill in partial fulfillment of the requirements for the degree of Doctor of Philosophy in the Department of Health
Policy & Management in the Gillings School of Global Public Health.
Chapel Hill 2014
iii ABSTRACT
Mona Kilany: Medical Homes for Patients with Severe Mental Illness: Utilization and Quality of Care Variation in Rural Areas
(Under the direction of Joseph Morrissey)
In rural areas, people with severe mental illness (SMI) often have more difficulties accessing mental health services. As a result, the responsibility for addressing both physical and mental needs is likely to fall to the primary care provider. The patient-centered medical home (PCMH) has been proposed as a model for prevention, care coordination, and management of chronic disease. There is a growing body of literature on adults in the PCMH. However, there is very little on people with SMI in the PCMH and the performance of the model in rural versus urban areas remains unknown.
The objective of this dissertation was to examine the performance of the PCMH for Medicaid beneficiaries with SMI living in urban and rural areas based on a set of health services utilization and quality of care outcomes. First, it examined if there were differences for Medicaid patients with SMI between urban, non-metropolitan urban and rural PCMHs. Next, it focused on the impact of the PCMH in rural areas by examining primary care provider experience with SMI and, then, the interaction between the mental health workforce supply with primary care provider experience with SMI. North Carolina Medicaid administrative paid claims data from 2004-2007 was used to analyze the outcomes in this dissertation.
iv
v
ACKNOWLEDGEMENTS
I owe great thanks to so many people for supporting me throughout this dissertation process. First and foremost, I would like to express my appreciation to my dissertation committee: Joseph Morrissey, Marisa Domino, Pam Silberman, Kathleen Thomas, and Carlos Jackson. I especially want to acknowledge my dissertation chair, Joseph Morrissey for his time, patience and thoughtful feedback on the countless drafts he reviewed. I would also like to thank Marisa Domino for sharing her methodological expertise and providing me with guidance for the Medicaid claims. Thank you also to Kathleen Thomas for her support as I worked through dissertation topics that never came to fruition and for her continued support when I finally found a topic that worked. Thank you to Pam Silberman and Carlos Jackson for your insights into Community Care of North Carolina and helping to improve the focus of my dissertation. This dissertation is a higher quality because of my committee’s influence.
There were so many other members of the faculty in Health Policy and Management who guided and supported me throughout my time at UNC, but no one more than Morris Weinberger. I can never fully express my gratitude to Morris for his unwavering support through the good times and the bad. He has been willing to listen, been a constant source of advice and his mentorship has taught me how to have a rational eye on everything. For all of that, and more, I am beyond grateful.
I could not have made it through this process without the amazing support of my friends, Katie Miller, Saleema Karim, Jesse Lichstein, and Claire Lin. The hours we spent together laughing and
brainstorming random ideas on Wednesday afternoons were the best distraction from the daunting task of dissertation writing. To my dissertation ‘buddy’, Saleema, thank you for cheering me on and
vi
immense thanks to Melissa Burns for her editing support, writing knowledge, and overall amazing friendship.
I was honored this year to receive the Fran and Paul Hoch Dissertation Fellowship from the Royster Society of Fellows. This fellowship allowed me to have the dedicated time that I so greatly needed to finish my dissertation.
vii
TABLE OF CONTENTS
LIST OF TABLES ... x
LIST OF FIGURES ... xii
LIST OF ABBREVIATIONS ...xiii
CHAPTER 1: BACKGROUND & STUDY OVERVIEW ... 1
I.A. Overview ... 1
I.B. People with severe mental illness (SMI) have diverse needs that are challenging to manage in the primary care setting ... 1
I.C. Addressing both the physical and mental health needs of people with SMI varies between rural and urban primary care settings ... 4
I.D. Patient-centered medical home is an opportunity to address the challenges faced by primary care providers by bringing together networks of providers and resources ... 7
I.E. Primary care-mental health integration efforts can inform the PCMH for people with SMI ... 10
I.F. Community Care of North Carolina (CCNC) as a model of the PCMH ... 11
I.G. Conclusions and Study Overview... 13
I.H. Conceptual Framework ... 18
CHAPTER 2: METHODS ... 21
Methods Overview ... 21
Aim 1 Methods ... 21
Aim 2 Methods ... 36
viii
CHAPTER 3: RESULTS: AIM 1 ... 43
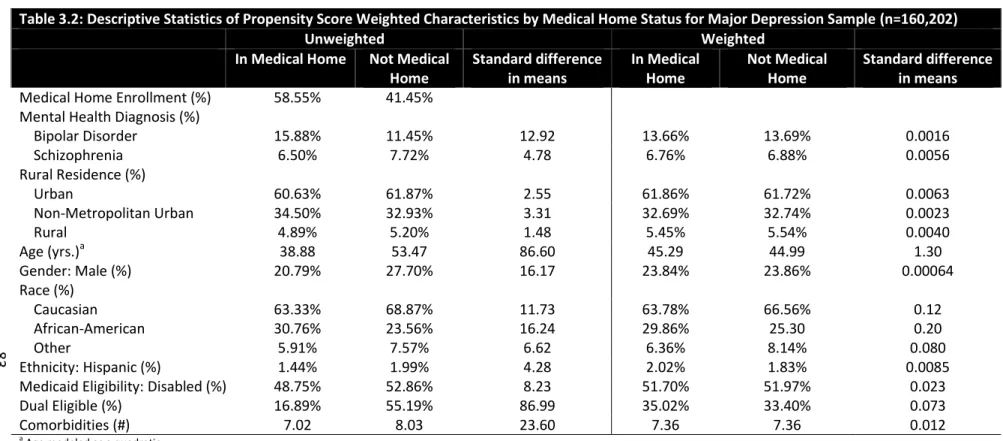
3.A. Descriptive Statistics ... 43
3.B. Primary Care Visits ... 45
3.C. Specialty Mental Health Visits ... 47
3.D. Inpatient Hospitalizations ... 48
3.E. Emergency Department Visits ... 50
3.F. Medication Adherence ... 51
3.G. Aim 1 Results Summary ... 52
CHAPTER 4: RESULTS: AIM 2 ... 54
4.A. Descriptive Statistics ... 54
4.B. Primary Care Visits ... 55
4.C. Specialty Mental Health Visits ... 56
4.E. Emergency Department Visits ... 58
4.F. Medication Adherence ... 59
4.G. Aim 2 Results Summary ... 59
CHAPTER 5: RESULTS: AIM 3 ... 62
5.A. Primary Care Visits ... 62
5.B. Specialty Mental Health Visits ... 63
5.C. Inpatient Hospitalizations ... 64
5.D. Emergency Department Visits ... 65
5.E. Medication Adherence ... 66
5.F. Aim 3 Results Summary ... 67
CHAPTER 6: DISCUSSION & POLICY IMPLICATIONS ... 69
6.A. Summary ... 69
ix
6.C. Limitations... 74
6.D. Next Steps ... 76
APPENDIX: TABLES AND FIGURES ... 78
x LIST OF TABLES
Table 2.1: Sample Size of Patients with SMI by Rurality and Medical Home ... 80 Table 3.1: Descriptive Statistics of Propensity Score Weighted Characteristics
by Medical Home Status for SMI Sample ... 82 Table 3.2: Descriptive Statistics of Propensity Score Weighted Characteristics
by Medical Home Status for Major Depression Sample ... 83 Table 3.3: Descriptive Statistics of Propensity Score Weighted Characteristics
by Medical Home Status for Bipolar Disorder Sample ... 84 Table 3.4: Descriptive Statistics of Propensity Score Weighted Characteristics
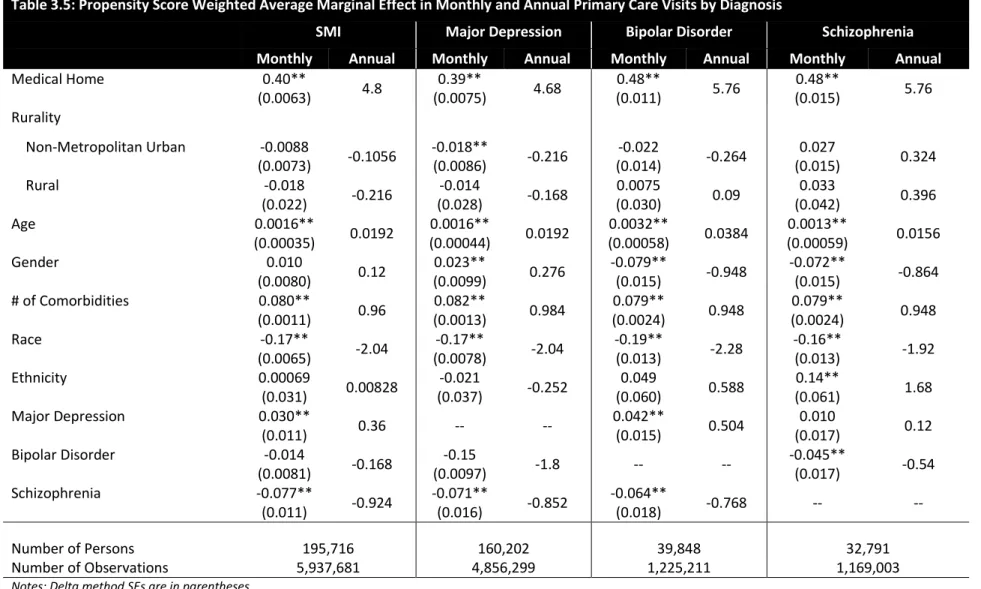
by Medical Home Status for Schizophrenia Sample ... 85 Table 3.5: Propensity Score Weighted Average Marginal Effect in Monthly and
Annual Primary Care Visits by Diagnosis ... 86 Table 3.6: Propensity Score Weighted Average Monthly and Annual Marginal
Effect of Medical Home Status Simulation on Rurality for Primary Care Visits
by Diagnosis ... 87 Table 3.7: Propensity Score Weighted Average Marginal Effect in Monthly and
Annual Specialty Mental Health Visits by Diagnosis ... 88 Table 3.8: Propensity Score Weighted Average Monthly and Annual Marginal
Effect of Medical Home Status Simulation on Rurality for Specialty Mental Health
Visits by Diagnosis ... 89 Table 3.9: Propensity Score Weighted Average Marginal Effect in Monthly and
Annual Inpatient Hospitalizations by Diagnosis ... 90 Table 3.10: Propensity Score Weighted Average Monthly and Annual Marginal
Effect of Medical Home Status Simulation on Rurality for Inpatient Hospitalizations
by Diagnosis ... 91 Table 3.11: Propensity Score Weighted Average Marginal Effect in Monthly and
Annual Emergency Department Visits by Diagnosis ... 92 Table 3.12: Propensity Score Weighted Average Monthly and Annual Marginal
Effect of Medical Home Status Simulation on Rurality for Emergency Department
Visits by Diagnosis ... 93 Table 3.13: Propensity Score Weighted Average Marginal Effect of Monthly
xi
Table 3.14: Propensity Score Weighted Average Monthly and Annual Marginal Effect of Medical Home Status Simulation on Rurality for Medication Adherence
by Diagnosis ... 95 Table 4.1: Descriptive Statistics of Rural Medical Home Sample by Diagnosis ... 96 Table 4.2: Average Marginal Effect in Monthly and Annual Primary Care Visits
by Diagnosis in Rural PCMH ... 97 Table 4.3: Average Marginal Effect in Monthly and Annual Specialty Mental
Health Visits by Diagnosis in Rural PCMH ... 98 Table 4.4: Average Marginal Effect in Monthly Likelihood of Any Inpatient
Hospitalizations by Diagnosis in Rural PCMH ... 99 Table 4.5: Average Marginal Effect in Monthly and Annual Inpatient
Hospitalizations by Diagnosis in Rural PCMH ... 100 Table 4.6: Average Marginal Effect in Monthly Likelihood of Any Emergency
Department Visits by Diagnosis in Rural PCMH ... 101 Table 4.7: Average Marginal Effect in Monthly and Annual Emergency
Department Visits by Diagnosis in Rural PCMH ... 102 Table 4.8: Average Marginal Effect of Monthly Medication Adherence by Diagnosis
in Rural PCMH ... 103 Table 5.1: Average Marginal Effect in Monthly and Annual Primary Care Visits by
Diagnosis in Rural PCMH ... 104 Table 5.2: Average Marginal Effect in Monthly and Annual Specialty Mental
Health Visits by Diagnosis in Rural PCMH ... 105 Table 5.3: Average Marginal Effect in Monthly Likelihood of Any Inpatient
Hospitalizations by Diagnosis in Rural PCMH ... 106 Table 5.4: Average Marginal Effect in Monthly and Annual Inpatient
Hospitalizations by Diagnosis in Rural PCMH ... 107 Table 5.5: Average Marginal Effect in Monthly Likelihood of Any Emergency
Department Visits by Diagnosis in Rural PCMH ... 108 Table 5.6: Average Marginal Effect in Monthly and Annual Emergency
Department Visits by Diagnosis in Rural PCMH ... 109 Table 5.7: Average Marginal Effect of Monthly Medication Adherence
xii LIST OF FIGURES
Figure 1.1: The Chronic Care Model ... 78 Figure 1.2: North Carolina Counties by Rural-Urban Continuum Code ... 78 Figure 1.3: Conceptual Framework of Accessing Care in the Patient-Centered
Medical Home ... 79 Figure 2.1: Graph of Average Treatment Effect Weights Over Time
xiii
LIST OF ABBREVIATIONS
1
CHAPTER 1: BACKGROUND & STUDY OVERVIEW I.A. Overview
The patient-centered medical home (PCMH) is a model for prevention, care coordination, and management of chronic disease. This model can assist primary care providers in addressing the diverse needs of people with severe mental illness (SMI) who have a high rate of physical comorbidities (Kessler et al., 2005). Managing both the physical and mental health needs of patients with SMI can be complex for primary care providers. Due to the lack of mental health resources, rural primary care providers are more likely to assume the responsibility for managing both physical and mental health needs of their patients with SMI than urban primary care providers (Wang et al., 2005). Most of what is known about the PCMH is from children’s health services (Sia, Tonniges, Osterhus, & Taba, 2004), but there is a growing body of literature on adults in the PCMH. Findings by Domino and colleagues (under review) show that patients with SMI increased primary care and specialty mental health utilization in a PCMH compared to those not in a PCMH. However, more research is needed on the performance of the PCMH model for people with SMI in rural versus urban areas. Understanding the conditions necessary for rural PCMHs to be successful in promoting primary care and mental health services utilization and quality of care will help rural areas better address the physical and mental health needs of patients with SMI.
I.B. People with severe mental illness (SMI) have diverse needs that are challenging to manage in the primary care setting
non-2
affective psychoses (i.e. schizophrenia) (Kessler et al., 2006). Affecting approximately one-quarter of people with mental disorder, people with SMI frequently experience a higher rate of physical
comorbidities and an earlier age of onset of these comorbidities than the general population, are less likely to have insurance coverage or have a usual source of primary medical care (Bradford et al., 2008; Kessler et al., 2005; Kessler, et al., 2006; Wang, et al., 2005).
Some researchers have suggested that the primary care setting has become the de facto mental health system for people with SMI (Fox, Merwin, & Blank, 1995; Regier et al., 1993; Wang, Demler, & Kessler, 2002). Specifically, Regier et al. (1993) found that primary care providers are the only source of care, including their mental health care, for nearly one-third of people with SMI. More recent analyses show that approximately 20-23% of people with SMI receive all of their mental health care from primary care (Wang, et al., 2002; Wang, et al., 2005). Additionally, people with SMI report more problems accessing care in any health care setting, including difficulties getting appointments and getting prescriptions when needed (Bradford, et al., 2008). Specifically, people with SMI are four to six times more likely to report needing medical care and needing prescriptions but were unable to get access to these services compared to people without SMI (Bradford, et al., 2008). As a result of these barriers to accessing needed services, people with SMI were also four to five times more likely to delay their medical care because they were concerned about the cost of the care than people without SMI (Bradford, et al., 2008; Wang, et al., 2005). Among people with SMI, people with schizophrenia and bipolar disorder are more likely to report having problems accessing needed care or receiving minimally adequate care than are people with depression, (Bradford, et al., 2008; Wang, et al., 2002; Wang, et al., 2005).
3
findings using data from the National Comorbidity Survey, a nationally representative sample of the United States population, but focused on mental health disorders. Additionally, these surveys rely on respondents self-reporting on access to care questions such as whether they accessed care or
prescriptions when needed, or delayed care for any reason. While self-report questions and responses provide useful information on access to care problems, they do not allow for further analysis necessary for understanding the structural barriers associated with access to care. More in-depth research on the types of health care settings respondents try to access along with the specific reasons why they cannot get care when needed is necessary, but cannot be conducted from the data available in these nationally representative surveys.
4
the complexity of managing SMI care in a primary care setting and that the care currently provided is not meeting the needs of people with SMI.
I.C. Addressing both the physical and mental health needs of people with SMI varies between rural and urban primary care settings
The mental health system in rural areas often has fewer treatment and support resources available to people with SMI than the mental health system in urban areas. In particular, rural mental health services are more likely than urban areas to rely heavily on small networks of community mental health service boards, primary care providers, social services and informal care networks such as rural churches (Fox, et al., 1995; Hauenstein, 2008). Stigma and attitudes towards mental illness in rural areas are also serious barriers to care for people with SMI. People with SMI in rural areas report more
concerns about community and provider attitudes towards both mental illness and seeking treatment for mental illness(Fox, et al., 1995). There are also concerns among people with SMI that their providers will treat them unkindly or unfairly due to their mental illness (Fox, Blank, Rovnyak, & Barnett, 2001; Hauenstein, 2008).
Providing care for people with SMI can present more challenges in rural areas than in urban areas. People with SMI in rural areas are less likely to receive any mental health services and are even less likely to receive specialty mental health services (Hauenstein et al., 2007). People with SMI in rural areas are more likely to be worse off economically and have worse health status than a similar
5
areas (Adams, Xu, Dong, Fortney, & Rost, 2006; Flaskerud & Kviz, 1982; Hauenstein, et al., 2007; Probst, et al., 2006).
Based on the characteristics of rural areas and the people with SMI living there, providing care for this population is challenging for two main reasons: 1) availability of necessary mental health services and, 2) limited specialty mental health services when care is accessed.
The availability of mental health providers serving rural communities is one of the commonly cited reasons for difficulty accessing necessary mental health services in rural areas. In a survey of primary care providers, rural primary care providers reported greater difficulty getting referrals to mental health providers than urban primary care providers (Cunningham, 2009; Fox, et al., 1995). Approximately two-thirds of rural primary care providers report being unable to get referrals for mental health services for people identified as needing mental health care because of shortages of mental health providers serving rural areas (Cunningham, 2009). Referral problems are more common for rural primary care providers in areas with a smaller supply of mental health providers. In rural counties with a moderate supply of psychiatrists (8 or more per 100,000), primary care providers are 12% less likely to report referral problems for people with SMI than physicians in counties with a lower supply of
psychiatrists (Cunningham, 2009). The lower the supply of mental health providers available to accept in referrals, the greater the burden on rural primary care providers to be the sole provider addressing the patient’s mental health needs.
6
were 14% more likely to report not being able to get outpatient mental health referrals for their patients than rural primary care practices with fewer charity care and Medicaid patients. Additionally, both rurality and lower income are strong predictors of whether a county have a shortage of mental health providers (Thomas, Ellis, Konrad, Holzer, & Morrissey, 2009). Similar to provider supply problems, the burden of addressing a person’s mental health needs falls back to the rural primary care provider when people with SMI cannot get referrals to mental health providers.
When people with SMI in rural areas are able to access mental health care, they see different providers for their mental health services compared to urban areas. In general, the greater the degree of rurality, the lower likelihood of any mental health treatment (Hauenstein, et al., 2007). Patterns of care show that, in rural areas, people with SMI are more likely to receive all of their care from primary care providers. They are also two to three times more likely to visit primary care providers than mental health providers for their mental health needs (Fox, et al., 1995; Himelhoch & Ehrenreich, 2007). The degree of rurality is also associated with the likelihood that rural primary care providers will provide more mental health services, with primary care providers in the more rural locations assuming the responsibility for providing more mental health services (Yuen, et al., 1996). In this instance, the degree of rurality was defined as the distance from metropolitan areas and population size with greater rurality defined as a community of approximately 3,500 people and over 45 minutes by car to the nearest metropolitan area.
7
mental health reasons than people with SMI in urban areas (Hartley, et al., 2007; Rost, Adams, Xu, & Dong, 2007; Rost, et al., 1999). Specifically, they are two to three times more likely to be hospitalized for either physical or mental health problems than a similar population in urban areas. The higher likelihood of having an inpatient hospitalization decreases when controlling for the number of outpatient specialty visits (Rost, et al., 1999), suggesting that if people with SMI were to receive the necessary outpatient specialty mental health services, an inpatient hospitalization could be avoided.
I.D. Patient-centered medical home is an opportunity to address the challenges faced by primary care providers by bringing together networks of providers and resources
Research shows that people with SMI have a hard time accessing necessary primary care and mental health services, while primary care providers have a hard time meeting mental health needs and finding referral services for these people. These problems are even worse in rural areas. Given the challenges of managing people with SMI in primary care settings and the challenges of accessing mental health services in rural areas, the PCMH can serve as a model to improve care for people with SMI in primary care.
8
and payments that reflect the added value of the PCMH to patient care (Iglehart, 2008). The Agency for Health Research and Quality narrowed the definition of the PCMH to focus on five features: care that is 1) comprehensive, 2) patient-centered, and 3) coordinated while also providing 4) accessible, and 5) quality and safe services to patients (Agency for Healthcare Research & Quality, n.d.).
9
to compare the results of the participants in PCMH, which makes it difficult to determine if the observed effects were due to the PCMH or other factors (Peikes, et al., 2012).
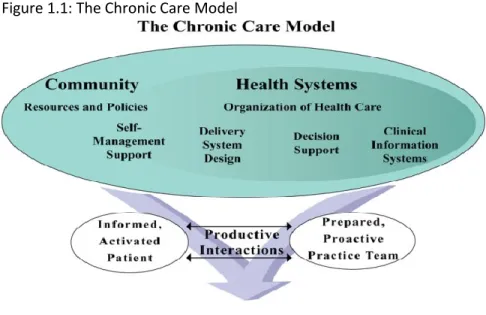
The chronic care model (Figure 1.1) is a model that informs the way that the PCMH influences patient outcomes (Bodenheimer, Wagner, & Grumbach, 2002), and has frequently been used as the framework for mental health-primary care integration programs (Butler et al., 2008). In the chronic care model, the entire health care system coordinates care while integrating community resources with an informed patient and a treatment team. The elements of the chronic care model include the health system, delivery system design, decision support, clinical information systems, self-management support, and the community. All of these settings and systems should collaborate to agree on appropriate treatment and resources for the patient. This holistic approach to treatment leads to improved patient outcomes and patient care (Coleman, Austin, Brach, & Wagner, 2009). People receiving care within the chronic care model had fewer emergency department and inpatient hospital visits, reported improved quality of life and were more knowledgeable about their chronic health conditions (Coleman, et al., 2009).
10
To date, PCMH programs have been implemented in 17 states, including North Carolina, through state Medicaid programs and/or, private insurers. Early results show improved access to care and higher patient satisfaction (Takach, 2011). States are experimenting with payment incentives, coaching for providers, learning collaboratives and networks that support participating practices
(Takach, 2011). An analysis of a non-profit insurer’s PCMH initiative found that patients in the PCMH had fewer primary care and specialist care visits (Fontaine, Flottemesch, Solberg, & Asche, 2011). This analysis, however, did not analyze how health services utilization varied for people with more diverse health care needs (i.e. specific diagnoses or comorbidities) and was unable to determine or whether fewer primary care and specialty care visits resulted in improved quality of care or patient health-related outcomes.
I.E. Primary care-mental health integration efforts can inform the PCMH for people with SMI
With relatively little research on the effect of the PCMH for people with SMI, related literature on integrating mental health services into primary care can be used to inform this analysis. Primary care-mental health integration provides a context for understanding the benefits and challenges that the PCMH for people with SMI might experience moving forward. Integrated care aims to increase
collaboration between mental health and primary care providers with the goal of increasing the ability of primary care providers to provide high quality mental health care, and improving the ability of primary care providers to screen and refer people for mental health treatment (Butler, et al., 2008).
11
strong communication and coordination between providers improved patient outcomes for depression (Krahn et al., 2006). In addition, only a few primary care-mental health integration efforts have been conducted in rural areas. One analysis of depression management in primary care looked at rural-urban differences in patient outcomes (Rost, et al., 2007). They showed that the depression management program improved patient outcomes in urban areas, but did not find equivalent improvements in patient outcomes in rural areas (Butler, et al., 2008; Rost, et al., 2007). Specifically, even with the depression management program, rural patients had more hospitalizations than did urban patients (Rost, et al., 2007). Nevertheless, the analysis found evidence of rural primary care providers increasing their use of depression-specific treatment guidelines.
Similar to primary care-mental health integration efforts, the PCMH aims to bring together resources, such as case managers and resources associated with managing care for people with SMI that did not previously exist for primary care practices. In some instances, incorporating case management or involving mental health providers in treatment discussions has been shown to improve patient response to treatment (i.e., adherence to medications) as well as improved management of mental health needs by primary care providers (i.e., guideline based care) (Butler, et al., 2008; Krahn, et al., 2006; O'Connor, Whitlock, Beil, & Gaynes, 2009; Rost, et al., 2007). In rural areas in particular, these additional resources are expected to assist primary care PCMHs in overcoming the challenges of providing care for people with SMI in rural areas. However, care managers may only have a significant impact assisting primary care providers in the rural areas where there is a sufficient supply of mental health providers and community mental health services that care managers can use to coordinate services.
I.F. Community Care of North Carolina (CCNC) as a model of the PCMH
In 1998, the North Carolina Division of Medical Assistance created the CCNC system that
12
treatment, and referral services (Willson, 2005). Primary care providers agreeing to participate in CCNC receive a per member per month enhanced case management fee and each CCNC network receives another per member per month enhanced care management fee (Ricketts, Greene, Silberman, Howard, & Poley, 2004). With the enhanced case management fee, primary care providers are expected to conduct a comprehensive assessment, develop individualized care plans, coordinate care, and monitor each patient’s progress. The network uses the enhanced care management fee to hire local case managers and resources associated with managing beneficiaries. The minimum requirement is that CCNC networks include local primary care providers, local hospitals, local health department, and the Department of Social Services. This network forms a 501(c)3 corporation to receive and manage the enhanced care management fee. The resources provided by the CCNC networks to participating primary care providers are essential to the success of the PCMH model. These resources are particularly helpful in rural areas of North Carolina where fewer resources exist.
Analyses have been conducted on CCNCs disease management programs, particularly, asthma and diabetes disease management (Ricketts, et al., 2004). Ricketts et al. (2004) showed that the CCNC disease management program improved outcomes for beneficiaries. The evaluation showed that both programs reduced hospitalizations and emergency department visits for beneficiaries with asthma or diabetes. This study period of this evaluation occurred during the early years of CCNC (2000-2002); as a result, some of the improved outcomes may have been associated with early adopters (providers and patients) who were more likely to adhere to the disease management programs and experience positive outcomes. Additionally, the evaluation did not make any adjustments for selection bias for both
13
counties, but it did not discuss the rurality of counties or whether there were significant differences in utilization outcomes between rural and urban areas.
There have been a few more recent studies of CCNC as a PCMH model looking at (1) children with asthma (Domino, Humble, Lawrence, & Wegner, 2009), and (2) people with SMI (Domino, Wells, & Morrissey, under review). Domino et al. (2009) showed that the quality of asthma care improved while hospitalizations and emergency department visits decreased for children with asthma in the PCMH. This study of children with asthma adjusted for selection into CCNC using a fixed effects model, but did not evaluate other methods of adjusting for selection such as propensity score methods or instrumental variables. Additionally, the findings from the study on children with asthma do not generalize to an adult SMI population. Adults with SMI have different health and mental health care needs as well as family or social supports than children with asthma. Findings from Domino et al. (under review) found that people with SMI increased primary care and specialty mental health utilization. Missing from all of the CCNC analyses is an understanding of the differing effect of the PCMH model in rural versus urban areas of North Carolina, which is important given that 60 of North Carolina’s 100 counties are designated as non-metropolitan by the 2003 Rural/Urban Continuum Codes (Figure 1.2).
I.G. Conclusions and Study Overview
14
areas. Rural primary care providers experience more difficulties getting referrals to mental health providers for their people with mental health needs (Cunningham, 2009; Fox, et al., 1995). As a result, primary care providers take a greater role in the mental health care as shown by people with SMI using more primary care than mental health care and more rural primary care providers providing
psychotherapy (Fox, et al., 1995; Himelhoch & Ehrenreich, 2007; Lambert, Agger, & Hartley, 1999; Yuen, et al., 1996). Involving care managers and mental health providers in primary care delivery is believed to improve the communication between mental health and primary care providers when caring for people with SMI in the PCMH (Alakeson, Frank, & Katz, 2010; Centers for Medicare & Medicaid Services, November 16, 2010; The Kaiser Commission on Medicaid and the Uninsured, 2011). As the lessons from the primary care-mental health integration literature illustrate, increased involvement of and
communication with mental health providers in primary care practices improves outcomes for people with SMI (Butler, et al., 2008). However, the impact of primary care-mental health integration in rural areas is less clear since fewer analyses have looked primarily at rural areas or analyzed the differences that exist between rural and urban areas. Given the challenges of addressing the needs of people with SMI in rural primary care, the gaps in the literature, and the renewed emphasis on the PCMH model, it is important to gain a better understanding of the issues rural areas might face translating the PCMH model into practice for people with SMI.
The objective of this study is to examine the performance of the PCMH for Medicaid
15
Aim 1:To determine if differences in health services utilization and quality of care exists for
patient-centered medical home status between rural and urban areas for Medicaid patients with SMI.
The hypothesis for this aim is that Medicaid patients with SMI in urban PCMHs will have higher health services utilization and quality of care than Medicaid patients with SMI in rural PCMHs.
As shown in the literature, there are rural-urban differences in primary care as well as mental health care access and utilization problems for people with SMI in rural areas (Cunningham, 2009; Yuen, et al., 1996). Currently, the impact of the PCMH model on these rural-urban differences is unknown. Given that the chronic care model and primary care-mental health integration have been shown to be effective when providers have sufficient clinical guideline support, practitioner coordination teams and community linkages (Butler, et al., 2008; Coleman, et al., 2009), it is expected that the PCMH model will significantly improve health services utilization and quality of care for Medicaid beneficiaries with SMI in urban areas over what PCMHs are able to accomplish for this population in rural areas. This is because urban areas provider more of the infrastructure upon which the PCMH relies, including ample specialty mental health referral sources and high population densities. However, prior research has not examined rural-urban differences in PCMHs for people with SMI. Learning more about rural-urban differences in health care utilization and health care quality for people with SMI is an important first step in
determining the full impact and the conditions for success of the PCMH model on the physical and mental health care needs of people with SMI.
16
by focusing on understanding the role played by primary care and mental health workforce in rural areas in meeting the health services utilization and quality of care needs of people with SMI in the PCMH.
Aim 2:To determine whether the performance of PCMHs in rural areas on health services
utilization and quality of care for patients with SMI varies with primary care provider experience with
SMI. The hypothesis for this aim is that PCMH patients with SMI in rural areas receiving care from primary care providers with high SMI caseloads will have improved health services utilization and quality of care than those receiving care from primary care providers with low SMI caseloads.
The medical literature has studied volume as the number of cases per year from two
perspectives, hospital volume and physician volume (Halm, Lee, & Chassin, 2002). The assumption is that more experience with certain medical procedures leads to better patient outcomes because the providers become more proficient with these procedures when they are conducted more frequently. Additionally, it is believed that hospital or physician volume continues to increase because of referrals from other providers as a result of better outcomes from higher experience (Halm, et al., 2002). The main outcome among the medical literature on volume and outcomes is mortality rates, which is not as relevant for chronic condition such as SMI. The relationship between volume and quality in mental health care has been studied at the managed care plan level, specifically focusing on several HEDIS measures such as follow-up care after hospitalizations and medication management (Druss, Miller, Pincus, & Shih, 2004). Druss and colleagues (2004) found that at the managed care plan level, plans with lower mental health care volume had weaker performance on HEDIS performance measures. However, the association between primary care provider volume of people SMI has not been studied.
17
utilization and quality of care is affected when primary care providers gain more experience managing the needs of people with SMI in the PCMH.
Aim 3: To assess the extent to which the performance of PCMHs in rural areas on health
services utilization and quality of care for patients with SMI varies with the extent of mental health
workforce shortages and experience with SMI. The hypothesis for this aim is that PCMH patients with SMI in rural areas that have less mental health workforce shortages and receive care from primary care providers with high SMI caseloads will have improved health services utilization and quality of care relative to other rural areas
Connecting primary care providers with the necessary mental health resources such as
18
Understanding the constraints on PCMHs in rural areas associated with limited mental health provider availability and primary care providers experience treating SMI will inform us about the challenges and barriers facing the PCMH for people with SMI. This study seeks to broaden the understanding of the facilitators and barriers associated with developing PCMHs in rural communities and their role in care for people with SMI.
I.H. Conceptual Framework
The conceptual framework for this analysis is based on the Andersen and Aday behavioral model for health service use (Aday & Andersen, 1974; Andersen, 1995). The Andersen and Aday model seeks to understand why people use health services, measure access to care and inform policies that will address the issues associated with why and how people use health services. This model reflects the ways in which the health care delivery system, the population characteristics, and health behaviors influence patient outcomes and satisfaction with care.
The health care delivery system refers to the environment where care is delivered to patients. Use of health services is represented as a function of population characteristics. The population
19
With respect to how the PCMH assists primary care providers in addressing the physical and mental health needs of patients with SMI in rural areas, the conceptual framework (Figure 1.3) focuses on the PCMH as the health care environment. The PCMH, building on concepts from the chronic care model (Figure 1.1), has a direct influence on the health services utilization and quality of care outcomes. The impact of the PCMH on outcomes (i.e. utilization and expenditures) for patients with SMI has been assessed elsewhere (Domino, et al., under review). In addition to the direct influence of the PCMH on outcomes, a set of population characteristics that includes the predisposing characteristics and enabling resources from the Andersen and Aday model directly affects outcomes. The predisposing
characteristics used for this analysis will be the individual characteristics of age, sex and race along with the individual’s health status that were also controlled for in Domino et al. (under review).
Aim 1 of the analysis builds upon previous research by including rural/urban residence as an important context characteristic that is expected to influence outcomes for patients with SMI in the PCMH. The PCMH model emphasizes prevention, care coordination, and management of chronic disease. Linking primary care providers with care managers, specialty mental health providers and additional information about managing care for people with SMI provides both urban and rural areas with the additional support that allows both areas to develop successful PCMHs and help to lessen the differences that currently exist between urban and rural areas.
20
outcomes: experience with SMI mental health and workforce supply. Specifically, rural primary care providers with greater experience with SMI (Aim 2) is expected to influence the health services
utilization and medication adherence outcomes in the rural PCMH setting. The burden of meeting both the physical and mental health needs often fall to rural primary care providers. This burden gives primary care providers with higher SMI caseloads more experience at caring for people with SMI, and therefore, more experience with how to improve the outcomes of people with SMI. Additionally, within the context of the rural PCMH, primary care providers have access to care managers and additional educational information on treating SMI such that having a higher volume of patients with SMI would prepare them on treating patients with SMI and influence patient outcomes. In combination with the primary care provider caseload size from Aim 2, mental health provider shortages were likely to
21
CHAPTER 2: METHODS
Methods Overview
The study was a quasi-experimental design of North Carolina Medicaid paid claims data of Community Care of North Carolina (CCNC) model of a patient-centered medical home (PCMH). It examined if the health service utilization and quality of care for people with severe mental illness (SMI) was different across urban and rural PCMHs. It examined people with SMI in PCMHs compared to those in fee-for-service Medicaid between rural and urban areas (Aim 1), explored differences in the impact of the PCMH in rural areas by examining primary care provider experience with SMI (Aim 2) and, the combined effect of the mental health workforce supply with primary care provider experience with SMI (Aim 3). These aims were tested using a generalized estimating equation approach and propensity score methods to account for potential selection problems.
Aim 1 Methods
To determine if differences in health services utilization and quality of care exists for PCMH status between rural and urban areas for Medicaid people with SMI.
1. A. Data
The data for this analysis were North Carolina Medicaid paid claims during 2004-2007 (January 1, 2004-December 31, 2007). The data were obtained through the Carolina Cost and Quality Initiative on individuals with major depression bipolar disorder, and schizophrenia and were used in previous
22
program. The data were collapsed to the person-month level. In addition to the Medicaid paid claims, the 2003 Rural-Urban Continuum codes were added for each county.
The period for this analysis (2004-2007) covered the time when CCNC was expanding the PCMH model statewide beyond the early focus on children with asthma. During the study period, an increasing number of adults began receiving care under the PCMH. Additionally, this period also allowed for a comparison of people with SMI in a PCMH compared to people with SMI in fee-for-service Medicaid. This comparison was necessary to determine if the outcomes of people with SMI in the PCMH were the result of the care offered in the PCMH rather than other factors.
During the period for this analysis, North Carolina was also in the midst of significant statewide mental health reform, starting in 2001. The mental health reform restructured the mental health system to create local management entities which had connections with the local community, including the county government and community mental health providers (Rash, 2012). It was expected that all of the North Carolina counties (rural and urban) as well as PCMH and fee-for-service were equally affected by this mental health reform during the study period and did not significantly affect the utilization and quality of care outcomes.
1.B. Sample
23
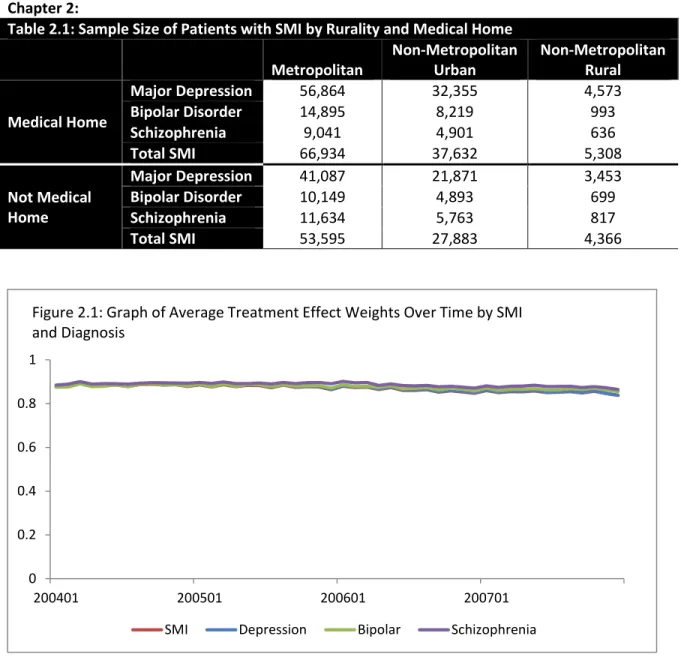
There was a total number 195,718 people with SMI in the sample, with 160,203 diagnosed with major depression, 39,848 diagnosed with bipolar disorder, and 32,791 diagnosed with schizophrenia (Table 2.1). The sample was broken into two categories by diagnosis: (1) people with SMI enrolled in the PCMH and, (2) people with SMI in fee-for-service Medicaid. People with SMI were allowed to switch in an out of the PCMH during the study period. Among people with major depression, bipolar disorder and schizophrenia, 58%, 60% and 44%, respectively, on average over the study period were in the PCMH category.
The sample was also broken down by rurality based on the 2003 Rural-Urban Continuum codes. Many analyses studying rural areas only used binary variables that separate areas into only rural and urban categories. There are several different definitions for defining rural areas, but one overarching definition of rural does not currently exist (Coburn et al., 2007; Hall, Kaufman, & Ricketts, 2006). Some have argued that regardless of the definition used, using a simple binary variable to define rural and urban areas does not fully capture the differences that exist within rural areas (Hall, et al., 2006); rurality is not necessarily homogenous. As a result, a three-level categorical variable based on the 2003 rural-urban continuum codes was used in order to expand beyond what is known about rural areas and consider the impact of degree of rurality on health services utilization and quality of care for people with SMI. The rural-urban continuum codes used in this analysis allowed rurality to be defined by
metropolitan counties and non-metropolitan counties broken down further by degree of urbanization and adjacency to metropolitan/non-metropolitan areas (United States Department of Agriculture Economic Research Service, 2004).
1.C. Variables Dependent Variables
24
The health services utilization variables looked at visits to a variety of health settings. These were count variables of the number of health care visits to the following health care settings: 1) primary care providers, 2) outpatient mental health providers, 3) emergency departments and 4) inpatient hospitalizations. This measure was used to determine how many visits people with SMI made to each of these health care settings by PCMH enrollment in rural or urban areas.
Medication adherence was a continuous measure of the proportion of days of medication received (Benner et al., 2002; Peterson et al., 2007). The proportion was a fraction of the days in the month for which at least one medication was dispensed, with the numerator the number of days in the month with the drug on hand and the denominator the number of days in the month.
Main Explanatory Variable
The difference-in-differences estimator, rural X medical home interaction term, was the main explanatory variable for Aim 1. This was an interaction of the medical home indicator (binary variable) and rural indicator (categorical variable). It was used to show if the PCMH reduced differences in health services utilization and quality of care between rural and urban areas.
The medical home indicator was a binary variable of whether a Medicaid patient with SMI was enrolled in a PCMH or in a traditional fee-for-service Medicaid practice. The PCMH was identified based on two additional fees: (1) per member per month enhanced case management fee to the primary care practice, and (2) per member per month enhanced care management fee to CCNC network. Enrollment in the PCMH was allowed to vary from month to month during the study period.
The rural indicator was a three-level categorical variable of urban, non-metropolitan urban and rural counties in North Carolina based on the 2003 rural-urban continuum codes. The codes allowed for a maximum nine-category breakdown, with three categories for metropolitan counties and six
25
39 were non-metropolitan urban (RUC 4, 5, 6, and 7), and 21 were non-metropolitan rural (RUC 8 and 9) (United States Department of Agriculture Economic Research Service, 2004).
One advantage of the rural-urban continuum codes was that areas were categorized by county, which was a variable available in the NC Medicaid paid claims data, whereas other rurality measures rely upon zip code or population density. The 2003 rural-urban continuum codes (RUC) distinguished
between metropolitan and non-metropolitan counties by degree of urbanization and adjacency to metropolitan/non-metropolitan areas (United States Department of Agriculture Economic Research Service, 2004). Metropolitan was defined by the Office of Management and Budget and referred to central counties that had one or more urbanized areas and outlying counties that have at least 25% of workers in the county commuting to central counties. Urbanized areas were defined based on
population density. Metropolitan areas had to have a minimum population of at least 100,000. Non-metropolitan counties were based on urban clusters and fell outside the boundaries of the Non-metropolitan county definition. Urban clusters in non-metropolitan counties have populations of at least 2,500 but less than 50,000 (United States Department of Agriculture Economic Research Service, 2003).
Control Variables
Control variables for the analysis included age, sex, race, Hispanic ethnicity, dual eligibility, and comorbidities. Two forms of comorbidities were included in the analysis 1) count of the number of additional diagnosed comorbidities the individual had, and 2) presence of comorbid SMI diagnoses.
1.D. Data Analysis Selection Problem
26
outcome variables are associated with the treatment (i.e. the PCMH) and affects the internal validity of a study. Without randomization, the treatment and control groups are likely to be inherently different to begin with, which would have made it difficult to determine if other reasons played a role in improving outcomes. The choice to enroll in a program as well as the reasons associated with the decision created a situation of self-selection into treatment (i.e. PCMH) and control groups (i.e. fee-for-service). In CCNC, Medicaid beneficiaries were given the choice to enroll in the PCMH or stay in traditional fee-for-service Medicaid. As a result, the reasons associated with a beneficiary’s choice to join the PCMH were not known. The choice to enroll in a PCMH could have been associated with several possibilities, which was expected to make the treatment and control groups inherently different at the start of the analysis.
The ignorability of treatment assignment in the PCMH is the main assumption to assess whether the self-selection is a problem. The ignorability of treatment assignment assumption considers whether assignment to either treatment or control is independent of the observable outcomes (Guo & Fraser, 2010); when treatment assignment is not random, the ignorability of treatment assignment assumption is violated. Therefore, adjustments would need to be made to the data because the treatment and control groups would be unequal and part of the results on the dependent variable would be wrapped up in the self-selection (e.g. non-randomization) into the treatment group.
Correcting the Selection Problem
27
difference between those in the PCMH and those who stayed in traditional fee-for-service Medicaid. Unfortunately, there were a limited number of individual characteristic variables in the Medicaid paid claims data that could be used to control for differences between the groups. Individual level fixed effects could be used in conjunction with the individual characteristics in the data to control for
individual unobserved time invariant characteristics not observed in the data. Even after controlling for individual characteristics that were available in the data and using fixed effects, there would still likely be unobserved time-varying characteristics associated with the likelihood of enrolling in the PCMH. Not controlling for the unobserved characteristics would have biased the results of the regression analyses and only partially corrected the selection problem. There was an additional issue with using traditional multivariable modeling with individual level fixed effects due to time invariance of certain variables in the model. Specifically, the rural indicator varied very little over time and would have fallen out of a fixed effects regression analysis. While the main explanatory variable for Aim 1, the rural X medical home interaction would still be estimated, it would not be possible to estimate the effect of rurality on the outcome measures.
28
than if no instrument were used. County CCNC rates has been discussed as a good instrument because it would affect the likelihood of being in the PCMH, but not correlated with the outcome measures. Further testing is needed to determine if this would be a strong instrument for this study.
29
model is correctly specified (Basu, et al., 2011). Based on this, propensity score weighting was used as the correction for the selection problem in this analysis.
The first step of propensity score weighting used a logistic regression model with conditioning variables that provided the propensity scores used in step two. The dependent variable was the medical home indicator of whether a person with SMI was in the PCMH or traditional fee-for-service Medicaid. Then, the conditioning variables were used to optimize the propensity score estimates. These
conditioning variables were risk factors associated with the likelihood of being in the PCMH (i.e. the variables affecting the selection bias).
Correct specification of the logistic regression model of the likelihood of being in the PCMH was important to produce unbiased results. A similar set of covariates used in the propensity score model in Domino et al. (under review) was used for the propensity score model in this analysis. Demographic characteristics of age, sex and rural residence were controlled for since older patients and women may have been more likely to enroll in the PCMH. Someone who is older might have had more contact with the health care providers and may have found the additional care management available from the PCMH helpful to navigate the health care system. Similarly, women tend to be higher users health services and may prefer the PCMH model. As higher users of health services, people with additional physical health comorbidities may prefer to have access to better care management services available in the PCMH and were controlled for in the propensity score model. It was hypothesized that selection into the PCMH would also be affected by the severity of the mental illness because less severe cases could prefer the PCMH, while more severe cases would prefer the flexibility of fee-for-service. A proxy
30
standards was due to severe mental illness or a disabling physical condition, but it was thought to suggest an overall more severe, disabling illness state. This would mean that Medicaid beneficiaries with SMI who were categorically eligible as disabled would generally be more severely ill than those Medicaid beneficiaries with SMI who were eligible for Medicaid under a different category.
The likelihood ratio test was used to check correct specification of the propensity score model. The likelihood ratio test is the ratio of likelihood functions from an unrestricted and a restricted model. The null hypothesis stated that the log-likelihood should be approximately equal in both the restricted and unrestricted models. The likelihood ratio test was used to test the functional form of age,
specifically the quadratic of age, in the propensity score model. The likelihood ratio test rejected the null hypothesis that the quadratic of age has no effect on the probability of enrolling in a medical home; therefore, the quadratic form of age was also used in the final propensity score model.
The logistic regression model to determine the propensity scores was:
( ) ( ) ( ) ( ) ( ) Where, =medical home indicator (PCMH vs. fee-for-service)
Comorbidity = count of diagnosed comorbidities
Disability = indicator of Medicaid categorical eligibility as disabled Dual=indicator of dual eligibility for Medicaid and Medicaid
MH Diagnosis=indicator of diagnosis with depression, bipolar disorder, and/or schizophrenia
X=demographic characteristics: age, age2, sex, race, ethnicity, rural residence
31
weights. Both the average treatment effect and the average effect of treatment on the treated were reviewed. The average treatment effect is the average change in the outcomes if the whole population were changed from the control group to the treatment group. The average effect of treatment on the treated is a subgroup of the average treatment effect that only considers the population that received treatment. For policy relevance, the average treatment effect was used since it has the greatest generalizability to the population.
One challenge of using propensity score weighting with generalized estimating equations (GEE) to model the effect of health services utilization and medication adherence outcomes was that GEE does not allow the propensity score weights to vary per person per period. In order to use propensity score weights with the GEE models, it was necessary to use propensity score weights created at the individual level rather than the person-month level. If propensity score weights at the person-month-level did not vary too much over time, it was assumed that the propensity score weights at the individual level could be used. In order to create propensity score weights that change over time the propensity score logistic regression model was run at the person-month level with time covariates in the model. The propensity scores from the person-month level model were then used to create the average treatment effect weight. This weight was then graphed over each person-month for the study period of 2004-2007 (Figure 2.1). The propensity score weights for the SMI sample and each SMI diagnosis at the person month level take on values between 0.83 and 0.89. A visual assessment of Figure 2.1 also showed that the graph of the person-month level weights over time did not significantly vary from month to month. Since there was very little variation in the person-month level weights, it was determined that
32
disorder only, and (4) schizophrenia only. These four weights were created in order to have accurate weights for each model. For example, using a weight created based on the full SMI sample on the model for the bipolar disorder only sample would take into account not only the characteristics of people with bipolar disorder, but also the characteristics of people with the other SMI diagnoses as well. Using the weights created based the full SMI sample for the diagnosis specific models would likely lead to higher standard errors in the final GEE models than would be found when using the diagnosis specific weights (Guo & Fraser, 2010).
The formula for the average treatment effect weights was:
(
( )) (( ))
In the formula, pscore refers to the propensity score from logistic regression model, treatment equals one when an individual is in the PCMH, zero if they are in fee-for-service, and control equals one when an individual is in fee-for-service, zero if they are in the PCMH.
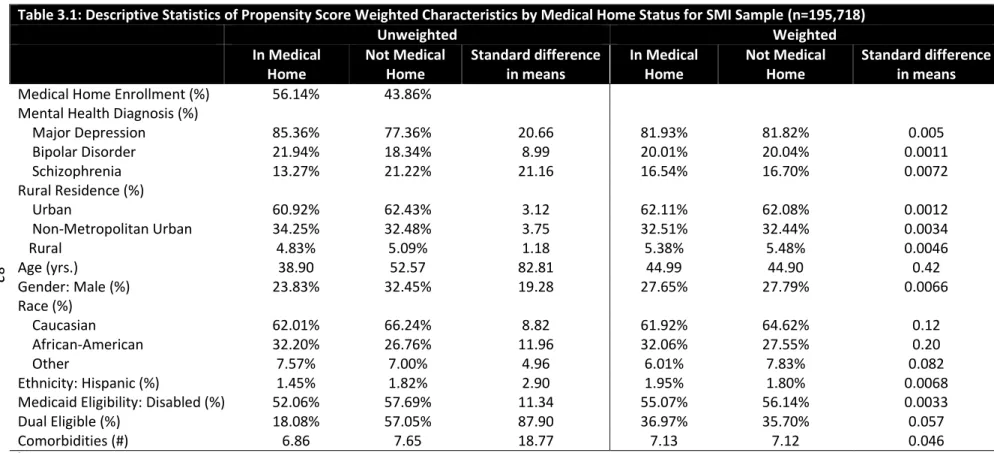
Standardized differences of the means were used to determine balance across the PCMH and non-PCMH groups. The standardized difference compares the absolute difference in the sample means divided by the pooled standard deviation of the variable (Austin, 2008). Standardized differences above 10% in absolute value indicated a serious imbalance and weighting was considered successful when the standardized differences were less than 10% (d’Agostino, 1998). The formulas for the standardized differences of continuous and binary variables were:
Continuous variables: (| ̅ ̅ |
√
33
Binary variables: ( | ̂ ̂ |
√̂ ( ̂ ) ̂ ( ̂ ))
Analytical Model: Generalized Estimating Equations
Generalized estimating equation (GEE) models were used to model the effect of health services utilization and quality of care outcomes rather than traditional multivariable regression models (i.e. logistic regression, linear regression, or count models). The main drawbacks of traditional multivariable regression models for this analysis were that they have difficulty accounting for time-series nature of the data that was used. The main assumptions of generalized linear models are that observations are independent of one another and identically distributed (Hardin & Hilbe, 2007; Liang & Zeger, 1986); however, GEE, a form of generalized linear models, takes into account correlation across observations that makes the observations not independent of one another. This increases the efficiency of the estimating equation and produces consistent estimates of the coefficients and the variance estimates (Liang & Zeger, 1986). The estimates produced from GEE have a population average interpretation. For correct model specification, GEE requires that the family, link function, and correlation structure be chosen prior to running the regression models (Hardin & Hilbe, 2007; Liang & Zeger, 1986).
The family chooses the probability distribution associated with the type of each dependent variable. For the continuous variable (prescription adherence), the gamma distribution was the designated family. For the count variables (visits), the Poisson distribution was the designated family. The negative binomial was evaluated, but was not used because of negative binomial family produced estimates that were unexpected and inconsistent with results found by Domino et al. (under review). Therefore, the Poisson family was used for this analysis which was also used by Domino et al. (under review).
34
correct range of values associated with the type of dependent variable. The log-link was used for all of the dependent variables in the analysis. Given that the continuous variable was skewed to the right, the log-link was appropriate to adjust for this skewness. For the count variables, the log-link was used over the negative binomial link. While the negative binomial link may have been appropriate to address overdispersion in the Poisson distribution, Hardin and Hilbe (2007) discuss that the negative binomial link often has estimation problems and the log-link is a better fit for count variables.
The correlation structure is necessary to account for the correlation across the observations for each individual. Several correlation structures were available to choose from, including exchangeable, auto-regressive, stationary, non-stationary, unstructured, and fixed. The choice of correlation structure for each type of variable was tested for using the quasi-likelihood information criteria (QIC). The correlation structure with the smallest QIC value was used.
35
When comparing the QIC values for the health services utilizations variables, the GEE models with the autoregressive correlation structure produced lower QIC values than the GEE models with the exchangeable correlation structure. The autoregressive correlation structure depends on a correlation between observations from month to month, but a portion of the sample was not enrolled in Medicaid in the previous month. The GEE models with the autoregressive correlation structure treated those observations that were not enrolled in Medicaid in the previous month as missing. For policy relevance, it was determined that it was not realistic to compare the results of people who only continuously enrolled in Medicaid, which occurred with the autoregressive correlation structure. A third correlation structure, the unstructured correlation structure was also evaluated, but not used because the model did not converge and could not produce estimates with this correlation structure. This often occurs when the data is unbalanced (Hardin & Hilbe, 2007). There were gaps in the data because people with SMI were not required to be continuously enrolled in Medicaid throughout the study period. As a result, despite having a higher QIC value, the exchangeable correlation structure was used.
Robust standard errors were used for all of the models. As previously stated, the GEE models were run on the full propensity score weighted SMI sample and by each individual SMI diagnosis. The estimates produced from GEE were the population average effect. The models produced estimates of the monthly effect since the data was at the person-month level. For ease of interpretation, the monthly effect was scaled up to show annual effect. Marginal effects for each of the variables in the model were obtained using the ‘margins’ command in Stata 12. For each variable, the margins command produces the average marginal effect by calculating the marginal effect each observation and then averages all
of the marginal effects. The effect of the rurality X medical home interaction was more complicated
36
determine if there was a significant difference between the estimates of effect of the PCMH on the simulated experience across each geographic area.
The final specification of the Aim 1 model was:
( ) ( ) ( ) ( )
( ) ( )
Where, Y= outcome measures: count of the number of visits (primary care, specialty mental health, inpatient hospitalizations or emergency departments) or medication adherence
Rurality=indicator of urban, non-metropolitan urban or rural residence PCMH= indicator of enrollment in PCMH
Rurality X PCMH=interaction between rurality and PCMH Comorbidity= count of diagnosed comorbidities
MH Diagnosis=indicator of diagnosis with depression, bipolar disorder, and/or schizophrenia X=demographic characteristics: age, sex, race, ethnicity
Aim 2 Methods
To determine whether the performance of PCMHs on health services utilization and quality of care for patients with SMI in rural areas varies with primary care provider experience with SMI.
2. A. Data
The same North Carolina Medicaid paid claims data during 2004-2007 collapsed to the person-month level and the county level 2003 Rural-Urban Continuum codes used in Aim 1 were used in Aim 2.
2.B. Sample
37
with SMI living in non-metropolitan rural counties focused the analysis on 21 of North Carolina’s 100 counties. There was a total of 5,308 people with SMI in the living in a rural area and in the PCMH, with 4,573 diagnosed with major depression, 993 diagnosed with bipolar disorder, and 636 diagnosed with schizophrenia (Table 2.1).
2.C. Variables Dependent Variables
In addition to the mental health and physical health services utilization and medication adherence variables from Aim 1, two additional utilization measures were used for Aim 2.
The any visit variables looked at the likelihood of having a visit to certain health care settings. They were binary indicators of whether an individual had an inpatient hospitalization or had an
emergency department visit during the study period. These outcomes were added to Aim 2 because the average count of inpatient hospitalizations and emergency department visits among the rural PCMH sample was, on average, less than one (Table 4.1). The likelihood of having any visit was expected to determine whether seeing a primary care provider with more experience managing SMI has an impact on visiting these settings at any point during the study period.
Main Explanatory Variable
38
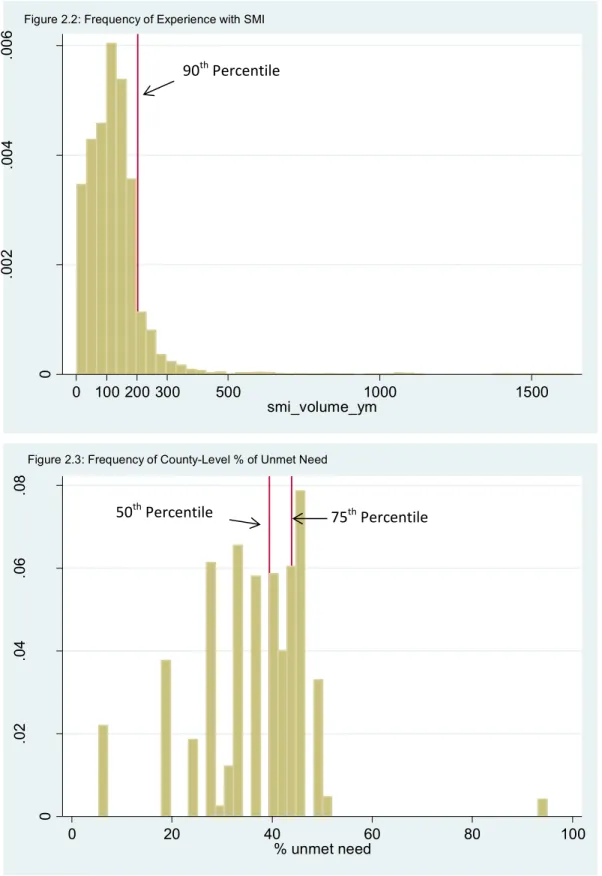
in the month. The underlying continuous variable was operationalized by tallying the number of people with SMI associated with each primary care provider ID in the Medicaid paid claims in the month. The binary variable then used the cut point for high/low was placed at the 90th percentile, primary care provider with 203 patients in the month. The range of the underlying continuous variables was large (1-1,635) and 90% percentile was the point where was a shift in the volume of patients from lower volume to the very high volume (Figure 2.2). Other studies of volume also used a binary indicator to measure volume rather than the underlying continuous variable (Druss, et al., 2004; Halm, et al., 2002). The QIC was used to determine the correct specification of experience with SMI variable to use in the GEE models. The QIC with the lowest value showed that the binary version of experience with SMI, with the cut point at the 90th percentile should be used.
Control Variables
The same control variables from Aim 1 were used for Aim 2. An indicator for whether an individual received care from a federally qualified health center was also used.
2.D. Data Analysis
Analytical Model: Generalized Estimating Equations (GEE)
The same family used in Aim 1 was used for the continuous and count variables. The binary variable (any visit) used the binomial family. The same link function used in Aim 1 was used for the continuous and count variables. The binary variable used the logit-link function. The correlation
39
were run on the full rural PCMH SMI sample and by each individual SMI diagnosis. Robust standard errors were also used for all of the models.
The final specification of the Aim 2 model on the rural PCMH sample was:
( ) ( ) ( ) ( )
( ) ( )
Where, Y= outcome measures: count of the number of visits (primary care, specialty mental health, inpatient hospitalizations or emergency departments), medication adherence, or any visits (inpatient hospitalizations, emergency departments)
Experience=indicator of high vs. low experience Comorbidity = count of diagnosed comorbidities
MH Diagnosis=indicator of diagnosis with depression, bipolar disorder, and/or schizophrenia Dual=indicator of dual eligibility for Medicaid and Medicaid
FQHC=indicator of care received from a federally qualified health center X=demographic characteristics: age, sex, race, ethnicity
Aim 3 Methods
To assess the extent to which the performance of PCMHs on health services utilization and quality of care for patients with SMI in rural areas varies with mental health workforce shortages and experience with SMI.
3. A. Data
40
The mental health workforce shortage data provided county-level shortage scores from all counties in the United States as of 2006. The shortage scores represented unmet need as a proportion of the total need in a county (Thomas, et al., 2009). Unmet need measured as the difference between county need and supply. Supply of mental health providers was the estimate of full-time equivalent providers in a county based on all types of mental health providers, including psychiatrists,
psychologists, advanced practice psychiatric nurses, social workers, licensed professional counselors and marriage and family therapists. Need was the estimate of full-time provider equivalents needed in a county based on actual mental health services utilization among people with SMI and adjusted for need potentially met by primary care providers. Both of the need and supply estimates were also adjusted to account for travel to a provider within a 60-minute radius (Thomas, et al., 2009). The final shortage score is on a scale from 0-100%.
3.B. Sample
The same rural sample from Aim 2 was used for Aim 3.
3.C. Variables Dependent Variables
The same mental health and physical health services utilization and medication adherence variables from Aim 2 were used for Aim 3.
Main Explanatory Variable