Ethanol, TLR3, and TLR4 Agonists Have Unique Innate
Immune Responses in Neuron-Like SH-SY5Y and
Microglia-Like BV2
Colleen J. Lawrimore and Fulton T. Crews
Background: Ethanol (EtOH) consumption leads to an increase of proinflammatory signaling via activation of Toll-like receptors (TLRs) such as TLR3 and TLR4 that leads to kinase activation (ERK1/2, p38, TBK1), transcription factor activation (NFjB, IRF3), and increased transcription of proinflammatory cytokines such as TNF-a, IL-1b, and IL-6. This immune signaling cascade is thought to play a role in neurodegeneration and alcohol use disorders. While microglia are considered to be the primary macrophage in brain, it is unclear what if any role neurons play in EtOH-induced proinflam-matory signaling.
Methods: Microglia-like BV2 and retinoic acid-differentiated neuron-like SH-SY5Y were treated with TLR3 agonist Poly(I:C), TLR4 agonist lipopolysaccharide (LPS), or EtOH for 10 or 30 minutes to examine proinflammatory immune signaling kinase and transcription factor activation using Wes-tern blot, and for 24 hours to examine induction of proinflammatory gene mRNA using RT-PCR.
Results: In BV2, both LPS and Poly(I:C) increased p-ERK1/2, p-p38, and p-NFjB by 30 minutes, whereas EtOH decreased p-ERK1/2 and increased p-IRF3. LPS, Poly(I:C), and EtOH all increased TNF-aand IL-1bmRNA, and EtOH further increased TLR2, 7, 8, and MD-2 mRNA in BV2. In SH-SY5Y, LPS had no effect on kinase or proinflammatory gene expression. However, Poly(I:C) increased p-p38 and p-IRF3, and increased expression of TNF-a, IL-1b, and IL-6, while EtOH increased p-p38, p-IRF3, p-TBK1, and p-NFjB while decreasing p-ERK1/2 and increasing expression of TLR3, 7, 8, and RAGE mRNA. HMGB1, a TLR agonist, was induced by LPS in BV2 and by EtOH in both cell types. EtOH was more potent at inducing proinflammatory gene mRNA in SH-SY5Y compared with BV2.
Conclusions: These results support a novel and unique mechanism of EtOH, TLR3, and TLR4 sig-naling in neuron-like SH-SY5Y and microglia-like BV2 that likely contributes to the complexity of brain neuroimmune signaling.
Key Words:Ethanol, Innate Immune, Microglia, Neuron, Toll-Like Receptor.
E
THANOL (ETOH) CONSUMPTION causes increased proinflammatory signaling in brain that is linked with neurodegeneration (Collins et al., 1996; Crews et al., 2004, 2006; Qin et al., 2008; Reynolds et al., 2015), alcoholism(He and Crews, 2008; Vetreno et al., 2013), fetal alcohol syn-drome disorder (Drew and Kane, 2014), and drinking behav-ior (Agrawal et al., 2011; Blednov et al., 2005, 2012). EtOH treatment in mice increases transcription of proinflammatory cytokines such as TNF-a, IL-1b, and IL-6 in brain (Alfonso-Loeches et al., 2010; Qin and Crews, 2012a; Qin et al., 2008). EtOH is thought to promote this proinflammation in brain through activation of Toll-like receptors (TLRs), a family of 11 receptors (13 in mice) that react to viral and bacterial com-ponents (pathogen-associated molecular patterns [PAMPs]). In particular, TLR4 and TLR3 have been shown to be involved in proinflammatory innate immune signaling by EtOH. EtOH treatment in mice increases both mRNA expression and number of immunoreactive cells for TLR3 and TLR4 in brain, as well as increased TLR3 and TLR4 immunoreactive cells in postmortem human alcoholic brain (Crews et al., 2013). Knockout of TLR4 in mice prevents EtOH-induced increases in proinflammatory cytokines
TNF-a, IL-1b, and IL-6 (Alfonso-Loeches et al., 2010), and knock-out of TLR3 in mice decreases EtOH consumption (Jang et al., 2016). We have previously found that EtOH exposure potentiates both TLR4 agonist-induced (Qin et al., 2008) and
From the Bowles Center for Alcohol Studies (CJL, FTC), School of Medicine, University of North Carolina at Chapel Hill, Chapel Hill, North Carolina; and Curriculum in Neurobiology (CJL), University of North Carolina at Chapel Hill, Chapel Hill, North Carolina.
Received for publication November 21, 2016; accepted February 24, 2017.
Reprint requests: Fulton T. Crews, PhD, John Andrews Distinguished Professor, Bowles Center for Alcohol Studies, The University of North Carolina at Chapel Hill, The School of Medicine, CB #7178, 1021 Thurston-Bowles Building, Chapel Hill, NC 27599-7178; Tel.: 919-966-5678; Fax: 919-966-5679; E-mail: [email protected]
Copyright©2017 The Authors Alcoholism: Clinical and Experimental Research published by Wiley Periodicals, Inc. on behalf of Research Society on Alcoholism.
This is an open access article under the terms of the Creative Commons Attribution-NonCommercial-NoDerivs License, which permits use and distribution in any medium, provided the original work is properly cited, the use is non-commercial and no modifications or adaptations are made.
DOI: 10.1111/acer.13368
Alcohol Clin Exp Res,Vol 41, No 5, 2017: pp 939–954 939
TLR3 agonist-induced (Qin and Crews, 2012a) expression of proinflammatory innate immune signaling molecules (e.g., TNF-a, IL-1b), implying that EtOH activates both TLR3 and TLR4 pathways. However, it is not known to what extent EtOH mimics activation of either TLR3 or TLR4.
Both TLR3 and TLR4 respond to different agonists, yet ultimately both promote proinflammatory signaling through kinase activation. TLR3 is traditionally activated by double-stranded RNA, with polyinosinic:polycytidylic acid [Poly(I: C)] being the most commonly used mimetic, and initiates sig-naling through a Myd88-independent pathway (Narayanan and Park, 2015). The canonical agonist for TLR4 is lipopolysaccharide (LPS), and unlike TLR3, TLR4 uses coadaptor proteins (CD14 and MD-2) as well as signaling through both Myd88-dependent and Myd88-independent pathways (Narayanan and Park, 2015). However, activation of both these receptors leads to activation of downstream sig-naling kinases (e.g., MAPKs like ERK1/2 and p38; TBK1), leading to activation of kinases such as NFjB and IRF3 which result in increased transcription of various proinflam-matory cytokines, such as IL-1b, IL-6 and TNF-a, as well as additional TLR expression (Narayanan and Park, 2015). These cytokines then signal through their respective recep-tors to promote a proinflammatory state (Newton and Dixit, 2012). EtOH has been shown to affect various components of this immune signaling pathway in brain, with EtOH increasing expression of Myd88 and CD14 (Alfonso-Loeches et al., 2010) in whole mouse brain. Further, EtOH increases activation of p38, ERK1/2, NFjB, and IRF3 in cultured primary microglia (Fernandez-Lizarbe et al., 2009).
As the brain is a sterile environment, lacking viral and bac-terial products (PAMPS) that are present in the periphery, discovery of innate immune signaling in brain has led to increased interest in endogenous TLR agonists. Damage-associated molecular patterns (DAMPs), have been shown to be released from cells following stress, inflammation, or cell death, and lead to activation of TLRs (Chen and Nunez, 2010). One such DAMP, HMGB1, functions as an agonist at TLR2, TLR4, and TLR9 (Park et al., 2004; Yang et al., 2013). HMGB1 also binds to receptor for advanced glyca-tion end products (RAGE) (Kokkola et al., 2005), a receptor which leads to increased activation of NFjB (Han et al., 2011). EtOH up-regulates both HMGB1 (Crews et al., 2013; Lippai et al., 2013) and RAGE (Vetreno et al., 2013) in brain, suggesting a role for these molecules in EtOH-induced proinflammatory signaling. While DAMPs are commonly thought to be passively released with cell death, HMGB1 is also released actively by immune-competent cells (Andersson and Tracey, 2011). Interestingly, EtOH-induced release of HMGB1 in hippocampal brain slices occurs without any evidence of cell death, and may occur via a histone deacety-lase-dependent manner (Zou and Crews, 2014).
The aforementioned TLR signaling pathway has been established in macrophages, such as the canonical macro-phage in brain, microglia (Rivest, 2009). Microglia indeed
play an integral role in EtOH-induced innate immune signal-ing (Fernandez-Lizarbe et al., 2009, 2013) and neuronal toxi-city (Boyadjieva and Sarkar, 2010). While another cell type, astrocytes, has been implicated alcohol use disorders and dis-plays proinflammatory innate immune signaling following EtOH treatment (Adermark and Bowers, 2016; Alfonso-Loeches et al., 2010), neurons have largely been overlooked in having a possible role in the innate immune system. How-ever, TLRs have recently been reported to be on neurons as well. In particular, primary mouse cortical neurons were found to express TLR3 and TLR4 using both single cell PCR and immunocytochemistry (Tang et al., 2007), and expression TLR4 on primary mouse cortical neurons using Western blot was also reported (Lok et al., 2015). Previ-ously, we have also shown colocalization of TLR3 and TLR4 on rat neurons using immunohistochemistry (Vetreno and Crews, 2012). Furthermore, there has been evidence that TLR3 agonist Poly(I:C) increases p38 kinase activation and TLR3 expression in neuronal cell line SH-SY5Y (Nessa et al., 2006). In addition, Poly(I:C) increases mRNA expres-sion of TNF-a and IL-6 in neuronal cell line NT2-N (Pre-haud et al., 2005). However, despite evidence for neuronal TLR4, previous reports suggest that TLR4 agonist LPS does not affect TNF-a, IL-6, or IL-1b release in SH-SY5Y (Kle-geris and McGeer, 2001) nor does it increase cytokine release in neuronal cell line NT2-N (Prehaud et al., 2005). In addi-tion, in vivo studies using flow cytometry suggest that TLR4 is predominantly located on microglia (Schwarz et al., 2013), suggesting that neurons lack significant TLR signaling. Despite some conflicting evidence, these data suggest that some level of proinflammatory innate immune activity may exist in neurons, but it is unclear whether neurons demon-strate a macrophage-like signaling pathway activation (e.g., activation of kinases such as MAPKs that lead to NFjB acti-vation). It is also unknown whether EtOH affects innate immune signaling in neurons.
with mRNA expression of various proinflammatory cytoki-nes, TLRs, and TLR-associated proteins, and compared the EtOH findings to both TLR3 and TLR4 stimulation in both microglia-like BV2 and neuron-like SH-SY5Y.
Given the aforementioned data, we hypothesized that (i) neuron-like SH-SY5Y express various components of the innate immune signaling pathway, including TLRs, TLR-associated proteins, and cytokines; (ii) neuron-like SH-SY5Y display activation of kinases and induction of proin-flammatory gene expression in response to TLR3 stimula-tion, but not TLR4; (iii) EtOH causes activation of kinases and up-regulation of proinflammatory gene expression in neuron-like SH-SY5Y in a manner unique to that to micro-glia-like BV2; and (iv) EtOH activates kinases and induces of proinflammatory genes unique to either TLR3 or TLR4 stimulation. Our results indicate that EtOH has a unique and broader pattern of proinflammatory gene induction com-pared with either TLR3/TLR4 stimulation alone in both cell types and that EtOH and Poly(I:C) both activate unique proinflammatory innate immune signaling kinase and gene induction in neuron-like SH-SY5Y.
MATERIALS AND METHODS
Cell Culture and Treatment
BV2 were acquired from ICLC (#ATL03001; Genoa, Italy). BV2 were cultured using Dulbecco’s modified Eagle’s serum (DMEM; Life Technologies, Carlsbad, CA) supplemented with 10% fetal bovine serum (FBS; Life Technologies), 19GlutaMAX (Life Tech-nologies), and 19 antibiotic–antimycotic (Life Technologies). Sixteen hours prior to treatments, media was changed to 2% FBS.
SH-SY5Y were acquired from ATCC (#CRL-2266; Manassas, VA). SH-SY5Y were cultured using DMEM/F-12+ GlutaMAX (Life Technologies), 10% FBS, and 19 antibiotic–antimycotic. Prior to treatments, SH-SY5Y were differentiated using 10lM retinoic acid (RA; #R2625; Sigma-Aldrich, St. Louis, MO) for 4 days in Neurobasal media (Life Technologies) containing 2% B27 supplement (Life Technologies), 0.5 mM GlutaMAX, and 19 antibiotic–antimycotic. Media was refreshed 16 hours prior to treatments.
Both cell types were maintained in a humidified 5% CO2
incuba-tor at 37°C. Passage number at the time of treatment did not exceed 10. Cells were treated at~90% confluency with either 50lg/ml Poly (I:C) (#27-4732-01; Amersham/GE Healthcare, Pittsburgh, PA), 100 ng/ml LPS (#L2630; Sigma-Aldrich), or varying concentrations of EtOH. Concentrations were chosen due to prior literature on Poly(I:C) (Nessa et al., 2006) and LPS (Shin et al., 2014) treatment in these cells. Cells treated with EtOH were placed in a separate EtOH-saturated chamber to prevent evaporation of EtOH from the media. Cell death following treatments was measured using trypan blue exclusion assay.
Western Blot
Cells were washed with ice-cold PBS and lysed on ice for 15 minutes using cold lysis buffer (20 mM Tris, 0.25 M sucrose, 2 mM EDTA, 10 mM EGTA, 1% Triton X-100) and 1 tablet of Complete Ultra protease inhibitor cocktail tablets (Roche, Mannheim, Germany) and PhosSTOP phosphatase inhibitor cocktail tablet (Roche)/10 ml. Samples were centrifuged at 16,0009g for 15 minutes, and protein-containing supernatant was transferred to a separate tube. Total protein concentration
was assessed using a BCA protein assay kit (Pierce, Rockford, IL). Ten micrograms of protein was mixed with 19loading buf-fer (Pierce), boiled for 5 minutes, and ran on Mini-PROTEAN TGX Stain-Free gels (Bio-Rad, Hercules, CA). Following trans-fer to a Trans-Blot Turbo nitrocellulose membrane (Bio-Rad), the blot was blocked with Odyssey Blocking Buffer (Li-Cor, Lin-coln, NE), and incubated with primary antibodies neuron-speci-fic enolase (NSE; #ab53025, 1:500; Abcam, Cambridge, UK), b -tubulin-III (Tubb3; #ab18207, 1:1000; Abcam), Cd11b (#NB110-89474, 1:500; Novus Biologicals, Littleton, CO), HMGB1 (#ab18256, 1:400; Abcam), TLR4 (#sc-293072, 1:500; Santa Cruz, Dallas, TX), RAGE (#ab3611, 1:500; Abcam), phospho (p)-ERK1/2 (#4370, 1:500; Cell Signaling), p-p38 MAPK (#4511, 1:500; Cell Signaling), p-TBK1 (#5483, 1:500; Cell Sig-naling), pIRF3 (#4947, 1:500; Cell SigSig-naling), p-NFjB-p65 (#3033, 1:500; Cell Signaling), and b-actin (#sc-47778, 1:500; Santa Cruz) overnight at 4°C, followed by IRDye 700DX anti-rabbit (#611-730-127; Rockland, Limerick, PA) or IRDye 800DX anti-mouse (#610-731-124; Rockland) secondary antibod-ies for 2 hours at room temperature. Protein bands were visual-ized using an Odyssey fluorescent scanner, with a protein ladder (Odyssey; Li-Cor) used as a size reference.
Flow Cytometry
Cells were detached and stained with violet LD (#L34955; Invitrogen, Carlsbad, CA) as a live–dead discrimination marker. Cells were then stained with Cd11b-PE/Cy7 (1:500; #25-0112-82; eBioscience, San Diego, CA), washed with PBS and then perme-abilized using Fix/Perm buffer (BD Biosciences) and stained with primary antibody Tubb3 (1:1,000, #ab18207; Abcam) followed by secondary antibody D649 (1:800, #406406; Biolegend, San Diego, CA). Isotype controls (rabbit IgG, #171870; Abcam; rat IgG, #25-4031-82; eBioscience) were used to account for back-ground staining. Cells were fixed using 4% paraformaldehyde and analyzed using a CyAN cytometer. FlowJo (Treestar, OR) was used to analyze flow cytometry data.
Real-Time PCR
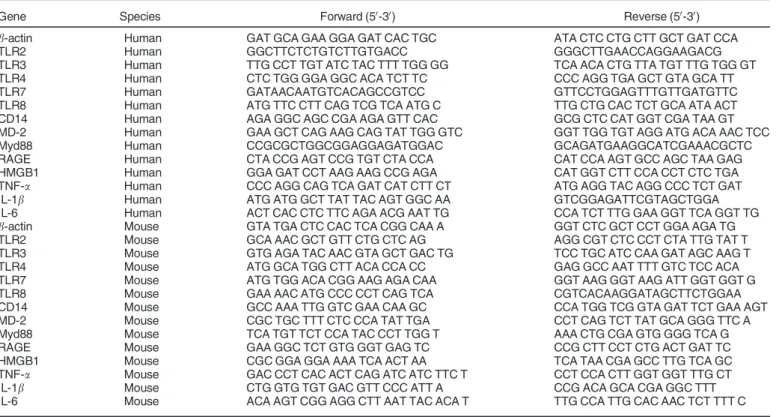
Total RNA was extracted from cell lysates using TRIzol (Invitrogen). RNA concentration was determined using a Nano-Drop (Thermo Scientific, Waltham, MA) and was reverse-tran-scribed to cDNA. The SYBR Green PCR Master Mix (Life Technologies) was used for real-time (RT)-PCR analysis. The relative differences in expression between groups were expressed using cycle time (Ct) values normalized with b-actin, and relative differences between control and treatment groups were calculated and expressed as relative increases setting control as 100%. For genes that were not detectable within 40Ct in control samples, controls were arbitrarily set at 35Ct to calculate a fold change compared with treated samples, as utilized in previous studies (Tuomela et al., 2013). This method allows an estimated fold change while reducing possible bias (McCall et al., 2014). Primers used are listed in Table 1.
Enzyme-Linked Immunosorbent Assays
analyzed using HMGB1 (IBL, Hamburg, Germany) and IFN-b (R&D, Minneapolis, MN) enzyme-linked immunosorbent assays (ELISAs) as per manufacturers’ instructions.
Statistical Analysis
Data are expressed as meanstandard error of the mean (SEM). t-Tests were used to compare basal expression of mRNA and protein between BV2 and SH-SY5Y (Fig. 2). In order to examine the treatment effect in each respective cell type, 1-way ANOVAs were utilized for comparisons between LPS, EtOH, and Poly(I:C) followed by Dunnett’s test to account for multiple comparison (Figs 3–8). Excluding Fig. 2, which directly compares basal levels of immune signaling mole-cules, direct statistical comparisons are not made between cell types. A p-value <0.05 was considered statistically significant. Data were analyzed and figures designed using Prism software (GraphPad, La Jolla, CA).
RESULTS
BV2 Microglia and SH-SY5Y Neurons Display Typical Microglial and Neuronal Markers, Respectively
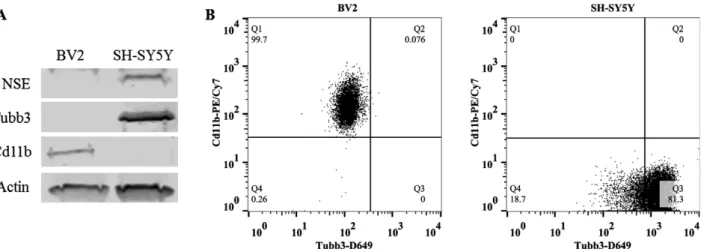
To clearly define the cell type of BV2 and SH-SY5Y, expression of microglial and neuronal protein markers was assessed using Western blot and flow cytometry. RA-differ-entiated SH-SY5Y expressed neuronal markers NSE and Tubb3, but not microglial marker Cd11b (Fig. 1A). Accord-ingly, BV2 expressed microglial marker Cd11b but not neu-ronal markers NSE or Tubb3, whereas SH-SY5Y expressed NSE and Tubb3 but not Cd11b (Fig. 1A). Flow cytometry
analysis confirmed that essentially all BV2 (>99%) express Cd11b, whereas RA-differentiated SH-SY5Y predominantly express neuronal marker Tubb3 (Fig. 1B). These data con-firm that the culture preparations are representative of microglial and neuronal cells.
Microglia-Like BV2 and Neuron-Like SH-SY5Y Have Unique Basal Expression of Innate Immune Signaling Molecules
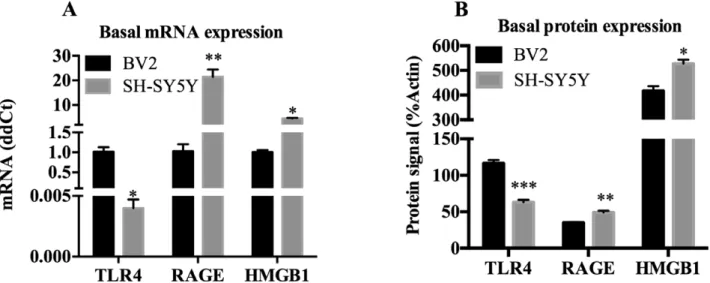
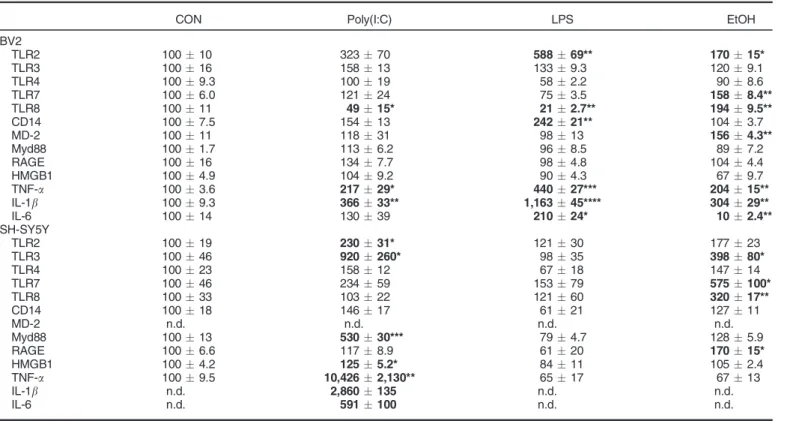
The expression of proinflammatory signaling molecules in BV2 and SH-SY5Y was examined using both RT-PCR and Western blot. As expected, microglia-like BV2 were found to express a wide variety of proinflammatory genes (Table 2). Neuron-like SH-SY5Y also express most proinflammatory genes examined, although in lower relative amounts com-pared with BV2 for most genes assessed. Both BV2 and SH-SY5Y were found to express protein and mRNA for TLR4, RAGE, and HMGB1 (Fig. 2). Consistent with their expected cellular phenotypes, BV2 express more TLR4 pro-tein and mRNA as well as many fold greater levels of mRNA for multiple TLRs, cytokines, and other proinflammatory genes. Neuron-like SH-SY5Y had less than 1% of the BV2 level of TLR4 expression (Fig. 2A). Western blot analysis also found a detectable but relatively lower expression of TLR4 in SY5Y compared with BV2 (Fig. 2B). SH-SY5Y had greater relative expression of TLR3 than the other TLRs; however, this was only 20% of the level in BV2s (Table 2). Further, SH-SY5Y had no detectable levels of Table 1.Primers Used in RT-PCR Analysis
Gene Species Forward (50-30) Reverse (50-30)
b-actin Human GAT GCA GAA GGA GAT CAC TGC ATA CTC CTG CTT GCT GAT CCA
TLR2 Human GGCTTCTCTGTCTTGTGACC GGGCTTGAACCAGGAAGACG
TLR3 Human TTG CCT TGT ATC TAC TTT TGG GG TCA ACA CTG TTA TGT TTG TGG GT
TLR4 Human CTC TGG GGA GGC ACA TCT TC CCC AGG TGA GCT GTA GCA TT
TLR7 Human GATAACAATGTCACAGCCGTCC GTTCCTGGAGTTTGTTGATGTTC
TLR8 Human ATG TTC CTT CAG TCG TCA ATG C TTG CTG CAC TCT GCA ATA ACT
CD14 Human AGA GGC AGC CGA AGA GTT CAC GCG CTC CAT GGT CGA TAA GT
MD-2 Human GAA GCT CAG AAG CAG TAT TGG GTC GGT TGG TGT AGG ATG ACA AAC TCC
Myd88 Human CCGCGCTGGCGGAGGAGATGGAC GCAGATGAAGGCATCGAAACGCTC
RAGE Human CTA CCG AGT CCG TGT CTA CCA CAT CCA AGT GCC AGC TAA GAG
HMGB1 Human GGA GAT CCT AAG AAG CCG AGA CAT GGT CTT CCA CCT CTC TGA
TNF-a Human CCC AGG CAG TCA GAT CAT CTT CT ATG AGG TAC AGG CCC TCT GAT
IL-1b Human ATG ATG GCT TAT TAC AGT GGC AA GTCGGAGATTCGTAGCTGGA
IL-6 Human ACT CAC CTC TTC AGA ACG AAT TG CCA TCT TTG GAA GGT TCA GGT TG
b-actin Mouse GTA TGA CTC CAC TCA CGG CAA A GGT CTC GCT CCT GGA AGA TG
TLR2 Mouse GCA AAC GCT GTT CTG CTC AG AGG CGT CTC CCT CTA TTG TAT T
TLR3 Mouse GTG AGA TAC AAC GTA GCT GAC TG TCC TGC ATC CAA GAT AGC AAG T
TLR4 Mouse ATG GCA TGG CTT ACA CCA CC GAG GCC AAT TTT GTC TCC ACA
TLR7 Mouse ATG TGG ACA CGG AAG AGA CAA GGT AAG GGT AAG ATT GGT GGT G
TLR8 Mouse GAA AAC ATG CCC CCT CAG TCA CGTCACAAGGATAGCTTCTGGAA
CD14 Mouse GCC AAA TTG GTC GAA CAA GC CCA TGG TCG GTA GAT TCT GAA AGT
MD-2 Mouse CGC TGC TTT CTC CCA TAT TGA CCT CAG TCT TAT GCA GGG TTC A
Myd88 Mouse TCA TGT TCT CCA TAC CCT TGG T AAA CTG CGA GTG GGG TCA G
RAGE Mouse GAA GGC TCT GTG GGT GAG TC CCG CTT CCT CTG ACT GAT TC
HMGB1 Mouse CGC GGA GGA AAA TCA ACT AA TCA TAA CGA GCC TTG TCA GC
TNF-a Mouse GAC CCT CAC ACT CAG ATC ATC TTC T CCT CCA CTT GGT GGT TTG CT
IL-1b Mouse CTG GTG TGT GAC GTT CCC ATT A CCG ACA GCA CGA GGC TTT
TLR4 adaptor protein MD-2, or proinflammatory cytokines IL-1band IL-6 (Table 2, using a 40 cycle cutoff). In contrast, SH-SY5Y express more RAGE and HMGB1 compared with BV2. Interestingly, Myd88, a critical adapter signaling trans-ducer for TLRs and cytokine receptor signaling, has similar levels in SH-SY5Y and BV2. These data indicate that SH-SY5Y and BV2 both express TLR and other proinflam-matory genes, although at different basal levels.
LPS, Poly(I:C), and EtOH Differentially Activate Kinases/ Transcription Factors that Modulate TLR Pathways in Microglia-Like BV2
Activation of TLR3 and TLR4 involves key kinases the lead to activation of NFjB and other transcription factors that mediate induction of proinflammatory genes. To
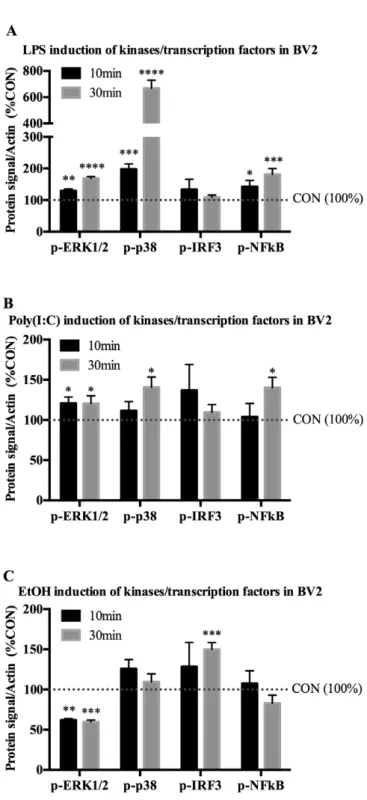
better understand the role of EtOH in relation to TLR4 and TLR3 activation, we treated microglia-like BV2 TLR4 agonist LPS, TLR3 agonist Poly(I:C), or EtOH for 10 or 30 minutes. Activated kinases/transcription factors were measured by examining phosphorylated forms of these proteins in cell lysates using Western blot. As expected, both LPS and Poly(I:C) activated kinases related to TLR signaling. Following 10 minutes of LPS treatment, phospho(p)-ERK1/2 was increased by 29% (5.9%, p < 0.01) and p-p38 by 98% (17%, p < 0.001). p-NFjB, a transcription factor downstream of TLR acti-vation that is involved in transcription of a variety of proinflammatory molecules, was increased by 42% (20, p < 0.05) (Fig. 3A). After 30 minutes, LPS caused an even more robust effect, by increasing p-ERK1/2 by 68% (5.6%, p <0.0001), p-p38 by 568% (61%,p <0.0001), and p-NFjB by 80% (18%, p <0.001) relative to con-trols (Fig. 3A). Thus, LPS stimulation displayed a canoni-cal activation of kinases in BV2.
Treatment of BV2 with Poly(I:C) had a slightly less robust effect compared with LPS, with only p-ERK1/2 increased by 21% (7.8%, p < 0.05) by 10 minutes of treatment. How-ever, by 30 minutes Poly(I:C) increased p-ERK1/2 by 21% (9.4, p < 0.05), p-p38 by 41% (13, p <0.05), and p-NFjB by 40% (13%, p < 0.05) (Fig. 3B), indicating activation of kinases by Poly(I:C) signaling in BV2.
Unlike either Poly(I:C) or LPS, EtOH treatment at 10 and 30 minutes significantly decreased p-ERK1/2 by 38% (1.6%, p < 0.01) and 40% (2.5%, p< 0.001), respec-tively, whereas p-IRF3 was increased by 50% (8.7%, p < 0.001) after 30 minutes (Fig. 3C). Thus, LPS, Poly(I:C), and EtOH activate proinflammatory signaling kinases/tran-scription factors in BV2. However, EtOH displays a unique pattern of activation compared with either TLR3 or TLR4 signaling pathways.
Table 2. Summary Basal mRNA Expression of Proinflammatory Genes in Microglia-Like BV2 and Neuron-Like SH-SY5Y
ddCt
BV2 SH-SY5Y
RAGE 1.03 21.4600
HMGB1 1.00 4.6000
Myd88 1.00 0.9500
TLR3 1.03 0.1800
TLR8 1.01 0.1600
CD14 1.01 0.0360
TLR2 1.01 0.0290
TLR7 1.01 0.0035
TLR4 1.01 0.0031
TNF-a 1.00 0.0017
MD-2 1.01 n.d.
IL-1b 1.06 n.d.
IL-6 1.02 n.d.
Average basal mRNA levels of various immune signaling molecules in BV2 and SH-SY5Y (n=3 per group) were analyzed using RT-PCR and expressed as ddCt, setting BV2 as 1.
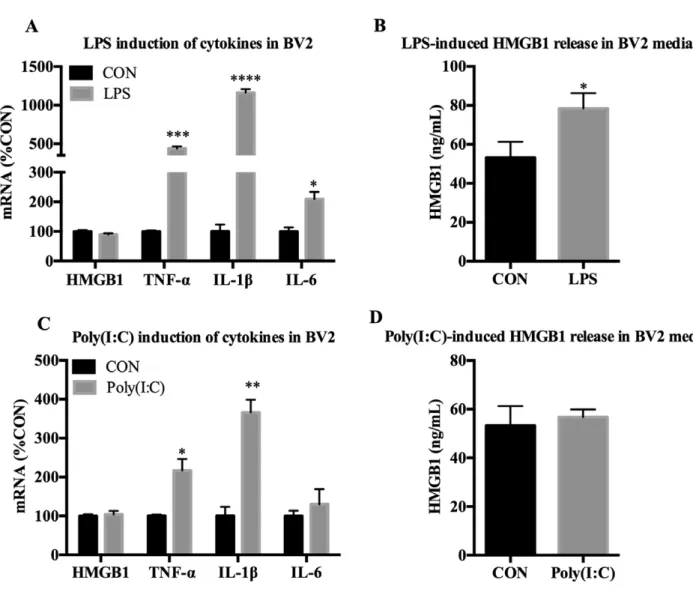
LPS, Poly(I:C), and EtOH Increase Proinflammatory Gene Expression in Microglia-Like BV2
Studies of canonical macrophage TLR signaling find that activation of transcription factors such as NFjB and IRF3 leads to further proinflammatory signaling (Narayanan and Park, 2015). Thus, we next assessed subsequent induction of proinflammatory genes following 24-hour treatment of TLR3 agonist Poly(I:C), TLR4 agonist LPS, or EtOH in BV2. Cell death was assayed using trypan blue exclusion and no significant effects were found in any treatment (data not shown). LPS induced a typical microglia-like response in BV2, with significant increases in mRNA expression of TNF-a (81428%, p <0.001), IL-1b (2,775 370%, p < 0.0001), IL-6 (20924%, p <0.05) (Fig. 4A), and TLR4 coreceptor CD14 (24221%, p < 0.01) (Table 3). LPS treatment also increased HMGB1 in media of BV2 by 37% (8.5%,p < 0.01) relative to controls (Fig. 4B). TLR3 agonist Poly(I:C) treatment increased mRNA expression of TNF-a (21729%, p <0.05) and IL-1b (36633%, p < 0.01) (Fig. 4C), whereas Poly(I:C) had no significant effect on HMGB1 release in media (Fig. 4D). Additionally, TLR8 was down-regulated by both Poly(I:C) (4915%, p < 0.05) and LPS (212.7%,p < 0.01), whereas LPS up-regulated TLR2 (58869%, p <0.01) and CD14 (24221%,p <0.01) as depicted in Table 3. Raw Ct val-ues are depicted in Supplementary Table S1. These data are consistent with BV2 displaying a characteristic macrophage-like proinflammatory signaling induction following TLR4 and TLR3 agonist treatment.
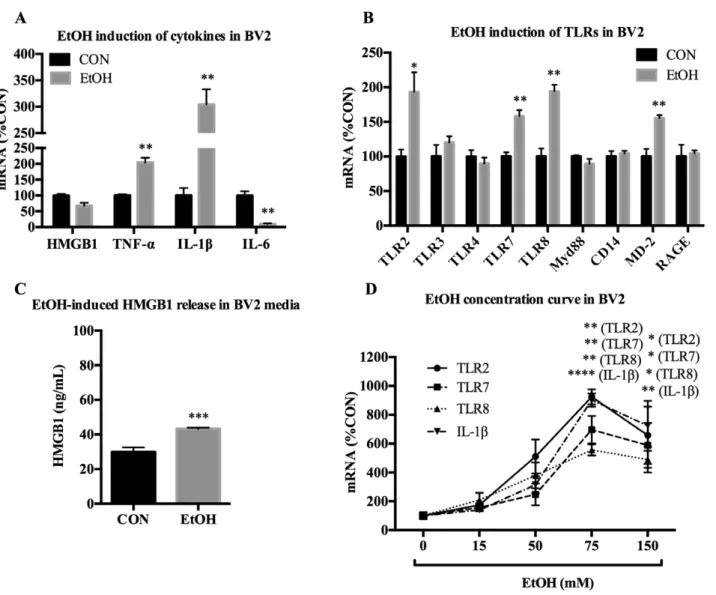
BV2 were next treated with EtOH for 24 hours to deter-mine whether EtOH causes induction of proinflammatory genes in microglia-like cells. EtOH increased transcription of both cytokines and TLRs. Significant increases were found
for TNF-a (20415%, p <0.01), IL-1b (30429%, p< 0.01), TLR2 (193 28%, p < 0.01), TLR7 (1588.4%,p < 0.01), TLR8 (1949.6%,p <0.01), and the TLR4 accessory protein MD-2 (1554.4%,p < 0.01) mRNA (Fig. 5A,B), as well as HMGB1 release in media (Fig. 5C). A concentration curve indicated that EtOH induces transcription of proinflammatory genes at a concen-tration of over 50 mM (Fig. 5D). These data indicate that EtOH treatment of microglia-like BV2 activates proinflam-matory gene induction.
Poly(I:C) and EtOH, But Not LPS, Activate TLR Signaling Kinases/Transcription Factors Pathway in Neuron-Like SH-SY5Y
To determine whether TLR3 or TLR4 pathways are acti-vated in neuron-like SH-SY5Y, the cells were treated for 10 or 30 minutes with either TLR4 agonist LPS, TLR3 agonist Poly(I:C), or EtOH followed by Western blot analysis of phosphorylated (activated) kinases. While LPS had no mea-surable effect on SH-SY5Y at either time point (Fig. 6A), Poly(I:C) increased p-p38 by 88% (24, p< 0.01) and p-IRF3 by 38% (6.6%,p <0.05) at 30 minutes (Fig. 6B). A 10-minute treatment of EtOH decreased p-ERK1/2 by 55% (4.7%, p < 0.001), and increased p-p38 by 49% (17%, p< 0.05), p-IRF3 by 41% (19%, p < 0.05), p-TBK1 by 74% (17%, p< 0.001), and p-NFjB by 56% (17%, p <0.01) (Fig. 6C). By 30 minutes of treatment, EtOH decreased p-ERK1/2 by 49% (6.7, p< 0.01), and caused a broad range of effects, increasing p-p38 by 222% (24,p< 0.0001), p-IRF3 by 125% (14%,p <0.0001), p-TBK1 by 94% (11%,p < 0.0001), and p-NFjB by 72% (13%,p < 0.001) (Fig. 6C). These data indicate that Poly (I:C) but not LPS activates kinases in SH-SY5Y. Fig. 2. Microglia-like BV2 and neuron-like SH-SY5Y express mRNA and protein of various proinflammatory molecules. (A) Comparison of basal mRNA expression of TLR4, RAGE, and HMGB1 in BV2 and SH-SY5Y. Data are expressed in ddCt normalized to BV2 expression level. SH-SY5Y express less TLR4 but greater RAGE and HMGB1 mRNA. (B) Basal protein levels of TLR4, RAGE, and HMGB1 were examined using Western blot in BV2 and SH-SY5Y. Data are expressed in %b-actin units. SH-SY5Y express less TLR4 but greater RAGE and HMGB1 protein.n=3 per group;
Importantly, EtOH induces a broad range of activation of proinflammatory signaling kinases/transcription factors in SH-SY5Y, with several effects unique to EtOH.
Poly(I:C) and EtOH, But Not LPS, Increase
Proinflammatory Gene Expression in Neuron-Like SH-SY5Y
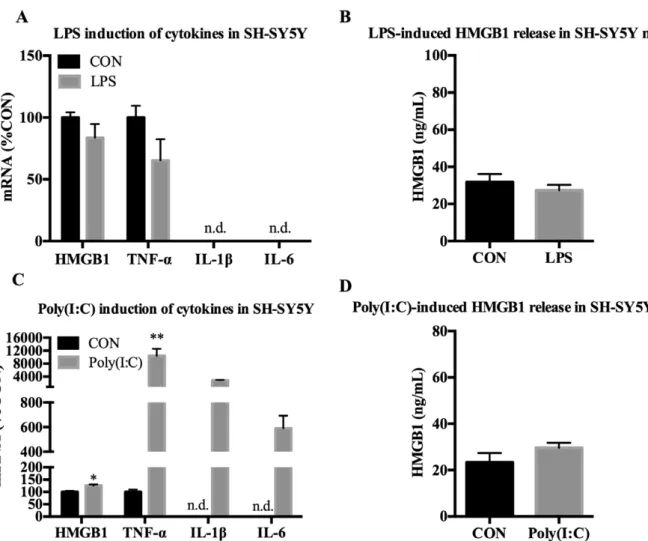
Subsequent proinflammatory gene expression was then examined in neuron-like SH-SY5Y. Cell death was assayed using trypan blue exclusion, and no significant effects were found in any treatment (data not shown). In accordance with the lack of kinase activation, SH-SY5Y did not have any detectable changes in proinflammatory cytokine expression or HMGB1 release in response to LPS (Fig. 7A,B). How-ever, Poly(I:C) increased mRNA expression of TNF-a (10,4262,132%, p < 0.01) and HMGB1 (1255.2%, p < 0.05), and further increased levels of IL-1b and IL-6 from nondetectable (>40 Ct) to detectable ranges, with esti-mated fold changes of 2,860 (135%) and 591 (100%), respectively (Fig. 7C). Poly(I:C) also increased expression of its own receptor, TLR3 (920260%, p< 0.05) as well as TLR2 (230 31%, p < 0.05) and TLR adaptor protein Myd88 (530 30%,p < 0.001), as shown in Table 3. Poly (I:C) had no effect on HMGB1 release (Fig. 7D), and no change in IFN-b protein in cell lysates was observed (data not shown). Raw Ct values are depicted in Table S1. These data indicate that neuron-like SH-SY5Y appear to lack a detectable LPS response. However, SH-SY5Y are highly responsive to TLR3 stimulation. Poly(I:C) induced strong up-regulation of cytokines in SH-SY5Y, as well as TLR receptors and HMGB1.
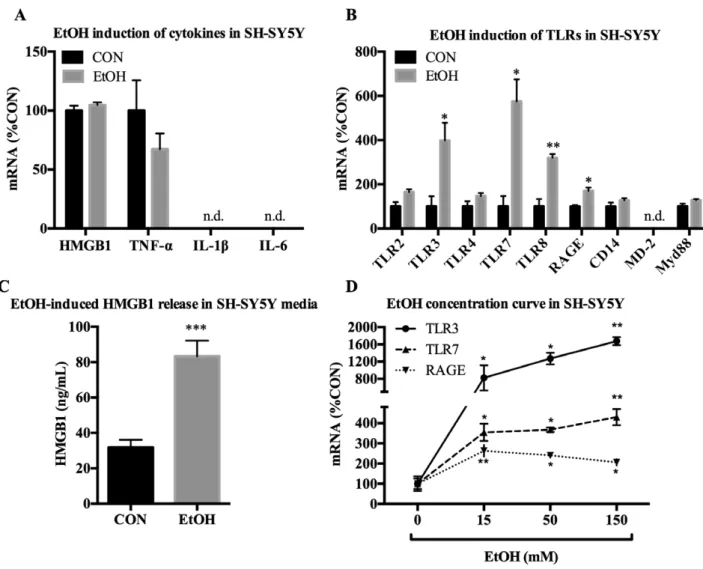
SH-SY5Y were next treated with EtOH to examine whether EtOH causes induction of proinflammatory genes in neuron-like cells. While no significant changes were seen in mRNA of the cytokines we assessed (Fig. 8A), EtOH did increase TLR3 (398 80%,p < 0.05), TLR7 (574100%, p < 0.05), TLR8 (31917%, p< 0.01), and RAGE (170 15%, p < 0.05) (Fig. 8B). EtOH also caused HMGB1 release in media (Fig. 8C). Concentrations as low as 15 mM EtOH caused increases in TLR3, TLR7, and RAGE mRNA (Fig. 8D). In summary, EtOH causes induc-tion of TLR3, TLR7, TLR8, and RAGE in SH-SY5Y even at low concentrations, and in a unique manner, different from either TLR3 or TLR4 stimulation alone.
DISCUSSION
This study compares TLR4, TLR3, and EtOH-induced kinase activation and proinflammatory gene induction in BV2 microglia-like cells and differentiated SH-SY5Y neu-ron-like cells (Fig. 9). As expected, BV2 express greater levels of most proinflammatory signaling molecules compared with SH-SY5Y. BV2 responded to all treatments as indicated by activation of proinflammatory signaling kinases and induc-tion of proinflammatory signaling gene mRNA (Fig. 9A–C, Fig. 3. LPS, Poly(I:C), and EtOH activate proinflammatory-related
kinases/transcription factors in microglia-like BV2. Microglia-like BV2 were treated with indicated drug for 10 or 30 minutes. Cell lysates were collected for Western blot analysis. (A) Ten minutes of LPS (100 ng/ml) increased p-ERK1/2 by 29%, p-p38 by 98%, and p-NFj B-p65 by 42%. Thirty minutes of LPS increased ERK1/2 by 68%, p-p38 by 568%, and p-NFjB by 80%. (B) Ten minutes of Poly(I:C) (50lg/ml) increased p-ERK1/2 by 21%. Thirty minutes of Poly(I:C) increased p-ERK1/2 by 21%, p-p38 by 41%, and p-NFjB by 40%. (C)
Ten minutes of EtOH (150 mM) decreased p-ERK1/2 by 38%.
Thirty minutes of EtOH decreased ERK1/2 by 40% and increased p-IRF3 by 50%. Data are represented as %control (%CON) followingb -actin normalization. n=3 per group; *p<0.05, **p<0.01,
red labels). Although all 3 treatments induced a BV2 response, TLR3 and TLR4 activation increased canonical kinases, for example, p-ERK1/2, p-p38, and p-NFjB, whereas EtOH uniquely increased p-IRF3 in BV2, a different canonical proinflammatory signaling pathway not changed by LPS or Poly(I:C) treatment. Further, EtOH decreased p-ERK1/2 in BV2, whereas both LPS and Poly(I:C) increased p-ERK1/2, further distinguishing the signaling of EtOH from TLR3 and TLR4. Proinflammatory cytokines TNF-aand IL-1bwere increased by all 3 treatments in BV2, but EtOH further increased TLR2, TLR7, TLR8, and MD-2 (Fig. 9A–C, red labels). In neuron-like SH-SY5Y, we found TLR4 protein and mRNA, but no detectable LPS responses (Fig. 9A). However, Poly(I:C) and EtOH both increased p-p38 and p-IRF3, with EtOH also increasing p-NFjB and decreasing p-ERK1/2 in SH-SY5Y (Fig. 9B,C, blue labels). Interestingly, Poly(I:C) increased proinflammatory cytokine mRNA, for example, TNF-a, IL-1b, and IL-6 in SH-SY5Y,
some from nondetectable levels, without increasing p-NFjB, the key proinflammatory transcription factor in monocytes, whereas EtOH increased p-NFjB, but did not induce TNF-a, IL-1b, or IL-6 in SH-SY5Y. Both Poly(I:C) and EtOH increased multiple TLR mRNA in SH-SY5Y, but only EtOH increased RAGE expression, which uniquely had greater basal expression in SH-SY5Y than in BV2. HMGB1, a TLR and RAGE agonist, was induced and released by LPS in BV2, but not in SH-SY5Y, whereas EtOH released HMGB1 from both cell types (Fig. 9A,C). EtOH induced TLR mRNA at lower concentrations in SH-SY5Y (15 mM, Fig. 8D) compared with BV2 (75 mM, Fig. 5D). This sug-gests greater neuronal sensitivity to EtOH induction of TLR mRNA and unique cellular differences in EtOH induction of TLR and other proinflammatory genes that contribute to the complexity in brain.
2016; Mayfield et al., 2013; Montesinos et al., 2016) and drinking behavior (Agrawal et al., 2011; Blednov et al., 2005, 2012). Microglia and astrocytes have been found to play critical roles in the proinflammatory responses to EtOH, particularly through TLR4 activation (Alfonso-Loeches et al., 2010; Blanco et al., 2005; Fernandez-Lizarbe et al., 2009, 2013). However, neuronal proinflammatory signaling in response to EtOH has not previously been described. This study utilized microglial and neuronal cell lines to determine commonalities and differences in proinflammatory signaling to EtOH. As expected, microglia-like BV2 have canonical activation to EtOH. EtOH treatment increased activation of IRF3 and increased transcription of NFjB-dependent genes (e.g.,TNF-a, IL-1b, TLR2) consistent with previous reports (Alfonso-Loeches et al., 2010; Crews et al., 2013; Fernandez-Lizarbe et al., 2013). However, we now report that EtOH causes proinflammatory signaling in neuronal cells that is distinct from microglia. In neuron-like SH-SY5Y, EtOH activated a broader range of transcription fac-tors and proinflammatory modulating kinases (NFjB, p38, TBK1) than in microglia-like BV2. EtOH also increased transcription of immune receptors RAGE, TLR3, TLR7, and TLR8 in neuron-like SH-SY5Y. Although
microglia-like BV2 basally express more TLRs and proinflammatory genes than neuron-like SH-SY5Y, SH-SY5Y had a lower concentration threshold of response to EtOH compared with BV2 (15 mM vs. 75 mM), indicating a higher sensitivity of neurons to EtOH-induced induction of proinflammatory sig-naling. We further found that EtOH has a unique pattern of activation of kinases/proinflammatory genes compared with either TLR3 or TLR4 stimulation alone, again pointing toward a broader effect of EtOH on immune signaling. Our data support a role for EtOH-induced proinflammatory innate immune signaling in neurons unique from that of microglia as well as TLR3 or TLR4 activation alone.
Previously, we found that EtOH treatment of mice for 10 days (5 g/kg/d) induces brain TLR3 and TLR4 expres-sion, as well as increased induction of proinflammatory cytokines following systemic treatment with LPS (Qin et al., 2008) and Poly(I:C) (Qin and Crews, 2012a), implying that EtOH sensitizes TLR responses through up-regulation of these pathways to instigate proinflammatory signaling. Our findings here expand upon these data by sug-gesting that EtOH has a broad range of proinflammatory activation rather than through TLR3 or TLR4 alone. In BV2, EtOH had a less robust effect on kinases/transcription Table 3.Summary of Poly(I:C), LPS, and EtOH Induction of Proinflammatory Gene mRNA in BV2 and SH-SY5Y
CON Poly(I:C) LPS EtOH
BV2
TLR2 10010 32370 58869** 17015*
TLR3 10016 15813 1339.3 1209.1
TLR4 1009.3 10019 582.2 908.6
TLR7 1006.0 12124 753.5 1588.4**
TLR8 10011 4915* 212.7** 1949.5**
CD14 1007.5 15413 24221** 1043.7
MD-2 10011 11831 9813 1564.3**
Myd88 1001.7 1136.2 968.5 897.2
RAGE 10016 1347.7 984.8 1044.4
HMGB1 1004.9 1049.2 904.3 679.7
TNF-a 1003.6 21729* 44027*** 20415**
IL-1b 1009.3 36633** 1,16345**** 30429**
IL-6 10014 13039 21024* 102.4**
SH-SY5Y
TLR2 10019 23031* 12130 17723
TLR3 10046 920260* 9835 39880*
TLR4 10023 15812 6718 14714
TLR7 10046 23459 15379 575100*
TLR8 10033 10322 12160 32017**
CD14 10018 14617 6121 12711
MD-2 n.d. n.d. n.d. n.d.
Myd88 10013 53030*** 794.7 1285.9
RAGE 1006.6 1178.9 6120 17015*
HMGB1 1004.2 1255.2* 8411 1052.4
TNF-a 1009.5 10,4262,130** 6517 6713
IL-1b n.d. 2,860135 n.d. n.d.
IL-6 n.d. 591100 n.d. n.d.
Microglia-like BV2 and neuron-like SH-SY5Y were treated with TLR3 agonist Poly(I:C) (50lg/ml), TLR4 agonist LPS (100 ng/ml), or EtOH (150 mM) for 24 hours. Cell lysates were collected and analyzed for mRNA expression using RT-PCR. Data for mRNA are expressed as %control (%CON), with CON set at 100%. Data for HMGB1, TNF-a, IL-1b, and IL-6 for LPS and Poly(I:C) treatment in BV2 are also represented in Fig. 4A,C. Data for HMGB1, TNF-a, IL-1b, IL-6, TLR2, 3, 4, 7, 8, Myd88, Cd14, MD-2, and RAGE for EtOH treatment in BV2 are also represented in Fig. 5A,B. Data for HMGB1, TNF-a, IL-1b, and IL-6 for LPS and Poly(I:C) treatment in SH-SY5Y are also represented in Fig. 7A,C. Data for HMGB1, TNF-a, IL-1b, IL-6, TLR2, 3, 4, 7, 8, Myd88, Cd14, MD-2, and RAGE for EtOH treatment in SH-SY5Y are also represented in Fig. 8A,B. n.d.=not detectable;n=3 per group.
factors compared to treatment with TLR3 agonist Poly(I: C) or TLR4 agonist LPS. In SH-SY5Y, however EtOH actually had a broader range of effects, with EtOH activat-ing several kinases/transcription factors (TBK1 and NFjB) that were not activated by Poly(I:C). We also found that ERK1/2 was decreased by EtOH in both cell types, whereas p38 was increased in EtOH-treated SH-SY5Y. A similar study showed that EtOH (100 mM, 10 minutes) inhibited p-ERK1/2 in cultured human cortical neurons (Kalluri and Ticku, 2003), and p-ERK1/2 is decreased in cortex in brains of adolescent-intermittent EtOH-treated rats (Liu and Crews, 2015). Poly(I:C) increased activation of IRF3, a transcription factor that controls interferon production (Hiscott, 2007), in SH-SY5Y, and EtOH increased IRF3 in both BV2 and SH-SY5Y. Consistent with our studies, EtOH (50 mM, 1 hour) increases activated IRF3 in
cultured primary mouse microglia (Fernandez-Lizarbe et al., 2009). However, we observed no Poly(I:C) or EtOH-induced changes in IFN-bin SH-SY5Y cell lysates, suggest-ing that either different IFNs are besuggest-ing targeted or that a noncanonical role for IRF3 exists in neurons. It is impor-tant to note that while we observed that 30 minutes of EtOH increased p-NFjB and p-p38 in SH-SY5Y, no change was seen in BV2 at this time point, although other studies in our laboratory find an increase in p-NFjB at 6 hours in BV2 (data not shown). This may suggest greater importance of other transcription factors (e.g., IRF3) early after EtOH exposure in BV2. Given these results, we sur-mise that EtOH causes a unique activation of kinases/tran-scription factors in SH-SY5Y and BV2, with a broader range of activation in neuron-like SH-SY5Y. While it is not clear why these neuron-like and microglia-like cells show Fig. 5. EtOH up-regulates proinflammatory genes in microglia-like BV2. BV2 were treated with EtOH (150 mM) for 24 hours and analyzed for mRNA expression of cytokines, TLRs and TLR-associated signals, and HMGB1 release in media. (A) EtOH increased TNF-a(204%) and IL-1b(304%), and decreased IL-6 (10%) mRNA. (B) EtOH increased TLR2 (193%), TLR7 (158%), TLR8 (194%), and MD-2 (155%) mRNA. (C) EtOH increased HMGB1 release in media by 44%. (D) Concentration curve of 24hr of EtOH treatment on mRNA expression in BV2. EtOH increased TLR2, TLR7, TLR8, and IL-1bat 75 and 150 mM. Data for mRNA are expressed as %control (%CON), with CON set at 100%. n=3 per group; *p<0.05, **p<0.01,
different responses to EtOH, it may be related to differen-tial kinase activation in neurons versus microglia. Immune induction by EtOH is complex and includes TLR clustering in lipid rafts, release of endogenous TLR agonists, and
oxidative stress activation of NFjB (Fernandez-Lizarbe et al., 2013; Qin and Crews, 2012b; Zou and Crews, 2014). Although complex, our findings suggest EtOH uniquely activates proinflammatory signaling pathways in both microglia-like BV2 and neuron-like SH-SY5Y.
Microglia-like BV2 and neuron-like SH-SY5Y demon-strated unique responses to TLR3 and TLR4 agonists. Microglial responses were canonical with both TLR3 ago-nist Poly(I:C) and TLR4 agoago-nist LPS increasing activated p-NFjB, p-p38, and p-ERK1/2, consistent with findings in primary microglia cultures (Town et al., 2006). However, neuron-like SH-SY5Y displayed a response only to TLR3 stimulation. TLR3 agonist Poly(I:C) activated p38 and IRF3 in SY5Y, consistent with previous studies in SH-SY5Y (Nessa et al., 2006). We also found that Poly(I:C) also greatly up-regulated TNF-a, IL-1b, and IL-6 mRNA in SH-SY5Y, whereas LPS had no effect, consistent with previous studies (Klegeris and McGeer, 2001; Prehaud et al., 2005). Importantly, Poly(I:C) can bind other recep-tors (RIG-I, MDA5) in some cells, but studies in human neuronal cells indicate that extracellular Poly(I:C) specifi-cally utilizes TLR3 (Peltier et al., 2010). Although we detected TLR4 mRNA and protein, we were unable to detect MD-2 expression in SH-SY5Y. MD-2 is a critical accessory protein that is necessary for both LPS- and HMGB1-induced TLR4 signaling (Nagai et al., 2002; Yang et al., 2015). This absence of MD-2 might explain the lack of detectable TLR4 response in SH-SY5Y. Thus, our findings indicate LPS and Poly(I:C) activate canonical immune signaling kinases and induce immune signaling mRNA in microglia-like BV2, but only Poly(I:C) and not LPS activates proinflammatory signaling in neuron-like SH-SY5Y.
EtOH did not increase TLR4 expression in either cell type at the concentration and time point (24 hours) utilized in this study, although our previous in vivo study found TLR4 mRNA up-regulated in mouse brain following 10 daily binges of 5 g/kg EtOH (Crews et al., 2013). Primary rodent microglia, however, have maximally up-regulated TLR4 protein at 30 minutes that decreases to nonsignificantly ele-vated levels by 24 hours (Fernandez-Lizarbe et al., 2013), indicating a time point specificity of EtOH-induced TLR4 expression in cultured microglia. Despite the lack of TLR4 induction, we found that TLR3 mRNA was increased by EtOH and Poly(I:C) in SH-SY5Y, suggesting possible EtOH activation of TLR3 signaling in neurons. Fewer studies have examined possible EtOH proinflammatory signaling through TLR3, although a recent study showed that TLR3 KO mice consume more EtOH (Jang et al., 2016). More research is needed to elucidate the possible neuronal role of TLR3 in EtOH-induced innate immune signaling. Furthermore, the up-regulation of both TLR7 and TLR8 by EtOH in both BV2 and SH-SY5Y indicates a commonalty shared between the 2 cell types, indicating more research is needed to understand the complexity of EtOH proinflammatory signaling.
Fig. 6. Poly(I:C) and EtOH, but not LPS, activate proinflammatory-related kinases/transcription factors in neuron-like SH-SY5Y. SH-SY5Y were treated with indicated drug for 10 or 30 minutes. Cell lysates were collected for Western blot analysis. (A) LPS (100 ng/ml) had no detectable effect on any of the kinases/transcription factors examined. (B) Poly(I:C) (50lg/ml) increased p-p38 by 88% and p-IRF3 by 38% by 30 minutes. (C) Ten minutes of EtOH (150 mM) decreased ERK1/2 by 55%, and increased p38 by 49%, IRF3 by 41%,
p-TBK1 by 74%, and p-NFjB by 56%. Thirty minutes of EtOH
decreased p-ERK1/2 by 49%, and increased p-p38 by 222%, p-IRF3
by 125%, p-TBK1 by 94%, and p-NFjB by 73%. Data are
repre-sented as %CON following b-actin normalization. n=3 per group;
We also found that EtOH increased HMGB1 release in both BV2 and SH-SY5Y, consistent with EtOH-induced HMGB1 in hippocampal brain slices, brains of binge EtOH-treated mice, and postmortem human alcoholic brain (Crews et al., 2013). Similar to our data, HMGB1 is also released from EtOH-treated (50 mM, 24 hours) nondifferentiated neuroblastoma SH-SY5Y (Wang et al., 2015). As HMGB1 activates multiple TLRs (Park et al., 2004; Yang et al., 2013), RAGE (Kokkola et al., 2005), and can enhance sig-naling of cytokines such as IL-1b (Sha et al., 2008), the EtOH-induced HMGB1 release we observe may play a role in proinflammatory signaling in both microglia and neurons. We also found that RAGE, a receptor that binds HMGB1 and enhances NFjB signaling (Han et al., 2011), was up-regulated in EtOH-treated SH-SY5Y but not in BV2, consistent with an increase in neuronal RAGE in adolescent-intermittent EtOH-treated rats (Vetreno et al., 2013). Over-all, we report here that EtOH up-regulates proinflammatory genes and releases HMGB1 in both cell types, as well as
specific TLR3 and RAGE mRNA up-regulation in neuron-like SH-SY5Y but not in microglia-neuron-like BV2.
environment may alter results, making it worthwhile for our future studies to examine both interaction between these cell types as well using in vivo studies.
Although not utilized in this study, astrocytes are also involved in alcohol use disorders and display proinflam-matory immune signaling following EtOH treatment (Adermark and Bowers, 2016; Alfonso-Loeches et al., 2010). Astrocytes would then make an interesting future point of comparison of innate immune signaling versus the canonical macrophage signaling in microglia.
In summary, this study supports that neurons may con-tribute to proinflammatory signaling, and suggests a novel role of neurons in EtOH-induced innate immune signal-ing. Microglia-like BV2 displayed activated kinases fol-lowing LPS, Poly(I:C), and EtOH treatment, as well as induction of cytokines like TNF-a and IL-1b. Although neuron-like SH-SY5Y had no detectable response to LPS, Poly(I:C) and EtOH increased activated kinases and
proinflammatory genes. EtOH displayed a different pat-tern of activated kinases/transcription factors compared with Poly(I:C) or LPS treatment in either cell type. EtOH also increased release of HMGB1 in both cell types and increased expression of RAGE in SH-SY5Y, indicating a possible role of HMGB1/RAGE signaling in this model. These findings are consistent with EtOH activating proin-flammatory signaling in both neuron-like SH-SY5Y and microglia-like BV2. Further work is needed to examine EtOH-induced immune signaling in both neurons and microglia.
SOURCES OF SUPPORT
were collected in collaboration with the UNC Flow Cytome-try Core Facility, which is supported in part by P30 CA016086 Cancer Center Core Support Grant to the UNC Lineberger Comprehensive Cancer Center. The authors report no conflicts of interest.
REFERENCES
Adermark L, Bowers MS (2016) Disentangling the role of astrocytes in alco-hol use disorder. Alcoalco-hol Clin Exp Res 40:1802–1816.
Agrawal RG, Hewetson A, George CM, Syapin PJ, Bergeson SE (2011) Minocycline reduces ethanol drinking. Brain Behav Immun 25(Suppl 1): S165–S169.
Alfonso-Loeches S, Pascual-Lucas M, Blanco AM, Sanchez-Vera I, Guerri C (2010) Pivotal role of TLR4 receptors in alcohol-induced neuroinflam-mation and brain damage. J Neurosci 30:8285–8295.
Andersson U, Tracey KJ (2011) HMGB1 is a therapeutic target for sterile inflammation and infection. Annu Rev Immunol 29:139–162.
Blanco AM, Valles SL, Pascual M, Guerri C (2005) Involvement of TLR4/ type I IL-1 receptor signaling in the induction of inflammatory mediators and cell death induced by ethanol in cultured astrocytes. J Immunol 175:6893–6899.
Blednov YA, Bergeson SE, Walker D, Ferreira VM, Kuziel WA, Harris RA (2005) Perturbation of chemokine networks by gene deletion alters the reinforcing actions of ethanol. Behav Brain Res 165:110–125.
Blednov YA, Ponomarev I, Geil C, Bergeson S, Koob GF, Harris RA (2012) Neuroimmune regulation of alcohol consumption: behavioral validation of genes obtained from genomic studies. Addict Biol 17:108–120. Boyadjieva NI, Sarkar DK (2010) Role of microglia in ethanol’s apoptotic
action on hypothalamic neuronal cells in primary cultures. Alcohol Clin Exp Res 34:1835–1842.
Chen GY, Nunez G (2010) Sterile inflammation: sensing and reacting to damage. Nat Rev Immunol 10:826–837.
Cheung YT, Lau WK, Yu MS, Lai CS, Yeung SC, So KF, Chang RC (2009) Effects of all-trans-retinoic acid on human SH-SY5Y neuroblas-toma as in vitro model in neurotoxicity research. Neurotoxicology 30:127–135.
Coller JK, Hutchinson MR (2012) Implications of central immune signaling caused by drugs of abuse: mechanisms, mediators and new therapeutic approaches for prediction and treatment of drug dependence. Pharmacol Ther 134:219–245.
Collins MA, Corso TD, Neafsey EJ (1996) Neuronal degeneration in rat cerebrocortical and olfactory regions during subchronic “binge” intoxica-tion with ethanol: possible explanaintoxica-tion for olfactory deficits in alcoholics. Alcohol Clin Exp Res 20:284–292.
Crews F, Nixon K, Kim D, Joseph J, Shukitt-Hale B, Qin L, Zou J (2006) BHT blocks NF-kappaB activation and ethanol-induced brain damage. Alcohol Clin Exp Res 30:1938–1949.
Crews FT, Collins MA, Dlugos C, Littleton J, Wilkins L, Neafsey EJ, Pent-ney R, Snell LD, Tabakoff B, Zou J, Noronha A (2004) Alcohol-induced neurodegeneration: when, where and why? Alcohol Clin Exp Res 28: 350–364.
Crews FT, Qin L, Sheedy D, Vetreno RP, Zou J (2013) High mobility group box 1/Toll-like receptor danger signaling increases brain neuroimmune activation in alcohol dependence. Biol Psychiatry 73:602–612.
Crews FT, Vetreno RP (2016) Mechanisms of neuroimmune gene induction in alcoholism. Psychopharmacology 233:1543–1557.
Drew PD, Kane CJ (2014) Fetal alcohol spectrum disorders and neuroim-mune changes. Int Rev Neurobiol 118:41–80.
Fernandez-Lizarbe S, Montesinos J, Guerri C (2013) Ethanol induces TLR4/ TLR2 association, triggering an inflammatory response in microglial cells. J Neurochem 126:261–273.
Fernandez-Lizarbe S, Pascual M, Guerri C (2009) Critical role of TLR4 response in the activation of microglia induced by ethanol. J Immunol 183:4733–4744.
Han SH, Kim YH, Mook-Jung I (2011) RAGE: the beneficial and deleteri-ous effects by diverse mechanisms of actions. Mol Cells 31:91–97. He J, Crews FT (2008) Increased MCP-1 and microglia in various regions of
the human alcoholic brain. Exp Neurol 210:349–358.
Henn A, Lund S, Hedtjarn M, Schrattenholz A, Porzgen P, Leist M (2009) The suitability of BV2 cells as alternative model system for primary micro-glia cultures or for animal experiments examining brain inflammation. Altex 26:83–94.
Hiscott J (2007) Triggering the innate antiviral response through IRF-3 acti-vation. J Biol Chem 282:15325–15329.
Jang Y, Lee MH, Park JH, Han SY, Kim DK (2016) TLR3 deficiency increases voluntary alcohol consumption. NeuroReport 27:356–360. Kalluri HS, Ticku MK (2003) Regulation of ERK phosphorylation by
etha-nol in fetal cortical neurons. Neurochem Res 28:765–769.
Klegeris A, McGeer PL (2001) Inflammatory cytokine levels are influenced by interactions between THP-1 monocytic, U-373 MG astrocytic, and SH-SY5Y neuronal cell lines of human origin. Neurosci Lett 313:41–44. Kokkola R, Andersson A, Mullins G, Ostberg T, Treutiger CJ, Arnold B,
Nawroth P, Andersson U, Harris RA, Harris HE (2005) RAGE is the major receptor for the proinflammatory activity of HMGB1 in rodent macrophages. Scand J Immunol 61:1–9.
Korecka JA, van Kesteren RE, Blaas E, Spitzer SO, Kamstra JH, Smit AB, Swaab DF, Verhaagen J, Bossers K (2013) Phenotypic characterization of retinoic acid differentiated SH-SY5Y cells by transcriptional profiling. PLoS ONE 8:e63862.
Lehmann SM, Kruger C, Park B, Derkow K, Rosenberger K, Baumgart J, Trimbuch T, Eom G, Hinz M, Kaul D, Habbel P, Kalin R, Franzoni E, Rybak A, Nguyen D, Veh R, Ninnemann O, Peters O, Nitsch R, Heppner FL, Golenbock D, Schott E, Ploegh HL, Wulczyn FG, Lehnardt S (2012) An unconventional role for miRNA: let-7 activates Toll-like receptor 7 and causes neurodegeneration. Nat Neurosci 15:827–835.
Lippai D, Bala S, Petrasek J, Csak T, Levin I, Kurt-Jones EA, Szabo G (2013) Alcohol-induced IL-1beta in the brain is mediated by NLRP3/ASC inflammasome activation that amplifies neuroinflammation. J Leukoc Biol 94:171–182.
Liu W, Crews FT (2015) Adolescent intermittent ethanol exposure enhances ethanol activation of the nucleus accumbens while blunting the prefrontal cortex responses in adult rat. Neuroscience 293:92–108.
Lok KZ, Basta M, Manzanero S, Arumugam TV (2015) Intravenous immunoglobulin (IVIg) dampens neuronal toll-like receptor-mediated responses in ischemia. J Neuroinflammation 12:73.
Mayfield J, Ferguson L, Harris RA (2013) Neuroimmune signaling: a key component of alcohol abuse. Curr Opin Neurobiol 23:513–520.
McCall MN, McMurray HR, Land H, Almudevar A (2014) On non-detects in qPCR data. Bioinformatics 30:2310–2316.
Montesinos J, Alfonso-Loeches S, Guerri C (2016) Impact of the innate immune response in the actions of ethanol on the central nervous system. Alcohol Clin Exp Res 40:2260–2270.
Nagai Y, Akashi S, Nagafuku M, Ogata M, Iwakura Y, Akira S, Kitamura T, Kosugi A, Kimoto M, Miyake K (2002) Essential role of MD-2 in LPS responsiveness and TLR4 distribution. Nat Immunol 3:667–672. Narayanan KB, Park HH (2015) Toll/interleukin-1 receptor (TIR)
domain-mediated cellular signaling pathways. Apoptosis 20:196–209.
Nessa BN, Tanaka T, Kamino K, Sadik G, Ansar AB, Kimura RYO, Tanii H, Okochi M, Morihara T, Tagami S, Kudo T, Takeda M (2006) Toll-like receptor 3 mediated hyperphosphorylation of tau in human SH-SY5Y neuroblastoma cells. Psychiatry Clin Neurosci 60:S27–S33.
Newton K, Dixit VM (2012) Signaling in innate immunity and inflammation. Cold Spring Harb Perspect Biol 4:a006049.
Park JS, Svetkauskaite D, He Q, Kim JY, Strassheim D, Ishizaka A, Abraham E (2004) Involvement of toll-like receptors 2 and 4 in cellular activation by high mobility group box 1 protein. J Biol Chem 279: 7370–7377.
Perez-Carrion MD, Cena V (2013) Knocking down HMGB1 using den-drimer-delivered siRNA unveils its key role in NMDA-induced autophagy in rat cortical neurons. Pharm Res 30:2584–2595.
Prehaud C, Megret F, Lafage M, Lafon M (2005) Virus infection switches TLR-3-positive human neurons to become strong producers of beta inter-feron. J Virol 79:12893–12904.
Qin L, Crews FT (2012a) Chronic ethanol increases systemic TLR3 agonist-induced neuroinflammation and neurodegeneration. J Neuroinflammation 9:130.
Qin L, Crews FT (2012b) NADPH oxidase and reactive oxygen species con-tribute to alcohol-induced microglial activation and neurodegeneration. J Neuroinflammation 9:5.
Qin L, He J, Hanes RN, Pluzarev O, Hong JS, Crews FT (2008) Increased systemic and brain cytokine production and neuroinflammation by endo-toxin following ethanol treatment. J Neuroinflammation 5:10.
Reynolds AR, Berry JN, Sharrett-Field L, Prendergast MA (2015) Ethanol withdrawal is required to produce persisting N-methyl-D-aspartate recep-tor-dependent hippocampal cytotoxicity during chronic intermittent etha-nol exposure. Alcohol 49:219–227.
Rivest S (2009) Regulation of innate immune responses in the brain. Nat Rev Immunol 9:429–439.
Schwarz JM, Smith SH, Bilbo SD (2013) FACS analysis of neuronal-glial interactions in the nucleus accumbens following morphine administration. Psychopharmacology 230:525–535.
Sha Y, Zmijewski J, Xu Z, Abraham E (2008) HMGB1 develops enhanced proinflammatory activity by binding to cytokines. J Immunol 180:2531– 2537.
Shin JH, Lee HK, Lee HB, Jin Y, Lee JK (2014) Ethyl pyruvate inhibits HMGB1 phosphorylation and secretion in activated microglia and in the postischemic brain. Neurosci Lett 558:159–163.
Tang SC, Arumugam TV, Xu X, Cheng A, Mughal MR, Jo DG, Lathia JD, Siler DA, Chigurupati S, Ouyang X, Magnus T, Camandola S, Mattson MP (2007) Pivotal role for neuronal Toll-like receptors in ischemic brain injury and functional deficits. Proc Natl Acad Sci U S A 104:13798–13803. Town T, Jeng D, Alexopoulou L, Tan J, Flavell RA (2006) Microglia
recog-nize double-stranded RNA via TLR3. J Immunol 176:3804–3812.
Tuomela S, Autio R, Buerki-Thurnherr T, Arslan O, Kunzmann A, Ander-sson-Willman B, Wick P, Mathur S, Scheynius A, Krug HF, Fadeel B, Lahesmaa R (2013) Gene expression profiling of immune-competent human cells exposed to engineered zinc oxide or titanium dioxide nanopar-ticles. PLoS One 8:e68415.
Vetreno RP, Crews FT (2012) Adolescent binge drinking increases expres-sion of the danger signal receptor agonist HMGB1 and Toll-like receptors in the adult prefrontal cortex. Neuroscience 226:475–488.
Vetreno RP, Qin L, Crews FT (2013) Increased receptor for advanced glyca-tion end product expression in the human alcoholic prefrontal cortex is linked to adolescent drinking. Neurobiol Dis 59:52–62.
Wang X, Chu G, Yang Z, Sun Y, Zhou H, Li M, Shi J, Tian B, Zhang C, Meng X (2015) Ethanol directly induced HMGB1 release through NOX2/ NLRP1 inflammasome in neuronal cells. Toxicology 334:104–110. Yang H, Antoine DJ, Andersson U, Tracey KJ (2013) The many faces of
HMGB1: molecular structure-functional activity in inflammation, apopto-sis, and chemotaxis. J Leukoc Biol 93:865–873.
Yang H, Wang H, Ju Z, Ragab AA, Lundback P, Long W, Valdes-Ferrer SI, He M, Pribis JP, Li J, Lu B, Gero D, Szabo C, Antoine DJ, Harris HE, Golenbock DT, Meng J, Roth J, Chavan SS, Andersson U, Billiar TR, Tracey KJ, Al-Abed Y (2015) MD-2 is required for disulfide HMGB1-dependent TLR4 signaling. J Exp Med 212:5–14.
Zou JY, Crews FT (2014) Release of neuronal HMGB1 by ethanol through decreased HDAC activity activates brain neuroimmune signaling. PLoS One 9:e87915.
SUPPORTING INFORMATION
Additional Supporting Information may be found online in the supporting information tab for this article: