Proceedings of the
Third International Workshop on Graph Based Tools
(GraBaTs 2006)
The ParMol Package for Frequent Subgraph Mining
Thorsten Meinl , Marc W ¨orlein, Olga Urzova, Ingrid Fischer, and Michael Philippsen
12 pages
Guest Editors: Albert Z ¨undorf, Daniel Varr ´o
Managing Editors: Tiziana Margaria, Julia Padberg, Gabriele Taentzer
The ParMol Package for Frequent Subgraph Mining
Thorsten Meinl1, Marc W¨orlein3, Olga Urzova4, Ingrid Fischer2, and Michael Philippsen5
ALTANA Chair for Bioinformatics and Information Mining University of Konstanz, Box M712, 78457 Konstanz, Germany
Computer Science Department 2
University of Erlangen-Nuremberg, Martensstr. 3, 91058 Erlangen, Germany
Abstract: Mining for frequent subgraphs in a graph database has become a popular
topic in the last years. Algorithms to solve this problem are used in chemoinfor-matics to find common molecular fragments in a database of molecules represented as two-dimensional graphs. However, the search process in arbitrary graph struc-tures includes costly graph and subgraph isomorphism tests. In our ParMol package we have implemented four of the most popular frequent subgraph miners using a common infrastructure: MoFa, gSpan, FFSM, and Gaston. Besides the pure re-implementation, we have added additional functionality to some of the algorithms like parallel search, mining directed graphs, and mining in one big graph instead of a graph database. Also a 2D-visualizer for molecules has been integrated.
Keywords: graph, subgraph, frequent, mining, ParMol
1
Mining Molecular Databases
The motivation for the ParMol (Parallel Molecular Mining) project is to find common features in large sets of molecules. This is a frequently reoccurring problem in many biological or chemical applications. E.g. in drug discovery, the goal is to identify common parts in molecules sharing similar chemical properties. A common approach is to use the two dimensional atom-bond struc-ture of molecules as basis for a undirected labeled graph database containing these molecules.1 This database is searched for subgraphs that appear at least in a certain number of molecules. Searching for frequent subgraphs in a graph database is also called graph mining. The frequent graph (resp. molecular) fragments then often give an insight into the specific behavior of the molecules.
O
C
C
O
C
C C
N N N
C
O
O
C
C C
N C
N
Figure 1: AZT – a well-known HIV-1 inhibitor. A famous example for a frequent molecular fragment is the
so called AZT, which is a well-known HIV-1 inhibitor (see Figure 1for its two dimensional representation as graph with-out hydrogen atoms). In a database containing more than 40,000 molecules tested against the HIV-1 virus [NCI99], this active molecular fragment can be found within minutes using the right algorithms.
For the extraction of molecular fragments like AZT, various methods have been described recently. The most popular min-ing algorithms are re-implemented in our ParMol package. The first goal of our implementation was to compare these algo-rithms in runtime and memory consumption, currently new ex-tensions and application areas are researched. This paper gives an overview on the current state of ParMol. In the next section we introduce searching fragments in graphs and its problems
in general. Section 3gives a short description of the four implemented algorithms. Section 4 introduces ParMol itself. Extensions to ParMol are described inSection 5, the current work is sketched inSection 6. We conclude the paper inSection 7.
2
Frequent Subgraph Mining
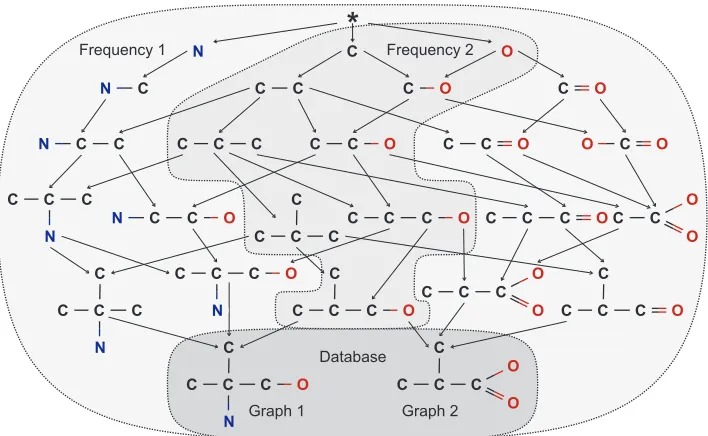
Mining molecules can be reduced to searching a database of graphs for subgraphs that occur in at least a given percentage (support) or number (frequency) of all graphs. An example of a graph (molecular) database containing just two graphs (molecules) is given inFigure 2at the bottom. The database is shaded in dark gray. It contains two molecules labeled Graph 1 and Graph 2 in the Figure. The goal is to find all subgraphs that are frequent in this database. If frequency 2 or a support of 100% is assumed, the subgraphs must occur in both graphs.
A naive approach would be to create all possible subgraphs and to determine their frequency by subgraph isomorphism tests. This approach is very costly and more sophisticated algorithms exist.
A systematic approach is to (conceptually) arrange all subgraphs in the database in a lattice, seeFigure 2for the running example. The empty subgraph is shown at the top, the following layers of the lattice contain all zero-edge, one-edge, ..., n-edge subgraphs and their frequencies. Frequency 1 is shaded in light gray, frequency 2 is shaded in gray. There are three subgraphs with zero edges namely the atoms C, N, and O. On the next level there are four subgraphs with one edge, five subgraphs contain two edges. On the bottom of the lattice the underlying database is given as both graphs contain five edges.2 A connection between two items in the lattice is an extension of a subgraph by an edge and a node if no cycle is closed.
Frequent subgraph mining now consists of creating and traversing this lattice and reporting all frequent items. If the frequency was set to 2 molecules for the small example database in Figure 2, the miner would output only the fragments that occur in both molecules (the ones inside the grey area in the middle of the lattice). All other fragments would either be suppressed
Figure 2: A complete fragment lattice of the molecules at the bottom.
or not even discovered during the search.
When implementing a subgraph miner, a traversal strategy for the lattice has to be chosen, e.g. depth-first or breadth-first traversal. The majority of algorithms traverses the lattice in a depth-first way because it needs less memory than breadth-first search.
Figure 3: Merging two sub-graphs over a common core to create a new subgraph. Second it must be decided how new subgraphs are generated
from existing subgraphs. Two methods are commonly used. Either an already generated fragment is extended by an edge (and a node if no cycle is closed). This edge (and node) is found in the database. With the help of this strategy the lattice inFigure 2was motivated before. Edge extension needs access to the database and only creates existing candidates. This strat-egy is the most popular one. Another possibility is to generate
new subgraphs by merging two subgraphs already found that have a common core. This merging approach solely works on the subgraphs and may generate candidates that do not occur in the database. InFigure 3this strategy is explained. The two graphs at the top have a common core consisting of two C atoms. This core is used to generate a new possible subgraph at the bottom of the Figure. Then it must be checked how frequent this new subgraph is.
process on different paths through the search lattice can be avoided.
2.1 Frequency Calculation
There are two possibilities to determine the frequency of a candidate subgraph. First ordinary NP-complete (and thus expensive) subgraph isomorphism tests can be made against all database graphs. The number of tests can be reduced if so-called appearance lists are maintained that record the graphs a subgraph occurs in. In the running example, the fragment consisting of the atoms C and O connected with a bond has both database molecules in its appearance list as it appears in both molecules. The sub molecule consisting of C and N has an appearance list with the graph 1 ofFigure 2. After extending a subgraph, it suffices to check all graphs in the appearance list instead of testing the whole database to calculate the frequency. This is possible because of the antimonotonicity property described in the previous section.
Another possibility is to use embedding lists. An embedding is a subgraph isomorphism of a subgraph in the lattice to a graph in the database. The embedding list contains all possible em-beddings. In the embedding list the subgraph isomorphisms are stored whereas in the appearance list only the molecules are mentioned a subgraph appears in. With embedding lists the frequency can be determined by just counting the different referred graphs of the isomorphisms. Addition-ally, it is easy to find all possible extensions of a subgraph by looking at the surroundings of the embeddings in the graphs of the database. Without embeddings the subgraphs to be extended would have to be re-embedded again and again. However, in general the use of embedding lists requires much more memory since the number of embeddings can be huge especially for small or symmetric subgraphs.
2.2 Filtering Duplicates in the Search Lattice
A subgraph can be reached on different paths in the search lattice. It is important for an efficient algorithm to avoid these duplicates, every subgraph should be found just once. There are different ways to avoid duplicates. First a local heuristics can be applied that decides if an extended subgraph has already been found (or will be found in the future). The most popular heuristics are
maximum source node extension and rightmost path extension [Bor05]. They work by restricting the number of nodes in a subgraph, at which a new edge can be added.
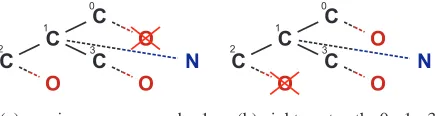
(a) maximum source node: 1 (b) rightmost path: 0 - 1 - 3
Figure 4: Examples of maximum source node exten-sions and rightmost path extension for a molecular fragment.
In Figure 4 both extension princi-ples are illustrated. In this Figure a subgraph and its different extension possibilities are given. Extensions are marked with dotted lines. Nodes are numbered (see the little number on each node) according to the order they have been inserted in the sub-graph. The crossed-out extensions are not allowed by the corresponding heuristic.
been added to the subgraph after the node that has been extended in the last step (the maximum
source node). An example is shown inFigure 4(a). The last inserted node is C with number 3. It extended the node C with number 1. So it is possible to extend the nodes 1, 2 and 3 in the next step but not node 0.
Rightmost path extension forbids to add edges at nodes that are not on the rightmost path, which is a path from the root node to the latest added node. An example is shown inFigure 4(b). The rightmost path is a path from node 0 to node 3. Extensions to node 2 are forbidden, as this node is not on the path from node 0 to node 3.
However, these local heuristics cannot suppress all duplicates and do not work for algorithms that generate new possible subgraphs by merging two subgraphs already found as described before. Therefore, another (more complex) filtering step is needed, for which two different approaches exist. First a list of all already discovered subgraphs is maintained and any new candidate will be checked for graph isomorphism. Second a canonical form for each subgraph can be built during the construction, that reflects the extension order. A canonical form is a special code to describe a subgraph. To avoid duplicates, only the subgraph with the minimal (or maximal) canonical code is kept and extended further. All other non-canonical ones are ignored. In [WMFP05,NK06] it is shown that the latter approach performs better in practice. An example of a canonical form is given in the next section.
Summing up, graph mining algorithms need a search strategy through the subgraph lattice, must generate new subgraphs and calculate their frequency while avoiding duplicates. Differ-ent graph mining algorithms solve these problems differDiffer-ently. In the ParMol package we im-plemented four different graph miners to evaluate their performance when mining molecular databases. The implemented graph mining algorithms are shortly presented in the next section.
3
MoFa, gSpan, FFSM, and Gaston
All four fragment miners included in ParMol work on general, undirected graphs with labeled nodes and edges. They are all restricted to finding connected subgraphs and traverse the lattice in depth-first order.
MoFa (Molecule Fragment Miner, by Borgelt and Berthold in 2002 [BB02]) has been tar-geted towards molecular databases, but it can also be used for arbitrary graphs. MoFa stores all embeddings. New subgraphs are build by extending old subgraphs with an edge (and a node if necessary). Extension is restricted to those fragments, that actually appear in the database. Isomorphism tests in the database can be done cheaply by testing whether an embedding can be refined in the same way. MoFa uses a fragment-local heuristic close to the maximum source node extension described above and uses standard isomorphism testing to remove duplicates.
FFSM (Fast Frequent Subgraph Mining, by Huan, Wang, and Prins in 2003 [HWP03]) rep-resents graphs as triangle matrices (node labels on the diagonal, edge labels elsewhere). The
canonical adjacency matrix, CAM, is used to detect duplicates. The matrix-code is the
matrix inFigure 5is the biggest one, its string is the canonical code.
O
2 C
- 1 O
- 1 - C
- - - 1 C
- - - 1 - C
>
O
1 C
- 1 C
- - 1 C
- - 1 - C
- 2 - - - O
>
C
1 C
1 - C
1 - - C
- 1 - - O
- 2 - - - O
Figure 5: Three different adjacency matrices for Graph 2. With
O>C and 2>1>−the left one is the biggest and so canonical one.
New subgraphs are gen-erated by merging CAMs that have special properties in common. In addition FFSM needs a restricted extension operation: a new edge-node pair may only be added to the last node of a CAM. When FFSM joins
two matrices of fragments to generate new subgraphs, only at most two new structures result. After refinement generation, FFSM permutes matrix lines to check whether a generated matrix is in canonical form. If not, it can be pruned. FFSM stores embeddings to avoid explicit subgraph isomorphism testing.
gSpan (graph-based Substructure pattern, by Yan and Han in 2002 [YH02]) uses a canonical form for graphs (called dfs-code: depth first search code) resulting from the used rightmost path extension to eliminate the remaining duplicates. A depth first traversal of a graph defines an order in which the nodes and edges are visited. The concatenation of edge representations in that order is the graph’s dfs-code. Refinement generation is restricted by gSpan in two ways: First, fragments can only be extended at nodes that lie on the rightmost path of the depth first search tree. Second, fragment generation is guided by occurrence in the appearance lists. Since these two pruning rules cannot fully prevent isomorphic fragment generation, gSpan computes the canonical (lexicographically smallest) dfs-code for each refinement. Refinements with non-minimal dfs-code can be pruned. Since instead of embeddings, gSpan only stores appearance lists for each fragment, explicit subgraph isomorphism testing must be done on all graphs in these appearance lists.
4
The ParMol Package
Work on the ParMol package started in 2004 with the implementation and the comparison of the four graph miners based on a common graph library and in-/output modules. This overlapping code basis ensured the comparability and the same level of maturity of our implementations. To ensure platform independence and extensibility we used Java as programming language. Instead of some original code, our code is released under the GPL (GNU Public License) and is available athttp://www2.cs.fau.de/Forschung/Projekte/ParMol/. There is no other library that contains all four miners based on the same data structures. For gSpan and FFSM no open source imple-mentations are available at all by the original authors. Our first goal was to make all miners comparable based on runtime and memory consumption.
0 20 40 60 80 100 120
4 6 8 10 12 14 16 18 20
runtime in min
minimal support in % HIV(42689 graphs)
MoFa(base) gSpan FFSM Gaston
0.2 0.4 0.6 0.8 1 1.2 1.4 1.6
4 6 8 10 12 14 16 18 20
memory usage in GB
minimal support in % HIV(42689 graphs)
MoFa(base) gSpan FFSM Gaston
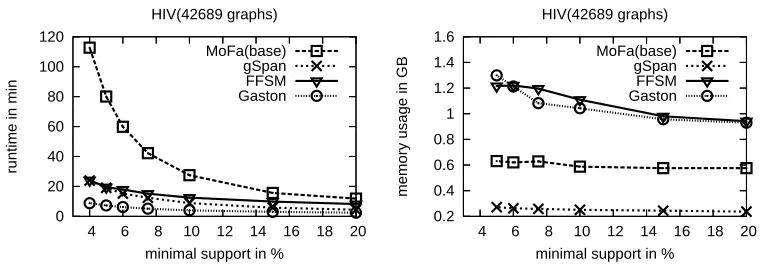
Figure 6: Runtime and memory measurements on the NCI-HIV dataset
InFigure 6runtime and memory of the four algorithms when mining the HIV [NCI99] database is given. This database contains the famous AZT shown inFigure 1. The HIV dataset contains 42,689 molecules with an average of 27 edges. The tests were all done on 64bit Linux systems because of the huge memory requirements of some algorithms. The runtime experiments were done on a Dual-Itanium 2 PC running at 1.3 GHz with 10GB of RAM. Here we used IBM’s Java Virtual Machine (JVM) 1.4.2 because it produced the best runtime results for all algorithms.3 The maximal heap space available to the JVM was set to 8GB to avoid swapping influences. For the memory tests we used the SUN JVM4 as the IBM JVM showed garbage collector arti-facts. Each test was run five times, the values given are averaged from these runs. On the x-axis inFigure 6 the support is given when running the algorithms ranging up to 20%. On the left hand side, the runtime of the different algorithms is given, the y-axis is labeled with minutes. On the right hand side memory consumption is shown, where the y-axis is labelled with GB. In this test, Gaston needs the most memory while gSpan uses the least memory for the HIV database. This result is confirmed by tests of the authors of the original algorithm. Other tests we describe in [WMFP05] showed that Gaston and gSpan are very fast while gSpan does not use much memory.
The molecule databases can be read and written in a variety of formats (Smiles, SLN, SDF, GraphViz dot, and some generic graph representations). The input can optionally be compressed with gzip in order to save space. As it is common for molecular datasets, ParMol can divide the input graphs into several classes and independent support can be given for each class.5
The four miners have a common interface, a set of common options, like the min/max support, reporting just closed subgraphs (seeSubsection 5.1) , or mining only trees or simple paths, and have been successfully applied to databases containing up to 237,771 molecules with a support of 5% on a Dual-Itanium 2 PC running at 1.3 GHz with 10GB of RAM. gSpan and MoFa have been extended since then in different directions.
Figure 7: ParMol visualization tool. gSpan is applied to a mining algorithm is applied HIV-CA [NCI99]. The most prominent fragment, the HIV-1 inhibitor AZT, is dis-played.
We also implemented a 2D visu-alizer for molecules [Urz05] based on [Hel99]. Automated drawing of molecules in 2D is not as sim-ple as rendering in 3D, because chemist have certain drawing con-ventions like regular polygons for rings, fixed angles between two bonds, or the overall direction of the “main-chain”. The existing tools for 2D visualization are either for draw-ing molecules by hand (e.g. [ISI, Che, JMo, JCh]) or require special representations that afterwards can be displayed [FGR04]. Additionally
not all of them are available as Java libraries. Thus we decided to extend the project by our own visualizer that can be used to report progress during the search or to display graphical represen-tations of the found fragments. Figure 7contains a screen shot of the graphical user interface of ParMol and the molecule viewer.
5
Extensions to the Mining Algorithms
MoFa and gSpan have been extended in several directions. New pruning strategies were added and the ParMol package was adapted for a new application area: procedural abstraction in com-piler construction.
5.1 Mining Closed Fragments
First we integrated the special pruning rules for closed fragments (a fragment is closed when there is no supergraph with the same support in the graph set under consideration). This reduces the number of found fragments and the complete set can easily reconstructed out of it. As a nice side effect, the user is mainly interested in the closed fragment set only.
Closed fragments can of course be filtered after the mining process but integrating the filtering into mining leads to a smaller search space using less memory. The integrated pruning scheme for MoFa [BMB04] and gSpan [YH03] works more or less the same. For each extension of a fragment it is checked if it can be applied to all its embeddings. This indicates that the extended fragment might have the same frequency as its parent. If there is one, MoFa only follows this so called perfect extension and defers all other possible extensions. To keep the lexicographical order, gSpan just prunes lexicographic smaller extensions. However, the pruning rules presented in [BMB04, YH03] are too general, because there exist closed fragments embedded in cyclic structures that are accidentally pruned. Therefore our implementations use this pruning only on non-cycle edges (so called bridges).
5.2 Graph Mining for Procedural Abstraction
Mining molecule databases is the most common application area of graph mining. We also apply graph mining to a special problem in compiler construction [WDM+
06,DWF+
07]. To reduce the code size of programs, common code parts can be abstracted to procedures (procedural
abstraction). Graph mining on the data flow graphs of a program finds such interesting code
fragments.
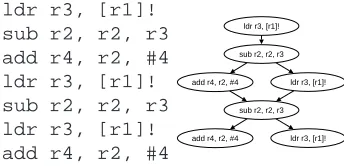
These data flow graphs are directed acyclic graphs (DAG) for which several extensions are necessary. InFigure 8a short piece of code and its corresponding data flow graph is given. In this data flow graphs there are several subgraphs that appear more than once. A frequent code fragment can be extracted to a new procedure. If the repeated code fragments are substituted with a call to the new procedure, the overall code size shrinks.
ldr r3, [r1]! sub r2, r2, r3 add r4, r2, #4 ldr r3, [r1]! sub r2, r2, r3 ldr r3, [r1]! add r4, r2, #4
add r4, r2, #4 ldr r3, [r1]! ldr r3, [r1]!
sub r2, r2, r3
add r4, r2, #4 ldr r3, [r1]! sub r2, r2, r3
Figure 8: basic block of assembler code (left) and the corresponding data flow graph (right).
Figure 9: Just one embedding for the fragment
A→B exists, but two for the extended fragment A→B→C.
To implement mining on directed graphs, we have (among other things) extended gSpan’s canonical form with an additional flag. Also MoFa can easily be adapted for directed graphs. MoFa must only distinguish between incoming and outgoing edges and an additional pruning rule can be added (all incoming edges are always added before the first outgoing edge).
pruning the search tree, seeFigure 9. Fortunately, if the counting of occurrences is restricted to the maximal set of non-overlapping embeddings, the frequency again falls monotonically and pruning is possible. As a nice side effect, this restriction is also useful for code abstraction, be-cause overlapping embeddings cannot be outlined together anyway. However, determining this maximum set is another NP-complete problem that makes mining even more expensive. It es-sentially requires to compute the maximum independent set of all nodes in a so-called collision graph in which the embeddings of a subgraph form the nodes; two nodes are connected if the two embeddings overlap.
6
Current and future work
In [MWFP06] we presented parallel versions of gSpan and MoFa on a high performance shared-memory multiprocessor system. Because such SMP systems are quite expensive and do not scale well, we are implementing a version of ParMol that runs in a cluster using the JavaParty [Jav] framework. The additional communication required because of the distributed memory should be amortized by the benefit of unsynchronized memory accesses.
We generalize and extract structural similarities between the four different algorithms to derive a form of parallelization that works for all of them. The general mining pattern is as follows: During initialization the required primary steps like the generation of initial search lattice nodes or relabeling/compressions of the database can be done. Afterwards the traversing loop considers the unextended fragments according to the traversal sequence and checks them for relevance (frequency, canonical, size, etc.). If the current fragment has to be extended, one of different child generation algorithms can be inserted (maximum source node, rightmost path extension, Gaston’s path/tree/cycle generation, or others). Afterwards the analyzed fragment can be stored if necessary and all the children found have to be traversed. Finally, additional filters can be selected to reduce the set of found fragments. E.g. the reduction to the closed subset of found fragments can also be done at the end so that each algorithm can easily (but not necessary very efficiently) support this feature.
From this pattern the granularity of the parallelization is obvious: each processing unit (cluster computer or shared memory processor) performs the checks for and the extension of one frag-ment. By extending the children afterwards by the same or any other idle unit a dynamic and efficient parallelization can be reached [MWFP06].
7
Conclusions
The ParMol package consists of open source implementations of four popular frequent subgraph miners. A 2D visualizer for molecules is integrated in the framework and can be attached directly to the miners. To speed up the search on huge databases parallel versions of two miners are available. Their scalability is discussed in another paper [MWFP06].
In addition to the re-implementations of the algorithms we presented several extensions of MoFa and gSpan not only to speed up the search but also to make them applicable to non-molecule applications. We also sketched our current work that aims at unifying the graph miner even more.
Bibliography
[BB02] C. Borgelt, M. R. Berthold. Mining Molecular Fragments: Finding Relevant Sub-structures of Molecules. In Proc. IEEE Int’l Conf. on Data Mining. Pp. 51–58. Maebashi City, Japan, Nov. 2002.
[BMB04] C. Borgelt, T. Meinl, M. R. Berthold. Advanced Pruning Strategies to Speed Up Mining Closed Molecular Fragments. In Proc. of the 2004 IEEE Conf. on Systems,
Man and Cybernetics, SMC 2004. Pp. 4565 – 4570. Den Haag, The Netherlands,
Oct. 2004.
[Bor05] C. Borgelt. On Canonical Forms for Frequent Graph Mining. In 3rd Int’l Workshop
on Mining Graphs, Trees, and Sequences. Pp. 1–12. Porto, Portugal, Oct. 2005.
[Che] ChemWindow 6.0. http://www.bio-rad.com/.
[DWF+
07] A. Dreweke, M. Wrlein, I. Fischer, D. Schell, T. Meinl, M. Philippsen. Graph-Based Procedural Abstraction. In Society (ed.), Proc. of the 2007 CGO. Pp. 259– 270. IEEE Computer Society, Los Alamitos, CA, USA, 2007.
[FGR04] P. C. Fricker, M. Gastreich, M. Rarey. Automated Drawing of Structural Molec-ular Formulas under Constraints. Journal of Chemical Information and Computer
Science 44:1065–1078, 2004.
[Hel99] H. E. Helson. Structure Diagram Generation. Reviews in Computational Chemistry, pp. 313–398, 1999.
[HWP03] J. Huan, W. Wang, J. Prins. Efficient Mining of Frequent Subgraphs in the Presence of Isomorphism. In Proc. of the 3rd IEEE Int’l Conf. on Data Mining. Pp. 549–552. Melbourne, FL, Nov. 2003.
[ISI] ISIS/Draw 2.5. http://www.mdli.com/products/framework/isis draw/index.jsp.
[Jav] JavaParty, a distributed companion to Java. http://www.ipd.uka.de/JavaParty/.
[JMo] JMol, a molecule viewer in Java. http://jmol.sourceforge.net/.
[MWFP06] T. Meinl, M. Wrlein, I. Fischer, M. Philippsen. Mining Molecular Datasets on Sym-metric Multiprocessor Systems. In Proc. of the 2006 IEEE Int’l Conf. on Systems,
Man and Cybernetics. Pp. 1269–1274. Taipei, Taiwan, 2006.
[NCI99] National Cancer Institute, DTP AIDS Antiviral Screen. http://dtp.nci.nih.gov/docs/aids/aids data.html, Mar. 1999.
[NK04a] S. Nijssen, J. N. Kok. Frequent Graph Mining and its Application to Molecular Databases. In Proc. of the 2004 IEEE Conf. on Systems, Man and Cybernetics,
SMC 2004. Pp. 4571 – 4577. Den Haag, The Netherlands, Oct. 2004.
[NK04b] S. Nijssen, J. N. Kok. The Gaston Tool for Frequent Subgraph Mining. Proc. Int’l
Workshop on Graph-Based Tools 127(1):77–87, 2004.
[NK06] S. Nijssen, J. N. Kok. Frequent Subgraph Miners: Runtime Don’t Say Everything. In G¨artner et al. (eds.), Proc. of the Int’l Workshop on Mining and Learning with
Graphs (MLG 2006). Pp. 173–180. Berlin, Germany, 2006.
[Urz05] O. Urzova. Zweidimensionale Visualisierung von Molek¨ulgraphen in Java. Stu-dienarbeit, Computer Science Department 2, University of Erlangen-Nuremberg, Oct. 2005.
[WDM+
06] M. W ¨orlein, A. Dreweke, T. Meinl, I. Fischer, M. Philppsen. Edgar: the Embedding-baseD GrAph MineR. In G¨artner et al. (eds.), Proc. of the Int’l
Work-shop on Mining and Learning with Graphs (MLG 2006). Pp. 221–228. Berlin,
Ger-many, 2006.
[WMFP05] M. W ¨orlein, T. Meinl, I. Fischer, M. Philippsen. A quantitative comparison of the subgraph miners MoFa, gSpan, FFSM, and Gaston. In Knowledge Discovery in
Database: PKDD 2005. Volume 3721, pp. 392–403. Springer, Berlin, 2005.
[YH02] X. Yan, J. Han. gSpan: Graph–Based Substructure Pattern Mining. In Proc. IEEE
Int’l Conf. on Data Mining ICDM. Pp. 721–723. Maebashi City, Japan, Nov. 2002.
[YH03] X. Yan, J. Han. CloseGraph: Mining Closed Frequent Graph Patterns. In Proc.
of the 9th ACM SIGKDD Int’l Conf. on Knowledge Discovery and Data Mining.
![Figure 7:ParMol visualization tool. gSpan is appliedto a mining algorithm is applied HIV-CA [NCI99]](https://thumb-us.123doks.com/thumbv2/123dok_us/7821658.2087709/9.612.254.508.234.347/figure-parmol-visualization-gspan-appliedto-mining-algorithm-applied.webp)