Complex Systems Informatics and Modeling Quarterly CSIMQ, Issue 8, September/October 2016, Pages 1–14 Published online by RTU Press, https://csimq-journals.rtu.lv https://doi.org/10.7250/csimq.2016-8.01
ISSN: 2255-9922 online
A Method for Software Requirement Volatility Analysis Using QFD
Yunarso Anang1,2, Masakazu Takahashi1and Yoshimichi Watanabe1
1University of Yamanashi, Interdisciplinary Graduate School of Medicine and Engineering, 4-3-11 Takeda, Kofu 400-8511, Japan
2Institute of Statistics, Department of Computational Statistics, Jl. Otto Iskandardinata No. 64C, Jakarta Timur 13330, Indonesia
{g14dma01, mtakahashi, nabe}@yamanashi.ac.jp, [email protected]
Abstract. Changes of software requirements are inevitable during the
development life cycle. Rather than avoiding the circumstance, it is easier to just accept it and find a way to anticipate those changes. This paper proposes a method to analyze the volatility of requirement by using the Quality Function Deployment (QFD) method and the introduced degree of volatility. Customer requirements are deployed to software functions and subsequently to architectural design elements. And then, after determining the potential for changes of the design elements, the degree of volatility of the software requirements is calculated. In this paper the method is described using a flow diagram and illustrated using a simple example, and is evaluated using a case study.
Keywords: Software requirement volatility, quality function deployment,
software function, architectural design, potential for changes, degree of volatility.
1
Introduction
Software development life cycle is getting tight in the matter of time to delivery of the software product. Customers demand shorter development life cycles. To accelerate the development life cycle of a software product, the incremental development life cycles such as spiral and agile have been introduced. Customers are able to see and use part of the functionalities of the final product at
a very early time. However, due to the immaturity of the software specification during the life
cycle of these models, customer requirements might be changed and the specification should be modified to accommodate those changes. Customer requirements are getting mature, and the software specification is getting mature too, but the internal design and its implementation may need a big modification in order to accommodate those incremental changes. The consequences are as follows. The delivery time may become longer, the quality of the software product may be compromised and the overall cost may grow. Nevertheless, those changes of requirements are inevitable during the development life cycle [1], [2], [3]. Thus, rather than try to avoid those changes by obtaining aperfectspecification of requirements, it is easier to just accept this potential for changes as a risk and find a way to anticipate those changes.
[6]. The QFD method can be used to transfer the software requirements to software functions and subsequently to architectural design. However, the QFD method and its current studies do not take the potential for changes of the requirements into consideration.
This paper proposes a method to analyze the potential for changes of the software requirements. The growth or changes of requirements during a software development life cycle, or the requirements’ instability, are referred to as requirement volatility [7]. We consider the potential for changes of software requirements as the volatility of software requirements. Hereinafter, we call the values representing the potential for changes as the degree of volatility. We assume the software requirements are elicited and analyzed using the QFD method. In the proposed method, the customer requirements are deployed to the software functions and subsequently to the architectural design elements. Based on architectural design pattern and empirical data from past software development projects, the degree of volatility of the architectural design elements is determined. Furthermore, we use those values of the degree of volatility to obtain the degree of volatility of the software functions and subsequently the customer requirements. Knowing the degree of volatility of the customer requirements before the actual design and implementation phases enables us to anticipate the future changes and take some appropriate actions.
In this paper, the method is described using a flow diagram with illustration, and application to a simple example is provided. Furthermore, we applied the proposed method to a case study of the development of a software product for a new student online admission system. The system used as the case study has already been developed and has been operational since the year 2010. After we applied the method and analyzed the result, we found that the method is capable of supporting analysis of software requirement volatility in the early phase of software development.
The rest of this paper is organized as follows. Section 2 describes related studies. Section 3 describes the proposed method with application to a simple example. Section 4 describes the case study we used to evaluate the proposed method. Section 5 describes the discussion of the proposed method and the result of the case study. Finally, we conclude this paper in Section 6.
2
Related Studies
In this section we describe the studies related to the proposed method which consist of studies regarding software requirements volatility, studies regarding software architectural design, and studies regarding quality function deployment especially in the domain of software development.
Software requirements volatility has been studied for quite a long time. Zowghi et al. state that software development is considered to be a dynamic process where demands for changes seem to be inevitable [2]. It happens because of the instability and the diversity of requirements such as the difficulty for stakeholders to reach agreement among themselves on the requirements. The result, as well as the other studies related to requirement volatility, have been confirmed in comprehensive literature studies conducted by Dev et al. [1]. Sharif et al. have conducted an empirical investigation on the impact of changing requirements on software project cost [8]. The result shows the significant relationship of software development life cycle phase and rework cost and that, if changes occur in later phases, more rework for the implementation is required. This result indicates that the earlier the volatility of requirement can be identified, the fewer reworks will be required. Nurmuliani et al., in their analysis of requirements volatility, found that change requests occur starting at the design phase [3]. This result indicates that at the design phase where the software architectural design is decided, it is possible to estimate the volatility of requirements from the software architectural design elements.
excessive requirements growth, but is not meant to be used to assess the volatility of the individual requirement. Lim et al. proposed a method to classify requirements into shearing layers in order to anticipate the volatility of the requirements [10]. However among the requirements in the same layer, it is unclear which is more volatile. The method lacks a metric which can be used to measure the volatility of individual requirements.
Software architectural design is a process to define software architecture, components, modules, interfaces and data for the software system, within constraints to satisfy the software requirements [11]. In this process, rather than developing from scratch, a project can adopt one of the well known and explicit architectural patterns depending on the domain of the system [12], [13]. Software architecture can also be selected by reusing the already trusted components providing functions for a specific domain, business application, user interface, or network and these components provide the framework for the software application [14].
Software requirement and software architecture are both the important elements to be considered in software development. However, since many software development organizations often make choice between them, in practice, requirement engineering and architectural design are intertwined activities. For instance, they are so reflected in the partial and simplified version of spiral model proposed as the twin peaks model [15]. The model, e.g. has been used to develop the security requirements and the architectural specifications concurrently [16]. The study shows that the requirement elicitation and architectural design activities should not be performed sequentially in a single phase within the development life cycle. Rather they should be woven together in an incremental approach. The result also implicitly suggests that a systematic process of requirement elicitation and architectural design which has the ability to be conducted incrementally should be developed.
Studies in adapting QFD in the domain of software development have also been conducted for quite a long time. Haag et al. stated that the adaptation of QFD in software development is a front-end requirements solicitation technique, adaptable to any software engineering methodology [17]. Hertzwurm et al. have given an overview of the state of the art of QFD in software development introducing several applications of QFD in software development [5], [6]. QFD application in software development bridges a gap between software developer and the customer. Instead of hoping for concrete targets formulated by customers, development can start with customer needs and transfer them to concrete product requirements, using the simple means of a systematic procedure. Gloger et al. described how QFD can be employed in analyzing software architecture [18]. The paper also indicates the effect of changes to the development time regarding the architectural design.
3
Proposed Method for Software Requirement Volatility Analysis
QFD provides a method to elicit and analyze customer needs and to transfer them to concrete product requirements. Furthermore, QFD application in software development provides a systematic procedure to transfer software requirements to software functions and subsequently to architectural design. However, due to the fact of requirement volatility, in order to minimize the impact of occurrence of changes during the development life cycle, we need to anticipate the changes by determining the requirement volatility in the early phase of software development.
The rationale of the proposed method is as follows. From the related studies we found that, it is difficult to identify the degree of volatility from the customer requirements themselves until the design phase where the software architectural design is decided. Considering that, if we could determine the degree of volatility of the architectural design elements, then by extracting the architectural design elements of the software product using the deployment tables from the QFD method, we could estimate the degree of volatility of the customer requirements from the degree of volatility of the architectural design elements.
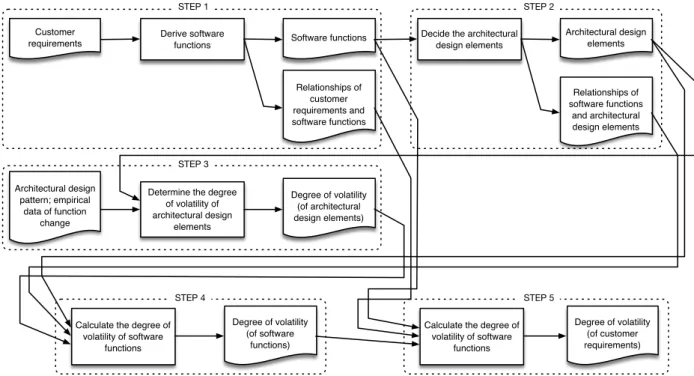
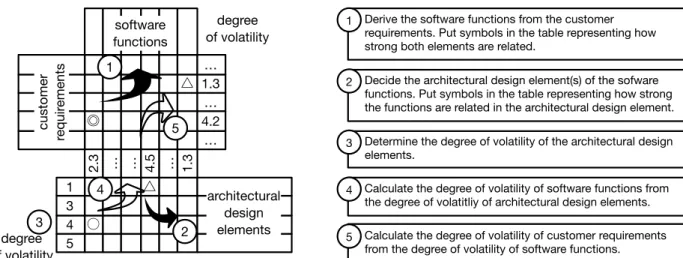
Figure 1 shows the flow diagram of the proposed method, and Figure 2 shows an illustration of the deployment tables, which are used in QFD, and the calculation of the value of the degree of volatility as the product of the proposed method. We have modified the deployment tables so that the degree of volatility can be calculated. The proposed method consists of 5 major steps. We describe each of these steps in the following sections.
Customer requirements
Derive software
functions Software functions
Relationships of customer requirements and software functions
Decide the architectural design elements
Architectural design elements
Relationships of software functions
and architectural design elements
Determine the degree of volatility of architectural design
elements Architectural design
pattern; empirical data of function
change
Degree of volatility (of architectural design elements)
Calculate the degree of volatility of software
functions
Degree of volatility (of software
functions)
Calculate the degree of volatility of software
functions
Degree of volatility (of customer requirements)
STEP 1 STEP 2
STEP 3
STEP 4 STEP 5
Figure 1.A diagram showing the steps to conduct the customer requirements volatility analysis using the
proposed method
3.1 STEP 1: Deployment of the Software Functions from the Customer Requirements
In STEP 1, from the given customer requirements, we derive the software functions which are needed to fulfill the customer requirements. In this step, we also define how strong the customer requirement is related to the derived software function. We decide how strong the relationship is by considering whether the software function has the main functionality or it just provides a supporting functionality, where the former will have a stronger relationship than the latter. The product of this step is the list of software functions and the relationships between the customer requirements and the software functions.
The input of this step is the customer requirements. For the purpose of simplicity, we assume we already have the list of customer requirements broken down into the lowest level of abstraction where we could then determine the software functions needed to fulfill the requirement. The guidance to derive the software functions from the customer requirements and their relationships is as follows:
• For each customer requirement, decide what software functions are needed to fulfill the
• One customer requirement may need more than one software function;
• But, each customer requirement must have at least one software function related to it;
• Different customer requirements may use the same software functions;
• Decide how strong the customer requirement is related to the derived software function. The
relationship is represented using a scale of numbers or symbols. In this paper, we use the symbol of “+”, “o” and “-” which each represents a strong, neutral or weak relationship, and has the value of 5, 3 and 1 respectively.
△ ◎ customer requir ements software functions △ ○ 1 3 4 degree of volatility
2.3 … … 4.5 … 1.3 … 1.3 … 4.2 … degree of volatility 1 4 5
Derive the software functions from the customer requirements. Put symbols in the table representing how strong both elements are related.
1 5 architectural design elements 2
Decide the architectural design element(s) of the sofware functions. Put symbols in the table representing how strong the functions are related in the architectural design element. 2
Calculate the degree of volatility of software functions from the degree of volatitliy of architectural design elements. 4
Calculate the degree of volatility of customer requirements from the degree of volatility of software functions. 5
symbols and numbers within the table are just for illustration
3
Determine the degree of volatility of the architectural design elements.
3
Figure 2.An illustration of the deployment tables and the calculation as the product of the proposed method
The output of this step is a two-dimensional table as illustrated in Figure 2. In the rows we place the customer requirements, in the columns we place the software functions, and within the table we place the relationships between those items.
The example of the two-dimensional table is shown in Table 1(a), which is composed of six customer requirements, r1 to r6, and seven software functions, f1 to f7, with their relationships within the table.
Table 1.A sample of obtaining the degree of volatility of customer requirements
(a)
f1 f2 f3 f4 f5 f6 f7
r1 + - 80 9.5
r2 + - 130 15.4
r3 o + - 115 13.6
r4 + o 170 20.1
r5 + + - 275 32.5
r6 + - o 75 8.9
Degree of Volatility
5 25 15 25 5 25 15
Degree of
Volatility ratio (%) 4.3 21.7 13.0 21.7 4.3 21.7 13.0 Software functions
Customer
requirements
Degree of Volatility Degree of Volatility ratio (%)
(b)
Data source Domain Presentation
f1 + 5 4.3
f2 + 25 21.7
f3 + 15 13.0
f4 + 25 21.7
f5 + 5 4.3
f6 + 25 21.7
f7 + 15 13.0
Degree of
Volatility 1 3 5 Architectural design elements
Degree of Volatility Degree of Volatility ratio (%)
3.2 STEP 2: Deployment of the Architectural Design Elements from the Software Functions
STEP 2 decides what are the architectural design elements which fit for each software function, as well as how strong is the cohesion of each function to the architectural design element. The product of this step is the list of architectural design elements and the relationships between software functions and architectural design elements.
In this step, we need to decide which architectural design pattern is used for the software. In this paper, we use the principal 3-layer architecture which consists of three layers: presentation, domain and data source [19]. The presentation layer provides functionalities to display information and capturing user input; the domain layer provides functionalities in the business logic; and the data source layer provides functionalities to communicate with the back-end services. This layering concept helps to structure applications that can be decomposed into groups of subtasks in which each group of subtasks is at a particular level of abstraction [12]. Layers are sorted vertically, from the lowest level of abstraction at the bottom to the highest level of abstraction at the top. The lower layer also has less potential for changes than those above it. In the 3-layer architecture, the presentation layer is on the top with the highest potential for changes and the data source layer is on the bottom with the lowest potential for changes. Previously, we have proposed a method of applying the layering concept to the software requirements analysis and architectural design [20]. We consider these layers as the elements of the architectural design to which the software functions will be mapped.
The input of this step is the list of software functions. The guidance to derive the architectural design elements from the software functions and their relationships is as follows:
• Map each of the software functions to the architectural design elements;
• Each software function may be related to more than one architectural design element;
• But, each software function must have at least one architectural design element related to it;
• Decide how the software function is related to the architectural design element: does a software
function have high or low cohesion within a given architectural design element. As in the software functions deployment table described in 3.1, the relationship is represented using a scale of numbers or symbols. In this paper, we use the symbol of “+”, “o” and “-” which each represents strong, neutral and weak relationship, and has the value of 5, 3 and 1 respectively.
The output of this step is a two-dimensional table as illustrated in Figure 2. In the columns we place the software functions, in the rows we place the architectural design elements, and within the table we place the relationships between those items.
The example of the two-dimensional table is shown in Table 1(b), which is composed of seven
software functions, f1 to f7, and three architectural design elements, data source, domain and
presentation, with their relationships within the table.
3.3 STEP 3: Determination of the Degree of Volatility of Architectural Design Elements
In STEP 3, for each architectural design element, we determine the degree of volatility, based on the architectural design pattern or based on empirical data of function change from the past software development projects. Again, we use scale numbers to represent the degree of volatility. In this paper, we use scale numbers from 1 to 5, where 1 represents the lowest degree of volatility and 5 the highest.
As illustrated in Figure 2, we place the values of the degree of volatility of architectural design elements in the rows of the architectural design elements deployment table.
architecture. Changes in this layer will impact on other layers above it. To minimize the impact of changes, changes in this layer (after the development at other layers has started) should be avoided or should be minimized. It implies the potential for changes or the degree of volatility of this data source element should be low. The other elements will have a higher degree of volatility. In this paper, we determine the degree of volatility of these data source, domain, and presentation elements as 1, 3, and 5 respectively as shown in the example in Table 1(b).
3.4 STEP 4: Calculation of the Degree of Volatility of Software Functions
After we have the values of the degree of volatility of each architectural design element, then in STEP 4, we calculate the values of the degree of volatility and their ratios for each of the software functions. The calculation is conducted by using the values representing the relationships between the software functions and the architectural design elements. The calculation is conducted in two steps as described below:
1. Calculate the value of the degree of volatility of the software functions using Equation 1. Ifpai
is the value of the degree of volatility of the architectural design elementai, and the relationship between the software functionfj and the architectural design elementaiisfaij, then the value of the degree of volatilitypfj for the software functionfjcan be calculated using the equation,
wherean is the number of architectural design elements.
pfj = an X
i=1
paifaij (1)
2. Calculate the ratio of the value of the degree of volatility of the software function using Equation 2. If pfj is the value of the degree of volatility of the software function fj, then the ratio of the degree of volatilityrpfj of the software functionfj can be calculated using the
equation, wherefn is the number of architectural design elements.
rpfj = pfj Pf n
j=1pfj
(2)
We may use the ratio in percentage by multiplying the ratio by 100.
This step may be skipped if we just want to calculate the degree of volatility of the requirements.
For instance, from the example shown in Table 1(b), where the “+” symbol has the value of
5, we can calculate the degree of volatility pf1 of the software function f1 using Equation 1:
pf1 = 1×5 + 3×0 + 5×0 = 5, and with the same manner for the degree of volatilitypf2 of the software functionf2:pf2 = 1×0 + 3×0 + 5×5 = 25. Furthermore, after we finished calculating all the software functions’ degree of volatility, we can calculate the ratio of the value of the degree of volatility of each of the software functions using Equation 2.
3.5 STEP 5: Calculation of the Degree of Volatility of Customer Requirements
The calculation is conducted in two steps as described below:
1. Calculate the value of the degree of volatility of the customer requirements using Equation 3. Ifpfj is the value of the degree of volatility of the software function fj, and the relationship between the customer requirementri and the software functionfj isrfij, then the value of the degree of volatilitypri for the customer requirementri can be calculated using the equation,
wherefn is the number of software functions.
pri = f n X
j=1
pfjrfij (3)
2. Calculate the ratio of the value of the degree of volatility of the customer requirement using Equation 4. Ifpri is the value of the degree of volatility of customer requirementri, then the
ratio of the degree of volatility rpri of customer requirement ri can be calculated using the
equation, wherern is the number of customer requirements.
rpri = Prnpri j=1prj
(4)
We may use the ratio as a percentage by multiplying the ratio by 100.
For instance, from the example showed in Table 1(a), we can calculate the degree of volatility
pr1of the customer requirementr1using Equation 3:pr1 = 5×0 + 25×0 + 15×5 + 25×0 + 5× 1 + 25×0 + 15×0 = 80, and with the same manner for the degree of volatilitypr2of the customer
requirementr2:pr2 = 5×0+25×5+15×0+25×0+5×1+25×0+15×0 = 130. Furthermore,
after we finished calculating all the customer requirements’ degree of volatility, we calculate the ratio of the value of the degree of volatility of each of the customer requirements using Equation 4 with the result as shown in the table.
After we obtain the degree of volatility of customer requirements (and the ratio of the degree of volatility), then we can use these values to analyze the volatility of the customer requirements. If the ratio is low, then the requirement may have a low potential for changes during the development
process. We may design the implementation of this requirement using astrictarchitectural design.
For instance, we may choose an architectural design which focuses on the performance rather than the extensibility using a high performance implementation design. But if the ratio is high, then it might be better to design the implementation of this requirement using aloosearchitectural design because the potential for changes in the future is high. For instance, the extensibility should be considered first instead of the performance when making a decision on the implementation design. Or, if the ratio is high, we can determine that the requirement needs to be clarified into more detailed requirements to anticipate changes in the future.
From the example shown in Table 1(a), we can see that the requirementr4 andr5 have a high
ratio of the degree of volatility while the requirement r1 and r6 have a low ratio of the degree of volatility.
4
A Case Study: New Student Online Admission System
admission was conducted manually. The applicant had to come to the nearest office of Statistics Indonesia located in the capital city of each province where the institute receives and processes the applications. Indonesia is a big country (about 250 million inhabitants) and the number of applicants is growing every year. To reduce the overall cost of the admission process and to give more opportunity to those who want to apply for admission, an online admission system has been proposed, developed and then started operating in the year 2010. We applied the proposed method to the requirements analysis of the admission system and evaluated the result of this method by investigating the real analysis, design, and implementation of the developed system.
Before we started the first step of the proposed method, we prepared the customer requirements by conducting the deployment of the customer requirements in two levels of abstraction. Table 2 shows the deployment of the customer requirements. We use the list in level 2 of the customer requirements as the input of the proposed method.
Table 2.Deployment of the customer requirements (excerpt)
CR ID Level 1 CR ID Level 2
CR1.1 Applicant enters his/her form online.
CR1.2 Applicant will get confirmation after registration online. CR2 Prerequisites for application are validated online before submitting
the application.
CR2.1 Prerequisites for application are validated online before submitting the application.
CR3.1 Applicant pays the submission fee via bank.
CR3.2 Application data will be reflected as payed after the payment. CR4 Applicant will get his/her admission ticket, online, after his/her
payment for the submission fee is confirmed.
CR4.1 Applicant will get his/her admission ticket, online, after his/her payment for the submission fee is confirmed.
CR5 Applicant will get the examination's result online on the scheduled date.
CR5.1 Applicant will get the examination's result online on the scheduled date.
CR6 Organizer can monitor online in a realtime the progress of submission.
CR6.1 Organizer can monitor online in a realtime the progress of submission.
CR7 Organizer can modify the individual data when requested by the applicant.
CR7.1 Organizer can modify the individual data when requested by the applicant.
CR8 Applicant can modify his/her own data before the payment for the submission fee is made.
CR8.1 Applicant can modify his/her own data before the payment for the submission fee is made.
CR9 Organizer enters the result of examination into the applicant's data by batch processing.
CR9.1 Organizer enters the result of examination into the applicant's data by batch processing.
CR10 Organizer can get or print the list of all applicants. CR10.1 Organizer can get or print the list of all applicants.
CR11 Organizer can get or print the list of all successful candidates. CR11.1 Organizer can get or print the list of all successful candidates. CR1 Applicant enters his/her form online and can get confirmation right
after.
CR3 Applicant pays the submission fee via bank and the bank's payment status will be automatically reflected to the application data.
Customer requirements
The first step, STEP 1, is to use the list of customer requirements and derive the software functions from them. We divide the product of this step into two tables, the deployment table of the software functions from the customer requirements and the table about the relationships between the customer requirements and the software functions. The former table is shown in Table 3 and the latter table is shown in Table 4. In Table 4, the software functions are shown using their ID which is shown in Table 3.
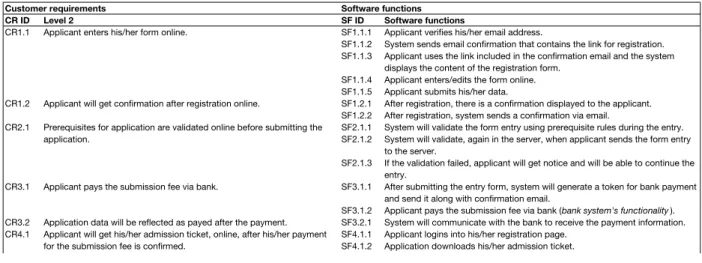
Table 3.Deployment of the software functions from the customer requirements (excerpt)
CR ID Level 2 SF ID Software functions
SF1.1.1 Applicant verifies his/her email address.
SF1.1.2 System sends email confirmation that contains the link for registration. SF1.1.3 Applicant uses the link included in the confirmation email and the system
displays the content of the registration form. SF1.1.4 Applicant enters/edits the form online. SF1.1.5 Applicant submits his/her data.
SF1.2.1 After registration, there is a confirmation displayed to the applicant. SF1.2.2 After registration, system sends a confirmation via email.
SF2.1.1 System will validate the form entry using prerequisite rules during the entry. SF2.1.2 System will validate, again in the server, when applicant sends the form entry
to the server.
SF2.1.3 If the validation failed, applicant will get notice and will be able to continue the entry.
SF3.1.1 After submitting the entry form, system will generate a token for bank payment and send it along with confirmation email.
SF3.1.2 Applicant pays the submission fee via bank (bank system's functionality). CR3.2 Application data will be reflected as payed after the payment. SF3.2.1 System will communicate with the bank to receive the payment information.
SF4.1.1 Applicant logins into his/her registration page. SF4.1.2 Application downloads his/her admission ticket. SF4.1.1 Applicant logins into his/her registration page. SF5.1.1 Applicant will see the examination's result. SF6.1.1 Organizer logins into the special site for organizer. SF6.1.2 Organizer views the list of submissions. SF6.1.1 Organizer logins into the special site for organizer.
SF7.1.1 Organizer selects the applicant by entering his/her submission number. SF7.1.2 Organizer edits the applicant's data.
SF7.1.3 Organizer submits the applicant's data. SF4.1.1 Applicant logins into his/her registration page. SF8.1.2 Applicant views his/her data.
SF1.1.4 Applicant enters/edits the form online. SF1.1.5 Applicant submits his/her data.
CR9.1 Organizer enters the result of examination into the applicant's data by SF9.1.1 Organizer, with its IT staff, imports the result of examination into the database. CR8.1 Applicant can modify his/her own data before the payment for the
submission fee is made.
CR6.1 Organizer can monitor online in a realtime the progress of submission.
CR7.1 Organizer can modify the individual data when requested by the applicant.
CR4.1 Applicant will get his/her admission ticket, online, after his/her payment for the submission fee is confirmed.
CR5.1 Applicant will get the examination's result online on the scheduled date. CR2.1 Prerequisites for application are validated online before submitting the
application.
CR3.1 Applicant pays the submission fee via bank.
Software functions Customer requirements
CR1.1 Applicant enters his/her form online.
CR1.2 Applicant will get confirmation after registration online.
From Table 3 we can see that some customer requirements are using the same software function to fulfill them. For instance, the CR1.1 “Applicant enters his/her form online” and CR8.1
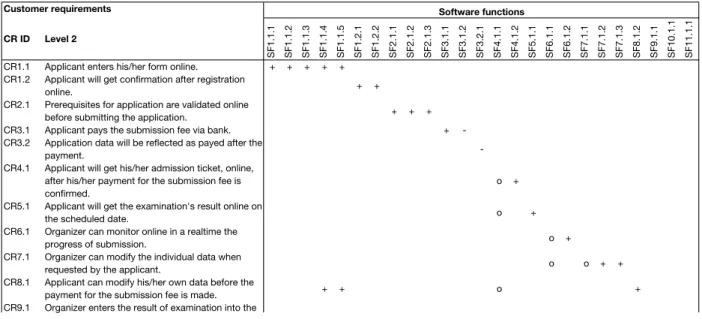
Table 4.Relationships between the customer requirements and the software functions (excerpt)
CR ID Level 2
SF1.1.1 SF1.1.2 SF1.1.3 SF1.1.4 SF1.1.5 SF1.2.1 SF1.2.2 SF2.1.1 SF2.1.2 SF2.1.3 SF3.1.1 SF3.1.2 SF3.2.1 SF4.1.1 SF4.1.2 SF5.1.1 SF6.1.1 SF6.1.2 SF7.1.1 SF7.1.2 SF7.1.3 SF8.1.2 SF9.1.1 SF10.1.1 SF11.1.1 CR1.1 Applicant enters his/her form online. + + + + +
CR1.2 Applicant will get confirmation after registration
online. + +
CR2.1 Prerequisites for application are validated online
before submitting the application. + + +
CR3.1 Applicant pays the submission fee via bank. +
-CR3.2 Application data will be reflected as payed after the
payment.
-CR4.1 Applicant will get his/her admission ticket, online, after his/her payment for the submission fee is confirmed.
o +
CR5.1 Applicant will get the examination's result online on
the scheduled date. o +
CR6.1 Organizer can monitor online in a realtime the
progress of submission. o +
CR7.1 Organizer can modify the individual data when
requested by the applicant. o o + +
CR8.1 Applicant can modify his/her own data before the
payment for the submission fee is made. + + o +
CR9.1 Organizer enters the result of examination into the
applicant's data by batch processing.
-CR10.1 Organizer can get or print the list of all applicants. o +
CR11.1 Organizer can get or print the list of all successful
candidates. o +
Customer requirements Software functions
“Applicant can modify his/her own data before the payment of the submission fee is made”, because both requirements are involving the function to edit the form online, they are using the same software function, the SF1.1.4 “Applicant enters/edits the form online”. In such a case, we only deploy the function “Applicant enters/edits the form online” once which is coded as SF1.1.4. In this case study, we have three more software functions which are used to fulfill multiple customer requirements.
From Table 4 we can see how a customer requirement is related to a software function. As described before, we use the symbol “+”, “o” and “-” which will be converted to a scale of numbers as 5, 3 and 1 respectively. For instance, the software function SF4.1.1 which provides functionality for applicant to login to his/her registration page provides only for supporting functionality because the applicant will go through other functions which have the main functionality.
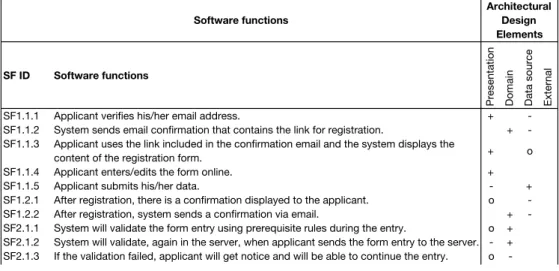
The next steps, STEP 2 and STEP 3, are to use the list of software functions and create a mapping table to the architectural design elements. In this case study, we use the 3-layer architecture which consists of data source, domain and presentation layers as the elements of the architectural design. In addition, from the derived software functions, we identify that there is an external system, the bank payment system, related to the main system. We have decided to treat this external system as an independent element of the architectural design. Table 5 shows the deployment table of the software functions to the architectural design elements.
As in the Step 1, the relationship between software functions and architectural design elements is decided by considering how strong the cohesion of the software function to the architectural design element is. This consideration is better conducted at the level of program design. For instance, for the software function SF1.1.1 “Applicant verifies his/her email address” is related to presentation layer and data source layer. Considering that the implementation of this function in the level of program design is mainly in the presentation layer, then we decided to give a strong relationship with the presentation layer. As for software function SF2.1.2 “System will validate, again in the server, when applicant sends the form entry to the server.”, we decided to give a strong relationship with the domain layer, because the function is mainly doing logical processing for validation.
Table 5.Deployment of the software functions to the architectural design elements
SF ID Software functions
Presentation Domain Data source External
SF1.1.1 Applicant verifies his/her email address. +
-SF1.1.2 System sends email confirmation that contains the link for registration. +
-SF1.1.3 Applicant uses the link included in the confirmation email and the system displays the
content of the registration form. + o
SF1.1.4 Applicant enters/edits the form online. +
SF1.1.5 Applicant submits his/her data. - +
SF1.2.1 After registration, there is a confirmation displayed to the applicant. o
-SF1.2.2 After registration, system sends a confirmation via email. +
-SF2.1.1 System will validate the form entry using prerequisite rules during the entry. o +
SF2.1.2 System will validate, again in the server, when applicant sends the form entry to the server. - +
SF2.1.3 If the validation failed, applicant will get notice and will be able to continue the entry. o
-SF3.1.1 After submitting the entry form, system will generate a token for bank payment and send it
along with confirmation email. +
-SF3.1.2 Applicant pays the submission fee via bank (bank system's functionality). +
SF3.2.1 System will communicate with the bank to receive the payment information. + - o
SF4.1.1 Applicant logins into his/her registration page. - +
SF4.1.2 Application downloads his/her admission ticket. + o
SF5.1.1 Applicant will see the examination's result. o +
SF6.1.1 Organizer logins into the special site for organizer. - o
SF6.1.2 Organizer views the list of submissions. o +
SF7.1.1 Organizer selects the applicant by entering his/her submission number. o +
SF7.1.2 Organizer edits the applicant's data. + o
SF7.1.3 Organizer submits the applicant's data. - +
SF8.1.2 Applicant views his/her data. o +
SF9.1.1 Organizer, with its IT staff, imports the result of examination into the database. +
SF10.1.1 Organizer download the list of all applicants. + o
SF11.1.1 Organizer download the list of all successful candidates. + o
Software functions
Architectural Design Elements
Table 6.Calculation of the degree of volatility of the software functions from the degree of volatility of the
architectural design elements (excerpt)
SF ID Software functions
Presentation Domain Data source External
SF1.1.1 Applicant verifies his/her email address. + - 26.0 5.7 SF1.1.2 System sends email confirmation that contains the link for registration. + - 16.0 3.5 SF1.1.3 Applicant uses the link included in the confirmation email and the system displays the
content of the registration form. + o 28.0 6.2 SF1.1.4 Applicant enters/edits the form online. + 25.0 5.5 SF1.1.5 Applicant submits his/her data. - + 10.0 2.2 SF1.2.1 After registration, there is a confirmation displayed to the applicant. o - 16.0 3.5 SF8.1.2 Applicant views his/her data. o + 20.0 4.4 SF9.1.1 Organizer, with its IT staff, imports the result of examination into the database. + 5.0 1.1 SF10.1.1 Organizer downloads the list of all applicants. + o 18.0 4.0 SF11.1.1 Organizer downloads the list of all successful candidates. + o 18.0 4.0
Degree of Volatility 5 3 1 2
Software functions
Architectural Design Elements
Degree of Volatility Degree of Volatility ratio (%)
... ... ... ...
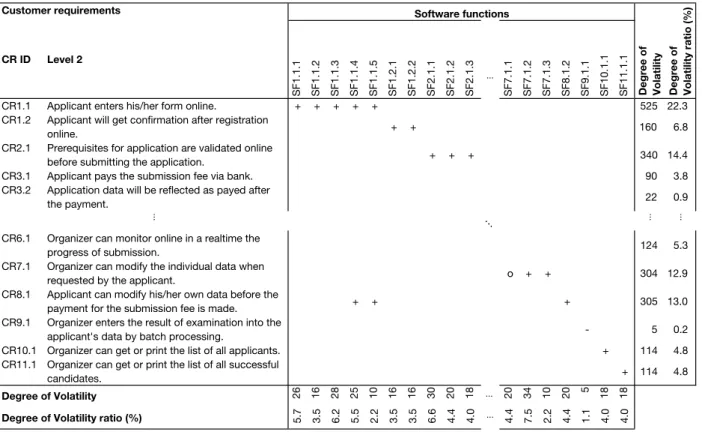
Table 7.Calculation of the degree of volatility of the customer requirements from the degree of volatility of the software functions (excerpt)
CR ID Level 2
SF1.1.1 SF1.1.2 SF1.1.3 SF1.1.4 SF1.1.5 SF1.2.1 SF1.2.2 SF2.1.1 SF2.1.2 SF2.1.3 SF7.1.1 SF7.1.2 SF7.1.3 SF8.1.2 SF9.1.1 SF10.1.1 SF11.1.1
CR1.1 Applicant enters his/her form online. + + + + + 525 22.3
CR1.2 Applicant will get confirmation after registration
online. + + 160 6.8
CR2.1 Prerequisites for application are validated online
before submitting the application. + + + 340 14.4
CR3.1 Applicant pays the submission fee via bank. 90 3.8
CR3.2 Application data will be reflected as payed after
the payment. 22 0.9
Degree of Volatility ratio (%)
Customer requirements Software functions
Degree of Volatility
… CR6.1 Organizer can monitor online in a realtime the
progress of submission. 124 5.3
CR7.1 Organizer can modify the individual data when
requested by the applicant. o + + 304 12.9
CR8.1 Applicant can modify his/her own data before the
payment for the submission fee is made. + + + 305 13.0
CR9.1 Organizer enters the result of examination into the
applicant's data by batch processing. - 5 0.2
CR10.1 Organizer can get or print the list of all applicants. + 114 4.8
CR11.1 Organizer can get or print the list of all successful
candidates. + 114 4.8
26 16 28 25 10 16 16 30 20 18 20 34 10 20 5 18 18
5.7 3.5 6.2 5.5 2.2 3.5 3.5 6.6 4.4 4.0 4.4 7.5 2.2 4.4 1.1 4.0 4.0
Degree of Volatility ratio (%) Degree of Volatility
... ... ...
...
...
...
5
Discussion
In this paper, we proposed a method to conduct analysis of software requirements volatility. By employing the QFD method, we can transfer the software requirements to the software functions and subsequently to the architectural design elements. Then, after determining the degree of volatility of the architectural design elements, the degree of volatility of the software functions and the degree of volatility of the software requirements can be obtained subsequently.
From the case study, we successfully used the proposed method to obtain the degree of volatility of the requirements. These values can be used to judge the potential for changes of an individual requirement and make any necessary countermeasure and/or precaution in order to anticipate the changes. And because all these steps can be conducted in the early phase of software development, the requirement which has the potential to change can be assessed even before the actual implementation or design phases have started.
Compared to Lim et al. proposed method [10], our proposed method also gives the result of the degree of volatility for the individual requirements, giving more fine-grained anticipation to the individual requirements change.
6
Conclusion
A previous study reported that software requirements volatility cannot be determined until the phase of software design. This indicates that at the design phase where the software architectural design is decided, it is possible to estimate the requirements volatility from the software architectural design elements. QFD is used in software development to transfer the software requirements to software functions and subsequently to architectural design. However, the QFD method and its current studies do not take the potential for changes into consideration.
In this paper, we proposed a systematic method based on QFD to conduct analysis of software requirements volatility. By employing the method, we can obtain the degree of volatility of the software requirements. From the case study we confirmed that the values of the degree of volatility of the software requirements obtained using the proposed method represent the requirements volatility. Knowing the requirements volatility in the early phase of software development before the actual design and implementation phases enables us to anticipate the future changes and take appropriate action.
The proposed method described in this paper only uses the architectural design elements as the factor to estimate the volatility of software requirements. We plan to study the impact of change analysis as well as the risk management to refine the result of the estimation.
References
[1] H. Dev and R. Awasthi, “A Systematic Study of Requirement Volatility During Software Development Process,” International Journal of Computer Science Issues, vol. 9, no. 2, pp. 527–533, 2012.
[2] D. Zowghi and N. Nurmuliani, “A Study of the Impact of Requirements Volatility on Software Project Performance,” in Proceedings of the Ninth Asia-Pacific Software Engineering Conference (APSEC’02), 2002, pp. 3–11. [Online]. Available: https://doi.org/10.1109/APSEC.2002.1182970
[3] N. Nurmuliani, D. Zowghi and S. Powell, “Analysis of Requirements Volatility During Software Development Life Cycle,” in Proceedings of the 2004 Australian Software Engineering Conference (ASWEC’04), 2004, pp. 28–37. [Online]. Available: http://dx.doi.org/10.1109/ASWEC.2004.1290455
[4] Japanese Standards Association, “JIS Q 9025:2003 Performance Improvement of Management Systems – Guidelines for Quality Function Deployment,” 2003. [Online]. Available: http://www.webstore.jsa.or.jp/webstore/Com/FlowControl.jsp?lang=en&bunsyoId=JIS+ Q+9025%3A2003&dantaiCd=JIS&status=1&pageNo=0
[5] G. Herzwurm, S. Schockert and W. Pietsch, “QFD for Customer-Focused Requirements Engineering,” in Proceedings of the 11th IEEE International Requirements Engineering Conference, 2003, pp. 330–338. [Online]. Available: https://doi.org/10.1109/ICRE.2003.1232777
[6] G. Herzwurm, S. Schockert and T. Tauterat, “Quality Function Deployment in Software Development -State-of-the-art-,” in Proceedings of the 21th International Symposium on Quality Function Deployment, 2015.
[7] S. Ferreira, J. Collofello, D. Shunk and G. Mackulak, “Understanding the Effects of Requirements Volatility in Software Engineering by Using Analytical Modeling and Software Process Simulation,” Journal of Systems and Software, vol. 82, no. 10, pp. 1568–1577, 2009. [Online]. Available: http://dx.doi.org/10.1016/j.jss.2009.03.014
[9] G. Kulk and C. Verhoef, “Quantifying Requirements Volatility Effects,” Science of Computer Programming, vol. 72, no. 3, pp. 136–175, 2008. [Online]. Available: https://doi.org/10.1016/j.scico. 2008.04.003
[10] S. L. Lim and A. Finkelstein, Anticipating Change in Requirements Engineering. Springer Berlin Heidelberg, 2011, pp. 17–34. [Online]. Available: http://dx.doi.org/10.1007/978-3-642-21001-3 3
[11] ISO/IEC and IEEE, “ISO/IEC/IEEE 24765:2010 - Systems and Software Engineering – Vocabulary,” vol. 2010, p. 410, 2010. [Online]. Available: http://www.iso.org/iso/catalogue detail.htm?csnumber= 50518
[12] F. Bushmann, R. Meunier, H. Rohnert, P. Somerlad and M. Stal, Pattern-Oriented Software Architecture: A System of Patterns. John Wiley & Sons, 2001.
[13] M. Fowler, D. Rice, M. Foemmel, E. Hieatt, R. Mee and R. Stafford, Patterns of Enterprise Application Architecture. Addison Wesley, 2002.
[14] T. Kishi, N. Noda and Y. Fukasawa, Software Architecture (in Japanese). Kyoritsu Shuppan, 2005. [Online]. Available: http://www.kyoritsu-pub.co.jp/bookdetail/9784320027770
[15] B. Nuseibeh, “Weaving the Software Development Process Between Requirements and Architectures,” in Proceedings of the 23rd International Conference on Software Engineering, International Workshop on Software Requirements to Architectures, 2001.
[16] C. Schmitt and P. Liggesmeyer, “Getting Grip on Security Requirements Elicitation by Structuring and Reusing Security Requirements Sources,” Complex Systems Informatics and Modeling Quarterly, no. 3, pp. 15–34, 2015. [Online]. Available: http://dx.doi.org/10.7250/csimq.2015-3.02
[17] S. Haag, M. K. Raja and L. L. Schkade, “Quality Function Deployment Usage in Software Development,” Commun. ACM, vol. 39, no. 1, pp. 41–49, 1996. [Online]. Available: http://dx.doi.org/10.1145/234173.234178
[18] M. Gloger, S. Jockusch and N. Weber, “Using QFD for Assessing and Optimizing Software Architectures the System Architecture Analysis Method,” in Proceedings of the 5th International Symposium on Quality Function Deployment, 1999, pp. 119–127. [Online]. Available: http://www.tarrani.net/QFDinSAA.final.pdf
[19] K. Brown, G. Craig, G. Hester, D. Pitt, R. Stinehour, M. Weitzel, J. Amsden, P. M. Jakab and D. Berg, Enterprise Java Programming with IBM WebSphere. Addison Wesley, 2001.