ORIGINAL RESEARCH ARTICLE
Nutritional Factors Related to Male Fertility: Turkish Sample
DOI: 10.29063/ajrh2020/v24i2.8
Teslime Ö Yörüsün
1*, Yasemin Akdevelioğlu
1, Recep O Karabacak
2, Nuray Bozkurt
2, Nevin
Şanlıer
3, Süleyman Yeşil
4and Seyhan Gümüşlü
5Department of Nutrition and Dietetics, Gazi University, Faculty of Health Science, Ankara, Turkey1; Department of Obstetrics and Gynecology, Gazi University, Faculty of Medicine, Ankara, Turkey2; Department of Nutrition and Dietetics, Ankara Medipol University, Faculty of Health Science, Ankara, Turkey3; Department of Urology, Gazi University, Faculty of Medicine, Ankara, Turkey4; IVF Unit, Gazi University Faculty of Medicine, Ankara, Turkey5
*For Correspondence: Email: [email protected]; Phone: +905308343603
Abstract
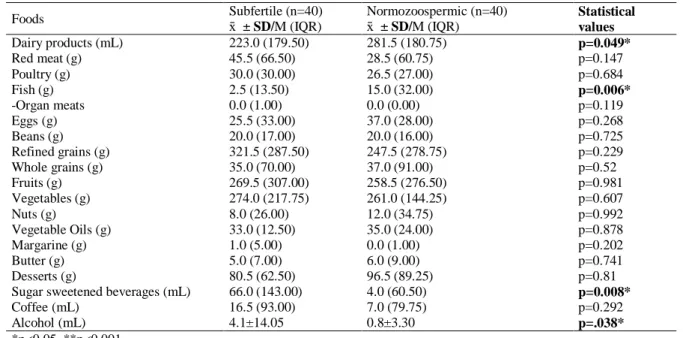
This study aimed to investigate the difference between infertile men and healthy (normozoospermic) men in terms of demographic characteristics, dietary habits, anthropometric measurements, and body composition. We included 80 males (40 subfertile and 40 healthy normozoospermic) between the ages of 25 and 54 years. Information was obtained from the participants regarding their socio-demographic characteristics, health status, dietary habits, and food intake. Food frequency questionnaires, food records, anthropometric measurements, body composition, and sperm analysis were statistically evaluated using IBM SPSS Statistics 20 programme. The findings of this study showed that the mean BMI of the subfertile group was significantly higher than that of the normozoospermic group. The frequency of eating out was significantly higher in the subfertile group than in the normozoospermic group. It was also determined that the consumption of fish was significantly lower; in contrast, consumption of sugar sweetened beverages, and alcohol was significantly higher in the subfertile group than in the normozoospermic group. Moreover, it was found that sugar sweetened bevareges, red meat, organ meats consumption are negatively; and that fish, egg, nut consumption are positively correlated with sperm parameters. In summary, in men receiving infertility treatment, excessive consumption of meat and sugary drinks should be considered cautiously. However, fish, nuts and eggs consumption should be provided in line with the nutrition guidelines. (Afr J Reprod Health 2020; 24[2]: 85-95).
Keywords: Subfertile, nutrition, reproductive health, food intake, Turkey
Résumé
Cette étude visait à étudier la différence entre les hommes infertiles et les hommes sains (normozoospermiques) en termes de caractéristiques démographiques, d'habitudes alimentaires, de mesures anthropométriques et de composition corporelle. Nous avons inclus 80 hommes (40 sous-fertiles et 40 normozoospermiques sains) âgés de 25 à 54 ans. Les participants ont obtenu des informations concernant leurs caractéristiques sociodémographiques, leur état de santé, leurs habitudes alimentaires et leur apport alimentaire. Les questionnaires de fréquence des aliments, les enregistrements des aliments, les mesures anthropométriques, l a composition corporelle et l'analyse du sperme ont été évalués statistiquement à l'aide du programme IBM SPSS Statistics 20. Les résultats de l'étude ont montré que l'IMC moyen du groupe sous-fertile était significativement plus élevé que celui du groupe normozoospermique. La fréquence des repas au restaurant était significativement plus élevée dans le groupe sous-fertile que dans le groupe normozoospermique. Il a également été déterminé que la consommation de poisson était nettement inférieure; en revanche, la consommation de sucre, de boissons sucrées et d'alcool était significativement plus élevée dans le groupe sous-fertile que dans le groupe normozoospermique. De plus, il a été constaté que les boissons sucrées sucrées, la viande rouge, la consommation de viandes d'organes sont négativement; et que la consommation de poisson, d'œuf et de noix est en corrélation positive avec les paramètres du sperme. En résumé, chez les hommes recevant un traitement contre l'infertilité, une consommation excessive de viande et de boissons sucrées doit être considérée avec prudence. Cependant, la consommation de poisson, de noix et d'œufs doit être fournie conformément aux directives nutritionnelles. (Afr J Reprod Health 2020; 24[2]: 85-95).
Introduction
Fertility is defined as the capacity to conceive a child whereas infertility refers to the non-occurrence of pregnancy despite regular sexual intercourse for one year1–3 . According to World Health Organization data, 25% of couples in developing countries experience infertility1. It is also reported that in approximately 50% of these couples, men are infertile4.
One of the most important steps in the evaluation of infertility in males is to determine sperm quality through sperm analysis5. The findings of various recent studies have led to debates as to whether sperm quality has decreased or remained unchanged6–8. Although studies have been conducted with heterogeneous populations, it has been reported that sperm concentration has reduced, especially in western societies9,10. According to the results of a meta-analysis study examining research on sperm quality from 20 countries, the results of 61 studies conducted in approximately 20 countries between 1938 and 1990 indicated that the volume of semen, which was 3.40 mL in 1940, fell to 2.75 mL in 1990. Sperm concentrations were also found to decrease from 113x106 /mL to 66x106 /mL during the same period9.
It was also reported that 7.5% of men with sexual experience (3.3-4.7 million) consulted fertility specialists and 18% of these men were infertile4. Factors that reduce fertility in men include sexual factors, urogenital infections, congenital anomalies, varicocele, endocrine disorders, immunological factors, and idiopathic sperm disorders11. The sperm analysis of infertile men revealed a decrease in the sperm count
(oligospermia) and sperm motility
(asthenozoospermia) in normal morphology (teratozoospermia). Usually, these abnormalities are combined, and this condition is called oligo-astheno-teratozoospermia (OAT) syndrome1. Certain factors such as genetics, endocrine, congenital, intrauterine (i.e., smoking during pregnancy), age, smoking, alcohol consumption, occupational exposure, physical activity, and nutritional status affect sperm quality. There is evidence that an adequate and balanced diet plays an important role in improving sperm quality12,13.
Many studies which examine the relationship between nutrition and sperm quality stressed the importance of the intake of vitamins A, C, E, in addition to folate as well as zinc in the form of supplements while very few studies focused on the effect of dietary patterns or nutrient groups. It was reported that the consumption of processed and fatty meat products14–16, dairy products17,18, and sugary foods19,20 reduce sperm quality whereas the consumption of fruits and vegetables16,18,19,21, whole grain cereals in addition to whole grain products16,21, lean or low-fat dairy products17–19,22, along with fish and poultry15,19,21 increase sperm quality. Another factor determined to be effective on male infertility is body weight. The effects of being overweight on sperm production are as follows: changes in the hypothalamic-pituitary-gonad (HHG) axis, increased testicular temperature due to increased abdominal and testicular fat deposits, increased accumulation of fat-soluble endocrine disruptors due to increased fat tissue, increased insulin resistance and increased systemic inflammation, in addition to DNA fragmentation23 . The fact that no study has been conducted in Turkey to investigate the effect of nutrition on sperm parameters was one of the prioritized reasons of the planning of this study. The present study was conducted to investigate the relationship among general dietary habits, dietary patterns, dietary macro and micronutrients, body composition, along with the physical activity levels of Turkish males with their sperm parameters in relation with their food.
Methods
Research design
male patients (40 subfertile, 40 normozoospermic) who consulted the IVF Center in the Gazi University Faculty of Medicine in Ankara, Turkey. The subfertile group was defined by males with a semen volume of <1.5 mL, total sperm count of <39x106/ejaculate, sperm concentration of <15x106/mL, sperm motility of (PR+NP) <40%, and progressive motility of <32%24. The normozoospermic group included males who consulted the same center due to female sub-fertility and had sperm parameters above WHO semen analysis reference values. Subjects provided at least two semen samples after an
abstinence period of 3–5 days. Analyses of samples were done following WHO
criteria24.
We included subjects who were between the ages of 19-55, married, and not having consulted any hospitals due to azoospermia complaints. We excluded patients who showed a clinical history of varicocele, cryptorchid or endocrine hypogonadism (abnormal hormonal
levels), azospermia, chemotherapy or
radiotherapy, anomalies in the karyotype, Y chromosome microdeletions, and any chronic diseases. All subjects were required to provide written informed consent prior to participation through signing a document that was approved by the ethics committee.
The researcher collected the data through a questionnaire conducted in face-to-face interviews with the participants. The questionnaire consisted of 9 parts: questions related to socio-demographic characteristics and general health, fertility and eating habits, anthropometric measurements, a short international physical activity questionnaire (IPAQ) form, a food intake form, and a food consumption frequency form. In addition to the questionnaire, the spermiogram results of both groups (subfertile and normozoospermic) were obtained from the IVF Center at the Gazi University Faculty of Medicine. The questionnaire included questions about age, educational status, employment status, place of residence (urban, rural), smoking and alcohol consumption status, in
addition to chronic disease status. Chronic diseases were one of the exclusion
criteria.
Evaluation of dietary habits
To obtain information about the dietary habits of the participants, questions about general dietary habits, food consumption records, and a food frequency questionnaire were used. This section of the questionnaire, which deals with general eating habits, includes questions about main meals and snacks, skipping meals, in addition to the frequency of eating out. To determine the nutritional habits of the participants, the researcher conducted face -to- face food frequency questionnaire interviews with the participants to find out whether the participants consumed dairy products, meat-eggs-legumes, vegetable-fruit, bread-cereal, fat, sugar, and sugary foods. The participants were given instructions on how to fill in the food intake form and were asked to record their 3-day (two days on weekdays and one day on the weekend) food consumption. The number of nutrients and beverages consumed by the participants was converted into daily consumption amounts. The amounts of nutrients in foods and beverages consumed by the patients were calculated using "Standard Recipes"25 and/or "Examples from the Turkish Cuisine"26. Daily intake of energy and nutrients were analyzed using the computer aided nutrition program ―Nutrition Information Systems Package Program (BEBIS)‖ developed for Turkey.
Evaluation of anthropometric measurements We performed the anthropometric measurements (body weight and composition, height, BMI, weight, in addition to hip circumference) of the participants using the devices in the anthropometry laboratory of the Gazi University Faculty of Health Sciences, Department of Nutrition and Dietetics. Body weight (kg), total body fat (%), total body water (%), lean body mass, (kg) and visceral adiposity index were measured using the
TANITA BC532 brand body composition
analyzer27. The body mass index (BMI) values of the participants were calculated by the body weight (kg)/ [height (m)2 equation. According to the BMI classification made by the World Health
Organization (WHO), BMI below 18.50 kg/ m2 is considered to be ―underweight‖, 18.50-24.99
kg/m2 ―normal weight‖, 25.00-29.99 kg/m2 ―overweight‖, 30.00-34.99 kg/m2
35.00-39.99 kg/m2 ―obese class II‖, and 40.00 kg/m2 and above ―obese class III‖. In this study, obesity was not graded, and participants with a BMI of 30.00 kg/m2 and above were classified as obese28.
Statistical analyses
Statistical analyses were performed using SPSS (IBM SPSS Statistics 20). The Shapiro-Wilks test was performed to determine whether the continuous variables had a normal distribution. Parametric methods were used for the measurement values that are suitable for normal distribution. By parametric methods, the Independent Sample-t-test was used to compare the measurement values of the two independent groups. Nonparametric methods were used for the measured values which were not suitable for normal distribution. Per non-parametric methods, the Mann-Whitney U test was used to compare the measured values of two independent groups. Spearman‘s correlation coefficient was used to examine the relationship between two quantitative variables which do not have a normal distribution. The χ2-cross-tabulation was used according to the expected value levels to explore the relationships between the two qualitative variables29.
Results
The present study was carried out with a total of 80 volunteer males (40 subfertile, 40 normozoospermic males) between the ages of 19-55. The mean age of the participants in the subfertile and normozoospermic groups was 34.7 ± 5.6 and 34.7 ± 6.0, respectively (p>0.05). Of the participants in the subfertile group, 12.5% were secondary school graduates, 27.5% high school graduates, and 60% university graduates. In the normozoospermic group, these ratios were 10%, 35% and 55%, respectively. Concerning place of residence, 20% of the participants in the normozoospermic group and 7.5% of the participants in the subfertile group were living in rural areas (p<0.05). Another difference between these two groups is that alcohol consumption was significantly higher in the subfertile group (p<0.05).The BMI of normozoospermic males was
found to be 26.6 ± 3.0 kg/m2 while that of the subfertile group was 28.2±4.0 kg/m2 (p<0.05) (Table 1). Also, while 32.5% of the subfertile participants were in the obese group, only 10% of the participants in the normozoospermic group were in the obese group (p<0.05). No significant difference was found between the two groups concerning other anthropometric measurements other than BMI.
The sperm concentration, total sperm count, sperm motility, and progressive sperm motility in addition to rapid progressive sperm motility were lower in the subfertile group than in
the normozoospermic group (p<0.05). Subfertile males did not have rapid progressive
motility.
When the general eating habits of the participants were examined, significant differences were found between the subfertile group and the normozoospermic group in terms of the frequency of eating out and the consumption of fatty red meat products. The frequency of eating out was 16.7±15.4 times a month in the subfertile group
and 9.4±10.7 times a month in the
normozoospermic group (Z=-2.313; p<0.05). Also, high-fat meat product preference rates were higher
in subfertile males (20%) than in
normozoospermics (5%) (χ2=4.320; p<0.05). Significant differences were not found between the intake of macronutrients and sperm parameters. However, the intake of dietary folic acid and vitamin C, which were among micronutrients, was respectively found to be 209.8±89.9 µg and 180.8±102.7 mg in the normozoospermic group, and 174.7±52.8 µg as well as 138.6±65.8 mg in the subfertile group (p<0.05) (Table 3).
Table 1: Anthropometric characteristics of subfertile and normospermic men in Ankara, Turkey (mean, standard deviation, median, interquartile range)
Anthropometric characteristics
Subfertile (n=40) Normozoospermic (n=40)
Statistical values ± SD/M (IQR) ± SD/M (IQR)
Weight (kg) 84.3 (13.50) 82.5 (13.33) p= 0.290
Body mass index (kg/m2) 28.2±4.00 26.6±3.03 p=0.045*
Total body fat (%) 24.1±5.25 22.4±4.72 p= 0.148
Fat-free mass (kg) 60.5 (8.25) 58.5 (8.33) p= 0.567
Waist circumference (cm) 94.5 (12.25) 94.0 (12.75) p= 0.447
*p<0.05, **p<0.001
Table 2: Comparisons of daily micronutrients and caffeine intake (x SD, M (IQR)) of subfertile and normospermic men in Ankara, Turkey
Micronutrients Subfertile (n=40) Normozoospermic (n=40) Statistical values D/M (IQR) D M (IQR)
Vitamin A (µg) 1044.1 (608.13) 1228.42 (881.51) p=0.138
Vitamin E (mg) 23.2 (12.45) 24.0 (16.22) p=0.893
Vitamin K (µg) 470.1 (209.26) 561.9 (359.50) p=0.191
Vitamin B1 (mg) 1.0 (0.28) 1.1 (0.71) p=0.290
Vitamin B2 (mg) 1.4 (0.40) 1.5 (0.55) p=0.450
Niacin (mg) 30.1 (12.70) 33.2 (14.01) p=0.482
Vitamin B6 (mg) 1.9 (0.52) 1.7 (1.07) p=0.920
Folate (µg) 174.6±52.85 209.8±89.88 p=.037*
Vitamin B12 (µg) 4.5 (2.59) 4.6 (3.35) p=0.935
Vitamin C (mg) 138.6±65.88 180.7±102.72 p=0.033*
Sodium (mg) 2259.8 (976.99) 2529.3 (1024.52) p=0.089
Potassium (mg) 2988.5 (766.15) 2873.1 (1728.66) p=0.939
Calcium (mg) 673.8 (315.75) 729.3 (264.69) p=0.207
Magnesium (mg) 333.8 (84.28) 340.2 (166.21) p=0.554
Phosphorus (mg) 1316.8 (330.26) 1358.6 (497.78) p=0.577
Iron (mg) 15.3 (5.22) 14.1 (7.63) p=0.610
Zinc (mg) 11.5 (2.86) 11.4 (4.37) p=0.655
Caffeine (mg) 7.8±15.14 5.3±12.82 p=0.424
*p<0.05, **p<0.001
Table 3: Comparisons of daily food group intake (x SD, M (IQR)) of subfertile and normospermic men in Ankara, Turkey
Foods Subfertile (n=40) Normozoospermic (n=40) Statistical
values
x ± SD/M (IQR) x ± SD/M (IQR)
Dairy products (mL) 223.0 (179.50) 281.5 (180.75) p=0.049*
Red meat (g) 45.5 (66.50) 28.5 (60.75) p=0.147
Poultry (g) 30.0 (30.00) 26.5 (27.00) p=0.684
Fish (g) 2.5 (13.50) 15.0 (32.00) p=0.006*
-Organ meats 0.0 (1.00) 0.0 (0.00) p=0.119
Eggs (g) 25.5 (33.00) 37.0 (28.00) p=0.268
Beans (g) 20.0 (17.00) 20.0 (16.00) p=0.725
Refined grains (g) 321.5 (287.50) 247.5 (278.75) p=0.229
Whole grains (g) 35.0 (70.00) 37.0 (91.00) p=0.52
Fruits (g) 269.5 (307.00) 258.5 (276.50) p=0.981
Vegetables (g) 274.0 (217.75) 261.0 (144.25) p=0.607
Nuts (g) 8.0 (26.00) 12.0 (34.75) p=0.992
Vegetable Oils (g) 33.0 (12.50) 35.0 (24.00) p=0.878
Margarine (g) 1.0 (5.00) 0.0 (1.00) p=0.202
Butter (g) 5.0 (7.00) 6.0 (9.00) p=0.741
Desserts (g) 80.5 (62.50) 96.5 (89.25) p=0.81
Sugar sweetened beverages (mL) 66.0 (143.00) 4.0 (60.50) p=0.008*
Coffee (mL) 16.5 (93.00) 7.0 (79.75) p=0.292
Alcohol (mL) 4.1±14.05 0.8±3.30 p=.038*
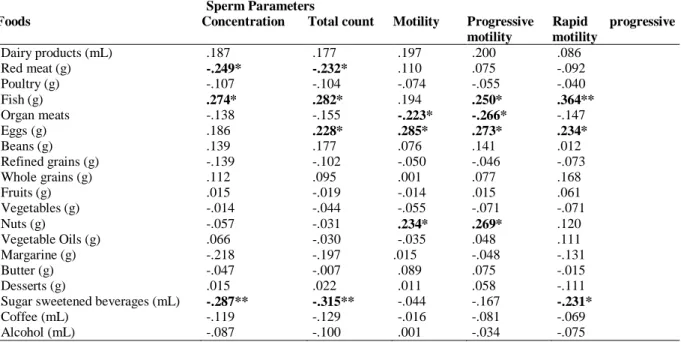
Table 4: Correlation between daily amount of food consumption and sperm parameters
Sperm Parameters
Foods Concentration Total count Motility Progressive motility
Rapid progressive motility
Dairy products (mL) .187 .177 .197 .200 .086
Red meat (g) -.249* -.232* .110 .075 -.092
Poultry (g) -.107 -.104 -.074 -.055 -.040
Fish (g) .274* .282* .194 .250* .364**
Organ meats -.138 -.155 -.223* -.266* -.147
Eggs (g) .186 .228* .285* .273* .234*
Beans (g) .139 .177 .076 .141 .012
Refined grains (g) -.139 -.102 -.050 -.046 -.073
Whole grains (g) .112 .095 .001 .077 .168
Fruits (g) .015 -.019 -.014 .015 .061
Vegetables (g) -.014 -.044 -.055 -.071 -.071
Nuts (g) -.057 -.031 .234* .269* .120
Vegetable Oils (g) .066 -.030 -.035 .048 .111
Margarine (g) -.218 -.197 .015 -.048 -.131
Butter (g) -.047 -.007 .089 .075 -.015
Desserts (g) .015 .022 .011 .058 -.111
Sugar sweetened beverages (mL) -.287** -.315** -.044 -.167 -.231*
Coffee (mL) -.119 -.129 -.016 -.081 -.069
Alcohol (mL) -.087 -.100 .001 -.034 -.075
*p<0.05, **p<0.01
Discussion
Our study suggests that semen quality may be influenced by nutritional factors. As a result of this study planned to evaluate the relationship between nutritional status and fertility in Turkish men, we found that sperm parameters were negatively affected by the daily consumption of red meat, offal, in addition to sugar sweetened beverages and positively affected by fish, egg, and nut consumption. In addition, the daily folic acid and vitamin C intake of subfertile individuals was found to be significantly lower than that of normozoospermics.
Male infertility often manifests itself as a deterioration in the sperm parameters. In the present study, sperm concentration (7.8 ± 9.18106 /mL) and sperm motility (43.7±18.82%) in the subfertile group were found to be significantly lower than those in the normozoospermic group (46.7 ± 22.82 106 /mL and 68.1±11.30%, respectively) (p<0.001). A study conducted in Spain reported similar findings: sperm concentrations (3.3 ± 4.1 106 /mL) and sperm motility of the subfertile group (27.4 ± 18.6%) were found to be significantly lower than those of the normozoospermic group (39.5 ± 14.6 106 /mL,
and 52.2 ± 12.3%, respectively) (p<0.05)18. Although WHO reference values do not include rapid progressive motility, in this study, subfertile males did not have rapid progressive motility. Studies on this subject show that rapid progressive motility is a crucial fertility factor30.
Environmental differences in rural and urban areas (air and water quality, stress, etc.) may also affect fertility31. In this study, the ratio of subfertile participants who lived in urban areas was higher than that of normozoospermic participants. In the study in Paris, Auger et al.
found that the sperm count decreased over the years. However, in a similar study conducted in Toulouse, a rural area, it was concluded that the sperm count did not decrease over the years31. The results from these two studies demonstrate the effect of environmental factors on sperm quality.
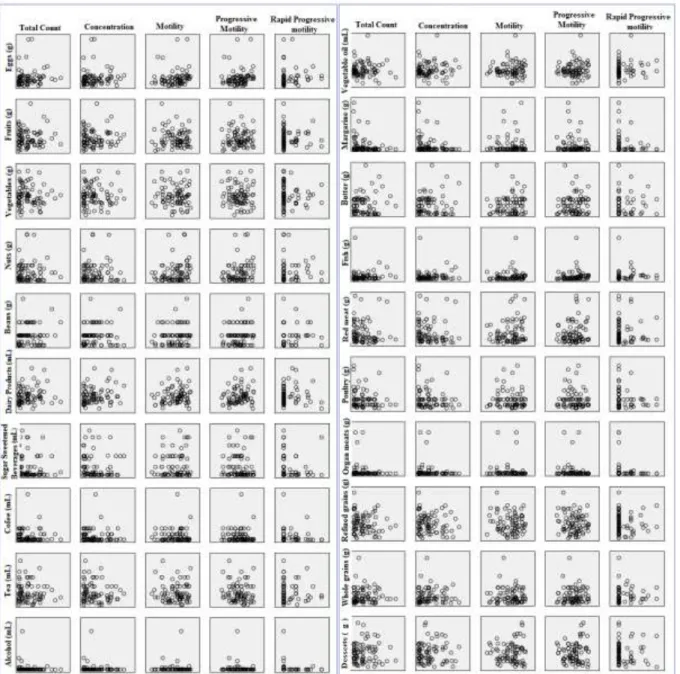
*Bold-framed boxes indicate significant relationship. Dashed frame show that positive, Plain frames show that negative relationship
Figure 1: Correlation between daily amount of food consumption and sperm parameters of fertile and normospermic men
Similarly, another study found that the mean BMI of normozoospermic males was 26.4±3.8 kg/m2, while that of subfertile males was 30.9±3.5 kg/m2 (p <0.001)34. As a result of increase in adipose tissue; aromatase enzyme activity increases the conversion of testosterone to estrogen, and serum testosterone levels reduce sperm count in addition to quality. Also, as a result of an increase in fat
content in the testis area, the sperm count decreases due to increased scrotal heat35.
the findings from the literature, the present study found the frequency which subfertile participants eat out to be (16.7±15.44 times/month) which was significantly higher than that of the normozoospermic group (9.4±10.74 times/month) (p<0.05).
Micronutrients such as vitamins and minerals play an essential role in testicular development, spermatogenesis, and sperm motility34. In this study, daily vitamin C intake was found to be significantly higher in the normozoospermic group (180.79±102.72 mg) than in the subfertile group (138.65±65.88 mg) (p<0.05). Another study found low ascorbic acid levels associated with decreased sperm count in addition to motility and reported that treatment with diet improved sperm quality36. The semen vitamin C concentration of fertile participants was found to be higher than that of infertile participants37. The antioxidant vitamin C (ascorbic acid) reduces the unpaired electrons of oxidative molecules and controls oxidative stress37. Another micro-nutrient which is related to male infertility is folate. Since folate is involved in DNA, tRNA, and protein synthesis, it has a crucial role in the process of spermatogenesis38. In this study, the dietary daily folic acid levels of subfertile participants (174.6±52.85 µg) were significantly lower than that of the normozoospermic group (209.8±89.88 µg) (p<0.05). Another study reported that folate and zinc supplementation for 26 weeks in subfertile participants increased the sperm concentration by at least 18%38.
In this study, we found that the consumption of sugar sweetened beverages was significantly higher in the subfertile participants (66.0 mL/day) than in the normozoospermic group (4 mL/day) (p<0.05). We also detected that increased consumption of sugar sweetened beverages decreased sperm count and rapid sperm motility. Similar studies have also reported that an increase in the consumption of sugary foods and drinks cause a decrease in sperm count and motility18,19. It has been reported that the prevalence of obesity and diabetes increases in parallel with the increase in consumption of sugar sweetened beverages known as the primary source of dietary fructose39. Excessive consumption of
sugar sweetened beverages increases insulin resistance which consequently leads to an increase in oxidative stress, both of which have an adverse effect on sperm parameters20.
It was also reported that alcohol consumption causes damage to the proteins required for the production of sperm cells (leading to denaturation) and decreases the sperm count by disrupting Sertoli cell functions. It also decreases serum testosterone, LH, in addition to FSH levels and inhibits the development along with the maturation of sperm cells40,41. In this study, alcohol consumption of the subfertile group (4.11 mL/day) was significantly higher than that of the normozoospermic group (0.8 mL/day) (p<0.05). In the study by Anderson Jr et al., acrosome deformation was found in a large number of sperm cells in the participants who consumed alcohol42. Another study found that the number of leukocytes in semen was higher in the participants who consumed alcohol than in those who did not and argued that this increases the susceptibility to inflammation and may adversely affect sperm parameters43.
After slaughter, not all steroids are excreted; measurable levels are present in muscle, fat, liver, kidney, and other organs present in meat products.
As fish is one of the most important sources of omega-3 fatty acids, it has antioxidant, anti-inflammatory, and antihypertensive properties. In our study, fish consumption was significantly lower in the subfertile group (2.5 g) than in the normozoospermic group (15.0 g) (p<0.05) and fish consumption positively correlated with sperm count in addition to progressive and rapid progressive motility. In a study comparing the sperm cell membranes of infertile and fertile participants in terms of fatty acid composition, the concentration of EPA and DHA was found higher in the sperm cell membranes of fertile men while the concentration of saturated fat and arachidonic acid was found to be higher in infertile men45 As both acrosome reaction and sperm-oocyte fusion are membrane-related events, the normal structure of the sperm membrane is essential for successful fertilization46. Another study concluded that acrosomal defects decreased due to the increase of supplementation omega-3 PUFA intake12. In rats exposed to oxidative stress, administration of omega-3 fatty acids increased testicle superoxide dismutase (SOD) in addition to glutathione peroxidase (GSH-Px) enzyme levels and decreased malondialdehyde (MDA) levels 47. The administration of 1.84 g EPA and DHA to patients with idiopathic OAT for 32 weeks increased sperm count, concentration, and motility 48. Nuts were also found to be associated with sperm quality due to the richness in omega-3 fatty acids. In this study we detected positive correlation between nut consumption along with total and progressive motility. In another study, it was observed that sperm motility and morphology increased by adding 12 g walnut to daily diets of young men fed according to the Western diet model for 12 weeks 49. These results show that nut consumption is related to male fertility.
Interestingly, our study also suggests that egg consumption is positively correlated with all sperm parameters. When we examined the literature, we were unable to find any study supporting this finding. However, in animal studies, it was found that egg yolk has a protective
effect on sperm motility from external factors50,51. Nevertheless, the reasons for this relationship should be examined in more detail. Our assessment was that this was due to the fact that lysozyme, ovomucoid, ovoinhibitor, in addition to cystatin are biologically active proteins in egg albumen, carotenoids, and lecithin in the composition of the egg51. Similarly, lecithin is a functional and structural component of all biological membranes, which acts in the rate-limiting step of the activation of membrane enzymes such as superoxide dismutase. As a result of ineffective activation of these antioxidant enzymes this would lead to increased damage of membranes by reactive oxygen species. Additionally, carotenoids have an excellent antioxidant capacity and eggs are a very important food source of these carotenoids, especially in the case of individuals who consume low amounts of vegetables with a high content of these substances52.
The principal strength of the present study is the originality of the work, as this is the first study exploring the association between nutrition and sperm quality parameters in Turkish males. The main limitations of the study are the cross-sectional nature and small sample sizes which would especially affect the power to detect differences between the two groups. Despite small sample sizes we determined significant nutritional factors related to male fertility. However, we may have failed to observe the other true differences between the groups. Also, cross-sectional design could not determine whether nutrition and sperm parameters are causally related. Therefore, future well-designed prospective studies and clinical trials on this topic are recommended.
of sperm of the participants. Since we found that obesity is another factor that is related to male fertility, the nutritional status of all males admitted to the infertility clinic should be evaluated by a dietitian and body weight should be kept within normal limits with appropriate medical nutrition therapy. Nutritional factors that are associated with male infertility if treated may increase the physiologic chances of pregnancy of a couple.
Acknowledgement
No financial support was received for this research. We would like to thank all patients who participated in this study and Gazi University Faculty of Medicine IVF unit employees.
Contribution of Authors
Yörüsün, Akdevelioğlu and Karabacak were conceptualized and designed the study. All author participated in designing process of study; Yörüsün, Bozkurt, Karabacak and Gümüşlü carried out data collection; Yörüsün and Akdevelioğlu performed data analysis and prepared the draft manuscript. All authors read and approved the final manuscript.
References
1. Dohle GR, Colpi GM, Hargreave TB, Papp GK, Jungwirth A and Weidner W. EAU guidelines on male infertility. Eur Urol. 2005;48(5):703–11. 2. Fenkçi İV. Üreme Sağlığı ve Üremeye Yardımcı
Tedaviler. İstanbul: İstanbul Tıp; 2012.
3. Vayena E, Rowe PJ and Griffin PD. Current practices and controversies in assisted reproduction: report of a meeting on medical, ethical and social aspects of assisted reproduction, held at WHO Headquarters in Geneva, Switzerland. 2002
4. Centers for Disease Control and Prevention. İnfertility FastStats [Internet]. 2016 [cited 2019 Jul 16].
Available from:
https://www.cdc.gov/nchs/fastats/infertility.htm 5. Satar DA and Gençdal S. Sperm değerlendirmesi. Arşiv
Kaynak Tarama Derg. 2013;22(4).
6. Agarwal A, Mulgund A, Hamada A and Chyatte MR. A unique view on male infertility around the globe. Reprod Biol Endocrinol. 2015;13(1):37.
7. Jørgensen N, Joensen UN, Jensen TK, Jensen MB, Almstrup K, Olesen IA, Juul A, Andersen AM, Carlsen E, Petersen H, Toppari J and Skakkebek NE. Human semen quality in the new millennium: a prospective cross-sectional population-based study of 4867 men. BMJ Open. 2012;2(4):e000990.
8. Andersson A, Jørgensen N, Main KM, Toppari J, Meyts ER, Leffers H, Juul A, Jensen TK and Skakkebek NE. Adverse trends in male reproductive health: we may have reached a crucial ‗tipping point.‘ Int J Androl. 2008;31(2):74–80.
9. Carlsen E, Giwercman A, Keiding N and Skakkebæk NE. Evidence for decreasing quality of semen during past 50 years. Bmj. 1992;305(6854):609–13. 10. Swan SH, Elkin EP and Fenster L. The question of
declining sperm density revisited: an analysis of 101 studies published 1934-1996. Environ Health Perspect. 2000;108(10):961.
11. Ramalingam M, Kini S and Mahmood T. Male fertility and infertility. Obstet Gynaecol Reprod Med. 2014;24(11):326–32.
12. Attaman JA, Toth TL, Furtado J, Campos H, Hauser R and Chavarro JE. Dietary fat and semen quality among men attending a fertility clinic. Hum Reprod. 2012;27(5):1466–74.
13. Wong WY, Thomas CMG, Merkus JMWM, Zielhuis GA and Steegers-Theunissen RPM. Male factor subfertility: possible causes and the impact of nutritional factors. Fertil Steril. 2000;73(3):435–42. 14. Afeiche MC, Williams PL, Gaskins AJ, Mendiola J,
Jørgensen N, Swan SH and Chavarro JE. Meat intake and reproductive parameters among young men. Epidemiology. 2014;25(3):323.
15. Afeiche MC, Gaskins AJ, Williams PL, Toth TL, Wright DL, Tanrikut C, Hauser R and Chavarro JE. Processed Meat Intake Is Unfavorably and Fish Intake Favorably Associated with Semen Quality Indicators among Men Attending a Fertility Clinic– 3. J Nutr. 2014;144(7):1091–8.
16. Braga DP de AF, Halpern G, Rita de Cássia SF, Setti AS, Iaconelli Jr A and Borges Jr E. Food intake and social habits in male patients and its relationship to intracytoplasmic sperm injection outcomes. Fertil Steril. 2012;97(1):53–9.
17. Afeiche M, Williams PL, Mendiola J, Gaskins AJ, Jørgensen N, Swan SH and Chavarro JE. Dairy food intake in relation to semen quality and reproductive hormone levels among physically active young men. Hum Reprod. 2013;28(8):2265–75.
18. Mendiola J, Torres-Cantero AM, Moreno-Grau JM, Ten J, Roca M, Moreno-Grau S and Bernabeu R. Food intake and its relationship with semen quality: a case-control study. Fertil Steril. 2009;91(3):812–8. 19. Eslamian G, Amirjannati N, Rashidkhani B, Sadeghi M- R and Hekmatdoost A. Intake of food groups and idiopathic asthenozoospermia: a case–control study. Hum Reprod. 2012;27(11):3328–36.
20. Liu C-Y, Chou Y-C, Chao JC-J, Hsu C-Y, Cha T-L and Tsao C-W. The association between dietary patterns and semen quality in a general Asian population of 7282 males. PLoS One. 2015;10(7):e0134224. 21. Gaskins AJ, Colaci DS, Mendiola J, Swan SH and
Chavarro JE. Dietary patterns and semen quality in young men. Hum Reprod. 2012;27(10):2899–907. 22. Afeiche MC, Bridges ND, Williams PL, Gaskins AJ,
Dairy intake and semen quality among men attending a fertility clinic. Fertil Steril. 2014;101(5):1280–7. 23. Hammoud AO, Wilde N, Gibson M, Parks A, Carrell DT
and Meikle AW. Male obesity and alteration in sperm parameters. Fertil Steril. 2008;90(6):2222–5.
24. World Health Organization. WHO laboratory manual for the examination and processing of human semen. 2010 25. Merdol Kutluay T. Toplu Beslenme Yapılan Kurumlar
için Standart Yemek Tarifeleri. Ankara: Hatiboğlu Yayınevi. 2003
26. Baysal A. Türk mutfağından örnekler. Vol. 56. Kültür Bakanlığı; 1993.
27. Lohman TG, Roche AF and Martorell R. Anthropometric standardization reference manual. Vol. 177. Human kinetics books Champaign; 1988.
28. World Health Organization. Body mass index - BMI. 2019.
29. Kalaycı Ş. SPSS uygulamalı çok değişkenli istatistik teknikleri. Vol. 5. Asil Yayın Dağıtım Ankara, Turkey; 2010.
30. Eliasson R. Semen analysis with regard to sperm
number, sperm morphology and functional aspects. Asian J Androl. 2010;12(1):26.
31. Bujan L, Mansat A, Pontonnier F and Mieusset R. Time series analysis of sperm concentration in fertile men in Toulouse, France between 1977 and 1992. Bmj. 1996;312(7029):471–2.
32. Martini AC, Tissera A, Estofán D, Molina RI, Mangeaud A, de Cuneo MF and Ruiz RD. Overweight and seminal quality: a study of 794 patients. Fertil Steril. 2010;94(5):1739–43.
33. Sermondade N, Faure C, Fezeu L, Shayeb AG, Bonde JP, Jensen TK, Van Wely M, Cao J, Martini AC, Eskandar M, Chavarro JE, Koloszar S, Twigt JM, Ramlau-Hansen CH, Borges E Jr, Lotti F, Steegers-Theunissen RP, Zorn B, Polotsky AJ, La Vignera S, Eskenazi B, Tremellen K, Magnusdottir EV, Fejes I, Hercberg S, Lévy R and Czernichow S . BMI in relation to sperm count: an updated systematic review and collaborative meta-analysis. Hum Reprod Update. 2012;19(3):221–31.
34. Oostingh EC, Steegers-Theunissen RPM, de Vries JHM, Laven JSE and Koster MPH. Strong adherence to a healthy dietary pattern is associated with better semen quality, especially in men with poor semen quality. Fertil Steril. 2017;107(4):916–23.
35. Demirci N. Erkek Fertilitesi ve Riskli Yaşam Biçimi Davranışları. Florence Nightingale Hemşirelik Derg. 2014;22(1):39–45.
36. Dawson EB, Harris WA and Powell LC. Relationship between ascorbic acid and male fertility. In: Aspects of Some Vitamins, Minerals and Enzymes in Health and Disease. Karger Publishers; 1990. p. 1–26.
37. Colagar AH and Marzony ET. Ascorbic acid in human seminal plasma: determination and its relationship to sperm quality. J Clin Biochem Nutr. 2009;45(2):144–9. 38. Ebisch IMW, Pierik FH, De Jong FH, Thomas CMG and
Steegers-Theunissen RP. Does folic acid and zinc sulphate intervention affect endocrine parameters and sperm characteristics in men? Int J Androl. 2006;29(2):339–45.
39. Maersk M, Belza A, Stødkilde-Jørgensen H, Ringgaard
S, Chabanova E, Thomsen H, Pedersen SB, Astrup A and Richelsen B. Sucrose-sweetened beverages increase fat storage in the liver, muscle, and visceral fat depot: a 6-mo randomized intervention study. Am J Clin Nutr. 2011;95(2):283–9.
40. Emanuele MA and Emanuele NV. Alcohol‘s effects on male reproduction. Alcohol Health Res World. 1998;22:195–201.
41. Zhu Q, Van Thiel DH and Gavaler JS. Effects of ethanol on rat Sertoli cell function: studies in vitro and in vivo. Alcohol Clin Exp Res. 1997;21(8):1409–17.
42. Anderson Jr RA, Berryman SH, Phillips JF, Feathergill KA, Zaneveld LJD and Russell LD. Biochemical and structural evidence for ethanol-induced impairment of testicular development: apparent lack of Leydig cell
involvement. Toxicol Appl Pharmacol.
1989;100(1):62–85.
43. Martin-Boyce A, David G and Schwartz D.
Genitourinary infection, smoking and alcohol in the male (author‘s transl). Rev Epidemiol Sante Publique. 1977;25(3):209–16.
44. Williams P. Nutritional composition of red meat. Nutr Diet. 2007;64:S113–9.
45. Gulaya NM, Margitich VM, Govseeva NM,
Klimashevsky VM, Gorpynchenko II and Boyko MI. Phospholipid composition of human sperm and seminal plasma in relation to sperm fertility. Arch Androl. 2001;46(3):169–75.
46. Zalata AA, Christophe AB, Depuydt CE, Schoonjans F and Comhaire FH. The fatty acid composition of phospholipids of spermatozoa from infertile patients. Mol Hum Reprod. 1998;4(2):111–8.
47. Zararsiz I, Kus I, Davarci M, Kus MA, Kaman D and Sarsilmaz M. Omega-3 yag asitlerinin siçan testis dokusu üzerine koruyucu etkileri/The protective effects of omega-3 fatty acids on rat testicular tissue. Dicle Tip Derg. 2011;38(4):382.
48. Safarinejad MR. Effect of omega‐3 polyunsaturated fatty acid supplementation on semen profile and enzymatic anti‐oxidant capacity of seminal plasma in infertile men with idiopathic oligoasthenoteratospermia: a double‐blind, placebo‐controlled, randomised study. Andrologia. 2011;43(1):38–47.
49. Robbins WA, Xun L, FitzGerald LZ, Esguerra S,
Henning SM and Carpenter CL. Walnuts improve semen quality in men consuming a Western-style diet: randomized control dietary intervention trial. Biol Reprod. 2012; 87(4), 101-1.
50. Foulkes JA. The separation of lipoproteins from egg yolk and their effect on the motility and integrity of bovine spermatozoa. Reproduction. 1977;49(2):277–84. 51. Shannon P, Curson B, Pitt CJ, Lai KC and Baas JW.
Effects of various fractions of egg yolk, BSA, and ovalbumin on sperm motility, and effect of storage on restoration of motility. New Zeal J Agric Res. 1983;26(3):297–302.