Spotlight™ on SQL Server® Enterprise
11.0.2
© 2014 Dell Inc. ALL RIGHTS RESERVED.
This guide contains proprietary information protected by copyright. The software described in this guide is furnished under a software license or nondisclosure agreement. This software may be used or copied only in accordance with the terms of the applicable agreement. No part of this guide may be reproduced or
transmitted in any form or by any means, electronic or mechanical, including photocopying and recording for any purpose other than the purchaser’s personal use without the written permission of Dell Inc.
The information in this document is provided in connection with Dell products. No license, express or implied, by estoppel or otherwise, to any intellectual property right is granted by this document or in connection with the sale of Dell products. EXCEPT AS SET FORTH IN THE TERMS AND CONDITIONS AS SPECIFIED IN THE LICENSE AGREEMENT FOR THIS PRODUCT, DELL ASSUMES NO LIABILITY WHATSOEVER AND DISCLAIMS ANY EXPRESS, IMPLIED OR STATUTORY WARRANTY RELATING TO ITS PRODUCTS INCLUDING, BUT NOT LIMITED TO, THE IMPLIED
WARRANTY OF MERCHANTABILITY, FITNESS FOR A PARTICULAR PURPOSE, OR NON-INFRINGEMENT. IN NO EVENT SHALL DELL BE LIABLE FOR ANY DIRECT, INDIRECT, CONSEQUENTIAL, PUNITIVE, SPECIAL OR INCIDENTAL DAMAGES (INCLUDING, WITHOUT LIMITATION, DAMAGES FOR LOSS OF PROFITS, BUSINESS INTERRUPTION OR LOSS OF INFORMATION) ARISING OUT OF THE USE OR INABILITY TO USE THIS DOCUMENT, EVEN IF DELL HAS BEEN ADVISED OF THE POSSIBILITY OF SUCH DAMAGES. Dell makes no representations or warranties with respect to the accuracy or completeness of the contents of this document and reserves the right to make changes to specifications and product descriptions at any time without notice. Dell does not make any commitment to update the information contained in this document.
If you have any questions regarding your potential use of this material, contact: Dell Inc.
Attn: LEGAL Dept 5 Polaris Way Aliso Viejo, CA 92656
Refer to our web site (software.dell.com) for regional and international office information.
Patents
Protected by U.S. Patent #6,901,582. Additional patents pending.
Trademarks
Dell, the Dell logo, Toad, Toad World and Spotlight are trademarks of Dell Inc. and/or its affiliates. Microsoft, Windows, Windows Vista, Windows Server, Internet Explorer and SQL Server are either registered trademarks or trademarks of Microsoft Corporation in the United States and/or other countries. VMware and ESX Server are either registered trademarks or trademarks of EMC Corporation in the United States and/or other countries. Citrix® and Xen® are trademarks of Citrix Systems, Inc. and/or one or more of its subsidiaries, and may be registered in the United States Patent and Trademark Office and in other countries. Pentium is a trademark of Intel Corporation in the U.S. and/or other countries. Other trademarks and trade names may be used in this document to refer to either the entities claiming the marks and names or their products. Dell disclaims any proprietary interest in the marks and names of others.
Legend
CAUTION:A CAUTION icon indicates potential damage to hardware or loss of data if instructions are not followed.
WARNING:A WARNING icon indicates a potential for property damage, personal injury, or death. IMPORTANT NOTE,NOTE,TIP,MOBILE, orVIDEO:An information icon indicates supporting information.
Spotlight on SQL Server Enterprise Deployment Guide Updated - October 2014
Contents
Welcome to Spotlight™ on SQL Server® 6
Editions of Spotlight on SQL Server 6
Systems in the Deployment 8
Size of the deployment 9
Co-existence with Performance Analysis 9
Security in the deployment 10
Demilitarized zones (DMZ) 10
Spotlight clients 12
Permissions 13
Spotlight Diagnostic Server 14
Account permissions on the Spotlight Diagnostic Server 15
Network ports on the Spotlight Diagnostic Server 15
If the Spotlight Diagnostic Server and Spotlight Client are installed on different host
computers 16
Diagnostic Server - Access to the Internet 16
Windows Control Panel | Internet Options | Connections 16 Windows Control Panel | Internet Options | Advanced 16
Playback Database 18
Spotlight Statistics Repository 20 Monitored systems in the deployment 22
Monitored SQL Servers 24
SQL Server account permissions 24
SQL Server performance counters 25
Network ports and SQL Server connections 26
Monitored Windows servers and hosts of database connections 27
Windows account permissions 28
Configure DCOM security 31
5. Configure WMI permissions 31
Windows domains 32
Enable disk counters 32
Network ports and Windows connections / Windows hosts 33
How to limit the number of ports used by WMI 33
Troubleshooting WMI 34
WMI Test 1 34
WMI Test 2 34
WMI Test 3 34
WMI errors 35
Monitoring the Spotlight Diagnostic Server 39
Installation and upgrade 40
Permissions required during installation 40
Install 40
Upgrade 42
Monitoring your Spotlight on SQL Server connections on a mobile device 43
Preservation of configuration information 43
Uninstall 43
Configure 45
Configure | Connections 46
Configure the Playback Database 46
Configure the Spotlight Statistics Repository 47
Configure uploading to Spotlight Essentials 48
Upload health check data to Spotlight Essentials 49
Upload mobile monitoring data to Spotlight Essentials 49
Spotlight Essentials account details 49
Spotlight diagnostic user groups 49
Spotlight user privileges within Spotlight 50
Membership to the Spotlight Diagnostic User Groups 52
Maintenance 54
Back up Spotlight configuration data 54
Start and stop the Spotlight Diagnostic Server 54
Maintenance plan for Spotlight Statistics Repository and Playback Database 54
Database configuration 55
Fragmentation and index performance 55
Database backup 55
Contacting Dell 56
Technical support resources 56
1
Welcome to Spotlight™ on SQL Server®
Spotlight™ on SQL Server® monitors the activity of SQL Server instances. Spotlight displays a visual
representation of the status of the databases in your enterprise, enabling you to drill down to graphical flows that illustrate the rate at which data is moving between server components. Icons display the value of key statistics and measurements. A range of visual graphs and tabular grids provide you with detailed information about your SQL Server instance.
The components and dataflows change color to show you the source of any problem. When Spotlight on SQL Server detects a condition that it considers is a potential problem, it not only informs you about it, but advises you what you could look at to diagnose the problem further and suggests corrective actions.
Spotlight on SQL Server seamlessly combines data from several disparate sources into a single user interface. It collects and combines data from Windows performance counters, SQL Server system tables, SQL Server commands and the Windows registry, and presents them in logically related screens.
Editions of Spotlight on SQL Server
This is a guide for Spotlight on SQL Server Enterprise.Features Spotlight on SQL Server Enterprise Spotlight on SQL
Server Standard
Architecture Deployable with separate Spotlight
Diagnostic Server and multiple clients.
Single installation
Heat Map Yes Yes
Playback Database Yes Yes
Spotlight Statistics Repository and Spotlight Reporting and Trending
Yes No
Email notifications on alarms Yes No
Upload data to Spotlight™ Essentials Yes Yes
Monitored Connections
Microsoft® SQL Server Yes Yes
Microsoft SQL Server Replication Yes No
Features Spotlight on SQL Server Enterprise Spotlight on SQL Server Standard
Microsoft Windows® Yes Yes
Microsoft SQL Server Analysis Services Yes Yes
Microsoft SQL Azure Database Yes Yes
VMware® Server Yes Yes
NOTE:The Spotlight on SQL Server Diagnostics Drilldown is available only in Spotlight on SQL Server Enterprise.
2
Systems in the Deployment
System Description
Spotlight Clients
Spotlight data is viewed on a Spotlight Client.
A Spotlight Client can be installed on the same machine as the Spotlight Diagnostic Server but doesn't have to be. There can be many Spotlight Clients.
Spotlight Diagnostic Server
The Spotlight Diagnostic Server is at the core of the Spotlight on SQL Server architecture. The Spotlight Diagnostic Server connects to the monitored systems including the SQL Server instances being monitored. The Spotlight Diagnostic Server collects data that is then supplied in real time to the Spotlight clients.
Spotlight Playback Database
Recent history is stored in the Playback Database.
Spotlight Statistics Repository
Long term history for reporting and trending is stored in the Spotlight Statistics Repository.
Monitored Connections
3
Size of the deployment
How many SQL Servers Instances do you expect to monitor?
Number Description 1 - 25 SQL
Server Instances
The Spotlight Diagnostic Server, playback database and Spotlight Statistics Repository can all be installed on the same machine, as long as that machine meets the minimum hardware
requirements listed in the release notes. More than
25
SQL Server Instances
It is recommended that the playback database and Spotlight Statistics Repository be installed on a machine other than the Spotlight Diagnostic Server.
The machine(s) that host the playback database and the Spotlight Statistics Repository should be configured with an appropriate amount of I/O bandwidth to meet demand.
If your environment uses a storage area network (SAN) it may be possible to install the Spotlight Statistics Repository and the playback database on the same server.
Maximum Spotlight on SQL Server is designed to monitor a maximum of 100 SQL Servers, Analysis Services or Replication instances and 100 Windows servers. Exceeding this recommended limit on 32 bit environments may result in poor performance or product instability, due to the 1 Gb memory limit. On 64 bit environments theoretically more connections can be monitored as the 1 Gb limit no longer applies, however testing of this has been limited.
Co-existence with Performance Analysis
If you are using Spotlight on SQL Server and Performance Analysis, observe the following.l Spotlight on SQL Server and Performance Analysis (middleware) must be on separate disk volumes. This
prevents out of disk space conditions which may affect monitoring.
l Spotlight on SQL Server and Performance Analysis repositories can co-exist when more than 25 SQL
Server instances are monitored provided the hardware specifications of the machine that the repositories are installed on are adequate.
4
Security in the deployment
Running Spotlight on SQL Server in an environment with a firewall may require ports to be opened between the Spotlight Diagnostic Server and monitored SQL Servers and/or the Spotlight Diagnostic Server and Spotlight clients.
l Network ports on the Spotlight Diagnostic Server l Network ports and SQL Server connections
l Network ports and Windows connections / Windows hosts l SQL Server account permissions
l Windows account permissions
l How to limit the number of ports used by WMI
Demilitarized zones (DMZ)
Scenario: The Spotlight Diagnostic Server and monitored SQL Servers are inside a DMZ TCP
3843 UDP 3843
The Spotlight Client communicates with the Spotlight Diagnostic Server using port 3843 TCP and UDP. These ports need to be opened on the firewall.
TCP 40403
Open port TCP 40403 if you intend to use the Alarm Actions feature of Spotlight. For more information, seeConfigureon page45.
Scenario: The Spotlight Diagnostic Server is outside a DMZ; the monitored SQL Servers are inside a DMZ TCP 3843
UDP 3843
These are the UDP and TCP ports between the Spotlight Client and Spotlight Diagnostic Server.
5
Spotlight clients
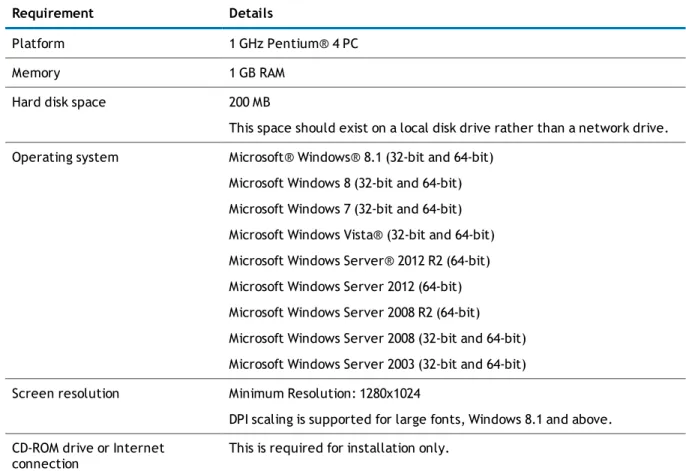
Table 1: Client requirements
Requirement Details
Platform 1 GHz Pentium® 4 PC
Memory 1 GB RAM
Hard disk space 200 MB
This space should exist on a local disk drive rather than a network drive. Operating system Microsoft® Windows® 8.1 (32-bit and 64-bit)
Microsoft Windows 8 (32-bit and 64-bit) Microsoft Windows 7 (32-bit and 64-bit) Microsoft Windows Vista® (32-bit and 64-bit) Microsoft Windows Server® 2012 R2 (64-bit) Microsoft Windows Server 2012 (64-bit) Microsoft Windows Server 2008 R2 (64-bit) Microsoft Windows Server 2008 (32-bit and 64-bit) Microsoft Windows Server 2003 (32-bit and 64-bit) Screen resolution Minimum Resolution: 1280x1024
DPI scaling is supported for large fonts, Windows 8.1 and above. CD-ROM drive or Internet
connection
This is required for installation only.
Table 2: Additional software requirements
Requirement Details
SQL Server Client Tools Required to use the Discovery Wizard to locate SQL Servers on your network. SQL Server Client Tools can be found on the Microsoft SQL Server installation media.
Client Connectivity Tools - Required to monitor an Analysis Services server.
Requirement Details
.NET 4 or later .NET is required for the Performance Health drilldowns and the Spotlight Report Viewer.
Microsoft Internet Explorer® 6.0 or later.
Microsoft Data Access Components (MDAC)
MDAC includes the ODBC and other components that enable a connection to be established to a SQL Server database. The database may be local or remote. Your client machine must have MDAC 2.7 (or later) installed. MDAC is available from the Microsoft website:
www.microsoft.com/downloads
To find out the version of MDAC that you are currently running, you can download an application from the Microsoft website called the
Component Checker Tool. Review the following Microsoft Knowledge Base article for more information:http://support.microsoft.com/kb/301202 Microsoft Report Viewer 2010 Ensure the Microsoft Report Viewer is installed and operational. The
redistributable package is available from: http://www.microsoft.com/en-us/download/details.aspx?id=6442.
The Report Viewer is used to view the Reporting and Trending | Reports.
Permissions
During operation, the Spotlight Client requires write access to the following file locations: Windows 7 / Windows 2008 Server / Windows Vista
l C:\ProgramData\Quest Software\Spotlight l C:\ProgramData\Quest Software\Shared
l C:\Users\<current user>\AppData\Roaming\Quest Software
Windows 2003 Server
l C:\Documents and Settings\All Users\Application Data\Quest Software\Spotlight l C:\Documents and Settings\All Users\Application Data\Quest Software\Shared l C:\Documents and Settings\<current user>\Application Data\Quest Software\Spotlight
6
Spotlight Diagnostic Server
Table 3: Spotlight Diagnostic Server requirements
Requirement Details
Platform 2 GHz Pentium Dual Core
Memory 2 GB RAM
Hard disk space 300 MB
If the Diagnostic Server’s connection to the Spotlight Statistics Repository or Playback database is interrupted, the Diagnostic Server will cache data to the local disk. In this event, an extra 2 MB per hour, per monitored server is required.
Operating system Microsoft Windows 8.1 (32-bit and 64-bit) Microsoft Windows 8 (32-bit and 64-bit) Microsoft Windows 7 (32-bit and 64-bit) Microsoft Windows Server 2012 R2 (64-bit) Microsoft Windows Server 2012 (64-bit) Microsoft Windows Server 2008 R2 (64-bit) Microsoft Windows Server 2008 (32-bit and 64-bit) Microsoft Windows Server 2003 (32-bit and 64-bit)
NOTE:The Diagnostic Server is not supported on a cluster.
.NET .NET 3.5 or later.
Table 4: Additional software requirements
Requirement Details
SQL Server Client Tools Required to use the Discovery Wizard to locate SQL Servers on your network. SQL Server Client Tools can be found on the Microsoft SQL Server installation media.
Client Connectivity Tools - Required to monitor an Analysis Services server.
Requirement Details
SQL Server Management Tools Required to monitor an Analysis Services server, a SQL Server Replication environment, and the use of Session Trace and SQL Analysis when monitoring a SQL Server.
The SQL Server Management Tools are available from any SQL Server 2005, SQL Server 2008, SQL Server 2012 or SQL Server 2014 edition except SQL Server Express and SQL Server Compact. The version required corresponds to the latest version of SQL Server that you are monitoring. Note, if you are monitoring SQL Server 2000 servers, you need the Management Tools from SQL Server 2005.
Internet Access Required by Auto Update and Spotlight Essentials and monitoring of your Spotlight connections from your favorite mobile device.
Account permissions on the Spotlight
Diagnostic Server
l During operation the Spotlight Diagnostic Server requires write access to the PROGRAM FILES folder. l The minimum Windows privilege level required to run the Spotlight Diagnostic Server is Power User. l If the Spotlight Diagnostic Server is in a different domain to the domain that the Spotlight Clients are in,
the domain that the Spotlight Diagnostic Server is in must trust the domain that the Spotlight Client users are in.
Network ports on the Spotlight Diagnostic
Server
Port Description
3843 This is the default port for retrieving data on the network. This port must be open on the Spotlight Diagnostic Server. TCP
3166
This is the default port for the data collection subsystem of the Spotlight Diagnostic Server. No external connections are required on this port.
If a firewall is installed on the Spotlight Diagnostic Server then ensure this port is open. TCP
443
This port is used by Spotlight Essentials. Ensure this port is open when Spotlight Essentials is enabled. For more information, seeConfigure uploading to Spotlight Essentialson page48.
If the Spotlight Diagnostic Server and Spotlight Client are
installed on different host computers
Port Description TCP
40403
Open port TCP 40403 if you intend to use the Alarm Actions feature of Spotlight. For more information, seeConfigureon page45.
Diagnostic Server - Access to the Internet
The Spotlight Diagnostic Server requires access to the Internet:l When Auto Update is enabled.
l When uploading of performance data to Spotlight Essentials. For more information, seeConfigure
uploading to Spotlight Essentialson page48.
l When monitoring of your Spotlight connections from your favorite mobile device. For more information,
seeConfigure uploading to Spotlight Essentialson page48.
Windows Control Panel | Internet Options | Connections
On the computer hosting the Spotlight Diagnostic Server:1. Open theControl Panel | Internet Options. 2. Select theConnectionstab.
3. ClickLAN Settings.
4. Ensure the settings on this screen are appropriate to the settings of your local environment. NOTE:After the Spotlight Diagnostic Server is installed, restart the Spotlight Diagnostic Server after changes are made. For instructions seeStart and stop the Spotlight Diagnostic Server.
Windows Control Panel | Internet Options | Advanced
On the computer hosting the Spotlight Diagnostic Server:1. Open theControl Panel | Internet Options. 2. Select theAdvancedtab.
NOTE:After the Spotlight Diagnostic Server is installed, restart the Spotlight Diagnostic Server after changes are made. For instructions seeStart and stop the Spotlight Diagnostic Server.
7
Playback Database
Table 5: Playback database requirements
Requirement Details
Database sizing The MS Model database is used. The database size usually starts at about 3MB (data size) and 1MB (log size).
Hard disk space Requires approximately 270 MB for each monitored SQL Server instance and the corresponding monitored Windows host on which the SQL Server instance resides. Retains 7 days of historical data for each connection in the playback database by default. This is configurable.
This estimate assumes default configuration in an average environment. Actual space used will depend on your environment and any data collection/storage configuration changes that are made. For more
information, see the Spotlight on SQL Server Sizing Wizard. You can access the wizard from the Spotlight Installation Center.
SQL Server The playback database can be installed on:
l SQL Server 2014 l SQL Server 2012 l SQL Server 2008 R2 l SQL Server 2008 l SQL Server 2005
NOTE:Due to the size of the playback database, it is
recommended that this database is not installed on a SQL Express instance. The playback database cannot be installed on SQL Server 2000.
Other requirements The SQL Browser service must be running on the machine where the playback database is installed. Alternatively you can use the host and port number of the (named) SQL Server instance you want to connect to, when creating a connection and connecting to the playback database. Use the following syntax:
HOST,PORT
Where HOST is the machine name and PORT is the port for the (named) SQL Server instance. For more information, seeConfigure the Spotlight Statistics Repositoryon page47.
Requirement Details
The TCP protocol must be enabled on the instance where the playback database resides.
Maintenance The Diagnostic Server runs maintenance procedures daily at 3am for the playback database. This is configurable.
It is highly recommended that regular maintenance is performed on the playback database. The recommended maintenance plan is outlined in the online help and in this guide.
For more information, seeMaintenance plan for Spotlight Statistics Repository and Playback Databaseon page54.
8
Spotlight Statistics Repository
Table 6: Spotlight Statistics Repository Requirements Requirement Details
Database sizing
The MS Model database is used. The database size usually starts at about 3MB (data size) and 1MB (log size).
Hard Disk Space
Approximately 1.2 GB for each monitored SQL Server instance and the corresponding monitored Windows host on which the SQL Server instance resides.
This estimate assumes default configuration in an average environment. Actual space used will depend on your environment and any data collection/storage configuration changes that are made. For more information, see the Spotlight on SQL Server Sizing Wizard. You can access the wizard from the Spotlight Installation Center.
SQL Server The Spotlight Statistics Repository can be installed on:
l SQL Server 2014 l SQL Server 2012 l SQL Server 2008 R2 l SQL Server 2008 l SQL Server 2005
NOTE:Due to the size of the Spotlight Statistics Repository, it is recommended that this database is not installed on a SQL Express instance. The Spotlight Statistics Repository cannot be installed on SQL Server 2000.
Other Requirements
The SQL Browser service must be running on the machine where the Spotlight Statistics Repository is installed. Alternatively you can use the host and port number of the (named) SQL Server instance you want to connect to, when creating a connection and connecting to the Spotlight Statistics Repository.
Use the following syntax: HOST,PORT
Where HOST is the machine name and PORT is the port for the (named) SQL Server instance. For more information, seeConfigure the Spotlight Statistics Repositoryon page47.
The TCP protocol must be enabled on the instance where the Spotlight Statistics Repository resides.
Requirement Details
Statistics Repository.
It is highly recommended that regular maintenance is performed on the Spotlight Statistics Repository. The recommended maintenance plan is outlined in the online help and in this guide.
For more information, seeMaintenance plan for Spotlight Statistics Repository and Playback Databaseon page54.
9
Monitored systems in the deployment
Table 7: Spotlight on SQL Server is able to monitor the following connections
Requirement Details
SQL Server Spotlight can monitor SQL Server instances of the following versions:
l SQL Server 2014 (32-bit and 64-bit) l SQL Server 2012 (32-bit and 64-bit) l SQL Server 2008 R2 (32-bit and 64-bit) l SQL Server 2008 (32-bit and 64-bit) l SQL Server 2005 (32-bit and 64-bit)
Spotlight on SQL Server also supports MSDE (2000), SQL Express (2005) and SQL Server 2008 Express Edition. Note that use of these versions to host playback or Spotlight Statistics Repository databases is not supported. Spotlight continues to monitor SQL Server 2000 instances Service Pack 3 or later, however no further support (fixes) will be provided.
Spotlight cannot monitor earlier versions of SQL Server (version 7.x and earlier).
Spotlight supports all SQL Server sort orders, including case-sensitive and binary sort orders. Spotlight cannot monitor SQL Server instances where the instance name contains non-US ASCII characters.
Database Cloud Service Spotlight can be used to monitor SQL Azure.
Windows Server Spotlight can monitor the following operating systems:
l Microsoft Windows 8.1 (32-bit and 64-bit) l Microsoft Windows 8 (32-bit and 64-bit) l Microsoft Windows 7 (32-bit and 64-bit) l Microsoft Windows Vista (32-bit and 64-bit) l Microsoft Windows Server 2012 R2 (64-bit) l Microsoft Windows Server 2012 (64-bit) l Microsoft Windows Server 2008 R2 (64-bit) l Microsoft Windows Server 2008 (32-bit and 64-bit)
Requirement Details
l Microsoft Windows Server 2003 (32-bit and 64-bit)
On each monitored instance, Spotlight requires the network setting "File and Print Sharing" to be enabled and any firewall to be configured to:
l open port 1434 for UDP packets
l open the SQL Server TCP port (default is 1433)
Virtualization Spotlight can monitor virtual guest machines in a VMware® ESX infrastructure. The following versions are supported:
l VMware vCenter 2.5 (or later) l VMware ESX Server™ 4.0 (or later)
The username used to connect to the virtual guest machine must have at least a read-only role.
Connection Limit Spotlight on SQL Server is designed to monitor a maximum of 100 SQL Servers, Analysis Services or Replication instances and 100 Windows servers. Exceeding this recommended limit on 32 bit environments may result in poor performance or product instability, due to the 1 Gb memory limit. On 64 bit environments theoretically more connections can be monitored as the 1 Gb limit no longer applies, however testing of this has been limited.
10
Monitored SQL Servers
SQL Server account permissions
Ensure each SQL Server connection from the Spotlight Diagnostic Server has access to a SQL Server account that is a member of the sysadmin server role. This can be a SQL Server login (such as 'sa'), or the Spotlight Diagnostic Server can be installed to run under a Windows account that is trusted by SQL Server.
Alternatively, run the following SQL script (as sysadmin) to grant the required permissions to userTrustedUser. use master
grant ALTER TRACE to TrustedUser
grant VIEW SERVER STATE to TrustedUser
grant VIEW ANY DEFINITION to TrustedUser
USE [master] GO
CREATE USER [TrustedUser] FOR LOGIN [TrustedUser] GO
USE [msdb] GO
CREATE USER [TrustedUser] FOR LOGIN [TrustedUser] GO
grant VIEW DATABASE STATE to TrustedUser
use msdb
EXECUTE sp_addrolemember
@rolename = 'SQLAgentReaderRole', @membername = 'TrustedUser' use msdb
EXECUTE sp_addrolemember
@rolename = 'TargetServersRole', @membername = 'TrustedUser'
grant select on dbo.log_shipping_monitor_primary to TrustedUser
grant select on dbo.log_shipping_monitor_secondary to TrustedUser
grant select on dbo.log_shipping_primary_databases to TrustedUser
grant select on dbo.log_shipping_secondary_databases to TrustedUser
grant select on dbo.log_shipping_primary_secondaries to TrustedUser
grant select on dbo.log_shipping_primaries to TrustedUser
grant select on dbo.log_shipping_secondary to TrustedUser
grant select on dbo.log_shipping_secondaries to TrustedUser
grant select on dbo.sysjobs to TrustedUser
grant select on dbo.sysalerts to TrustedUser
grant select on dbo.sysjobhistory to TrustedUser
grant execute on dbo.sp_help_jobhistory to TrustedUser
grant select on msdb.dbo.syssessions to TrustedUser
grant select on msdb.dbo.sysjobactivity to TrustedUser
use master
grant EXECUTE on xp_servicecontrol to TrustedUser
grant EXECUTE on xp_enumerrorlogs to TrustedUser
grant EXECUTE on xp_readerrorlog to TrustedUser
grant EXECUTE on xp_sqlagent_enum_jobs to TrustedUser
grant execute on xp_regread to TrustedUser
SQL Server performance counters
Spotlight on SQL Server usessys.dm_os_performance_counters(sysperfinfo for SQL Server 2000) to retrieve data for many of its displays. In some rare cases, this table may not contain information. When this is the case, Spotlight on SQL Server will not be able to collect the data it requires, and will display "0" for many of its components. Most obvious will be the Memory icons on the home page, which will show 0 MB of memory used by SQL Server. Also, many of the flows on the home page will show no activity, and many drilldowns will show incomplete information.
Spotlight on SQL Server raises an informational alarm shortly after connecting if it detects that the sysperfinfo or sys.dm_os_performance_counters table contains no data.
You can confirm the existence of this problem by running the following SQL in the appropriate version of SQL Server Management Studio for SQL Server:
select * from sys.dm_os_performance_counters
Sometimes, for a variety of reasons, the SQL Server Performance Monitor counters will not show up as they should. Often, but not always, this problem can be fixed by following these steps.
To enable performance counters
1. At the command prompt, type the following: unlodctr.exe MSSQLServer
2. Then type:
lodctr.exe <SQL Server path>\binn\sqlctr.ini 3. Reboot the server.
More information can be found in the SQL Server Knowledge Base athttp://msdn.microsoft.com.
Network ports and SQL Server connections
Ensure ports are open as outlined in the Microsoft KBase article that describes SQL Server firewallconnectivity issues.
11
Monitored Windows servers and hosts
of database connections
This section refers to the Windows servers that Spotlight monitors and the Windows servers that host the database connections that Spotlight monitors.
Section Description
Windows account permissions
The Spotlight Diagnostic Server executes WMI queries against the Windows server on which the SQL Server is currently running. The Spotlight Diagnostic Server needs to have access to a Windows account that can retrieve this information. This account will normally be a member of the Administrators group on the server.
Windows domains
Spotlight can only connect to Windows servers and databases hosted on Windows servers in a domain. Spotlight cannot connect to Windows servers in a workgroup.
Enable disk counters
Spotlight on SQL Server cannot display some disk information properly unless the Windows server host has disk performance counters enabled.
Network ports and Windows connections / Windows hosts
The port connection to the SQL Server must be open for data to be retrievable over the network.
How to limit the number of ports used by WMI
In order to effectively use WMI between fire walled hosts, you can limit the number of ports used by the DCOM subsystem and only open those ports.
Monitoring the Spotlight Diagnostic Server
To monitor the Windows server that hosts the Spotlight Diagnostic Server, Windows requires that the Spotlight connection use Windows authentication.
Spotlight on SQL Server Release Notes
Windows account permissions
To retrieve performance counter information, the Spotlight Diagnostic Server executes WMI queries against the Windows server on which the SQL Server is currently running. The Spotlight Diagnostic Server needs to have access to a Windows account that can retrieve this information. This account will normally be a member of the Administrators group on the server.
This account is defined when configuring the connection. For more information, seeConfigure | Connectionson page46.
You may experience problems with WMI. For more information, seeTroubleshooting WMIon page34.
How to configure WMI with minimum required user
permissions
In some environments it may not be feasible to connect to the Windows server with an account that is a
member of the Administrators group. The following instructions are provided for these environments. Note that there are known issues with this procedure as documented below.
1. Setup permission to read data
2. Grant permissions to get information about services 3. Provide access to the Registry keys used by Spotlight 4. Run Windows Component Services
5. Configure WMI permissions
Following are known issues with configuring WMI with minimum required permissions
Known Issue Description The
OpenSessions collection
The OpenSessions collection sends a list of the open Windows network sessions to your server. The list includes who is connected and from where, how long they have been connected and how many files they have open.
The OpenSessions collection is used in:
l The Windows Server | Home Page | Network panel | Open Sessions count. l The Network Drilldown | Sessions page.
Spotlight does not alarm on this data. The Physical
Disk Drive collection
The Physical Disk Drive collection populates the Disks Drilldown | Disk Summary page. This drilldown contains a list of the physical disks installed on the server. Its data is relatively static as it only changes when disks are added, removed or repartitioned.
1. Setup permission to read data
NOTE:This is step 1 of the procedure for how to Configure WMI with minimum required user permissions.
Spotlight Useris the windows user that will be used in the connection to the Windows server and/or Windows host of the database connection. For more information, seeConfigure | Connectionson page 46.
1. ClickControl Panel | Administrative Tools | Computer Managementto open the Computer Management dialog.
2. Double clickLocal Users and Groups | Groups.
3. Double clickPerformance Log Users. Add theSpotlight Userto this group. OK. 4. Double clickPerformance Monitor Users. Add theSpotlight Userto this group. OK.
2. Grant permissions to get information about
services
NOTE:This is step 2 of the procedure for how to Configure WMI with minimum required user permissions.
Spotlight Useris the windows user that will be used in the connection to the Windows server and/or Windows host of the database connection. For more information, seeConfigure | Connectionson page 46.
Retrieve the user SID
From the Windows command prompt, typepowershelland click Enter to open the Powershell.
Run the following command to retrieve the user SID of theSpotlight User. ReplacedomainNameanduserName
with the domain name and user name for theSpotlight Useraccount.
[wmi]"win32_useraccount.domain='domainName',name='userName'"
Retrieve the current SDDL for the Services Control Manager
From the Windows command prompt, run the following command to retrieve the current SDDL for the Services Control Manager. The SDDL is saved in the file calledfile.txt.
sc sdshow scmanager > file.txt
The SDDL looks something like this. For more information seeMicrosoft KB914392.
D:(A;;CC;;;AU)(A;;CCLCRPRC;;;IU)(A;;CCLCRPRC;;;SU)(A;;CCLCRPWPRC;;;SY)(A;;KA;;;BA)S: (AU;FA;KA;;;WD)(AU;OIIOFA;GA;;;WD)
D:(A;;CC;;;AU)(A;;CCLCRPRC;;;IU) (A;;CCLCRPRC;;;S-1-5-21-214A909598-1293495619-13Z157935-75714)(A;;CCLCRPRC;;;SU)(A;;CCLCRPWPRC;;;SY)(A;;KA;;;BA) S:(AU;FA;KA;;;WD) (AU;OIIOFA;GA;;;WD)
Set the security credentials for accessing the Service Control Manager
The sdset command on sc sets the security credentials for accessing the Service Control Manager (scmanager). Note the permissions on scmanager are being replaced. Setting security credentials is not additive. That’s why we needed to copy the existing permissions.
sc sdset scmanager "D:(A;;CC;;;AU)(A;;CCLCRPRC;;;IU)(A;;CCLCRPRC;;;SU)
(A;;CCLCRPWPRC;;;SY)(A;;KA;;;BA)(A;;CCLCRPRC;;;S-1-5-21-214A909598-1293495619-13Z157935-75714)S:(AU;FA;KA;;;WD)(AU;OIIOFA;GA;;;WD)"
3. Provide access to the Registry keys used by
Spotlight
NOTE:This is step 3 of the procedure for how to Configure WMI with minimum required user permissions.
Spotlight Useris the windows user that will be used in the connection to the Windows server and/or Windows host of the database connection. For more information, seeConfigure | Connectionson page 46.
On the Windows server and/or Windows host of the database connection in RegEdit open the following nodes. HKEY_LOCAL_MACHINE\SYSTEM\CurrentControlSet\Control\Session
Manager\Environment
HKEY_LOCAL_MACHINE\SYSTEM\CurrentControlSet\Control On each node
1. Right click and selectPermissions. 2. Add theSpotlight User. OK.
3. Select theSpotlight User. SelectRead access.
4. Run Windows Component Services
NOTE:This is step 4 of the procedure for how to Configure WMI with minimum required user permissions.
Spotlight Useris the windows user that will be used in the connection to the Windows server and/or Windows host of the database connection. For more information, seeConfigure | Connectionson page 46.
Configure COM security
1. From the Component Services dialog clickComputers | My Computer. 2. Right clickMy Computerand selectProperties.
3. From the Properties dialog, clickCOM Security. 4. From Access Permissions, clickEdit Limits.
a. Add theSpotlight User. b. AllowRemote Access.
c. Click OK to close the Access Permission dialog and save changes. 5. From Launch and Activation Permissions, clickEdit Limits.
a. Add theSpotlight User.
b. AllowRemote LaunchandRemote Activation.
c. Click OK to close the Launch and Activation Permission dialog. 6. Click Ok to close the Properties dialog and save changes.
Configure DCOM security
1. From the Component Services dialog double clickComputers | My Computer | DCOM Config | Windows Management and Instrumentation.
2. Right clickWindows Management and Instrumentation | Properties. 3. ClickSecurity | Launch and Activation Permissions | Edit.
a. Add theSpotlight User.
b. AllowRemote LaunchandRemote Activation.
c. Click OK to close the Launch and Activation Permission dialog and save changes.
4. Click OK to close the Windows Management and Instrumentation Properties dialog and save changes.
5. Configure WMI permissions
NOTE:This is step 5 of the procedure for how to Configure WMI with minimum required user permissions.
Spotlight Useris the windows user that will be used in the connection to the Windows server and/or Windows host of the database connection. For more information, seeConfigure | Connectionson page 46.
From the Windows command prompt, typewmimgmt.mscand click Enter to open the WmiMgmt dialog. 1. Right clickWMI Control (Local) | Properties.
5. ClickAdvancedto open the advanced security settings for this WMI namespace. Add theSpotlight User. ClickEdit. Allow:
l Execute Methods l Enable Account l Remote Enable l Read Security
Ensure these permissions apply to this namespace and all the namespaces under it by selectingThis namespace and subnamespacesin theApply todrop down box.
Click OK to save the new permissions.
6. Click OK to close the Advanced Security Settings dialog. Click OK to close the Security for ROOT dialog. 7. Returning to theRootnode, selectDEFAULT.
8. Click theSecuritybutton to open security settings for DEFAULT. 9. ClickAdvancedto open the advanced security settings.
Add theSpotlight User. ClickEdit. Allow:
l Execute Methods l Enable Account l Remote Enable l Read Security
Ensure these permissions apply to this namespace and all the namespaces under it by selectingThis namespace and subnamespacesin theApply todrop down box.
Click OK to save the new permissions. 10. Click OK to close all dialogs.
Windows domains
Spotlight can only connect to Windows servers and databases hosted on Windows servers in a domain. Spotlight cannot connect to Windows servers in a workgroup.
To use Windows Authentication to connect to a SQL Server, and the SQL server is in a different domain to the Spotlight Diagnostic Server, the domain that the Spotlight Diagnostic Server account resides in must be trusted by the Domain that the SQL Server is in.
Enable disk counters
Spotlight on SQL Server cannot display some disk information properly unless the Windows server being monitored has disk performance counters enabled. This affects the Disk Activity component on the home page, various I/O charts on the SQL I/O Activity tab and Windows Activities drilldowns, and disk graphs on the
Databases drilldown.
Spotlight on SQL Server raises the Disk Counters alarm if it detects that disk counters are not enabled on the Windows server being monitored.
To enable disk data collection
1. Open a command line window on the Windows server. 2. Type the following at the command prompt: diskperf -y 3. Restart the Windows server.
Network ports and Windows connections /
Windows hosts
Data must be retrievable over your network
The port connection to the SQL Server must be open for data to be retrievable over the network
TCP/IP 1433 by default
How to limit the number of ports used
by WMI
Windows WMI uses the RPC and DCOM subsystems in Windows. The ports that are used in WMI are
auto-negotiated between hosts. In order to effectively use WMI between fire walled hosts, you can limit the number of ports used by the DCOM subsystem and only open those ports.
The following outlines instructions to limit the number of ports that DCOM will use. Follow these instructions on each monitored host.
1. Open regedt32.exe
2. Navigate to HKEY_LOCAL_MACHINE\Software\Microsoft\Rpc 3. If there is no subkey titled "Internet", create one.
4. Inside the Internet key, create a REG_MULTI_SZ value named "Ports". Each line of the Ports value should specify a range of ports available to DCOM. For this example, add a single line that reads "3000-3100". 5. Add a new REG_SZ value named "PortsInternetAvailable", set it to "Y"
6. Add a new REG_SZ value named "UseInternetPorts", set it to "Y"
7. Open up TCP port 135 to internal traffic. (It may also be necessary to open up UDP 135) 8. Open up the DCOM port range (e.g. 3000-3100) to internal traffic.
See the following link for more information:
Troubleshooting WMI
Spotlight on SQL Server uses WMI queries to retrieve performance counter information from the Windows server on which SQL Server is running. Spotlight needs access to this information before it can connect to the Windows host and the SQL Server running on the Windows host.
WMI Test 1
This test checks that requests are reaching WMI. Run this test from the Windows server being monitored.
1. ClickControl Panel | Administrative Tools | Event Viewerto open the Event Viewer. 2. ClickView | Show Analytic and Debug Logsto select this menu option.
3. ClickApplications and Service Logs
4. Click to expandMicrosoft | Windows | WMI-Activity 5. Right clickTrace | Enable Log.
Tip: To save log entries, right clickTrace | Save All Events As.
6. If nothing is displayed then the request never reached WMI. The issue is a security or networking issue. If events with error messages are displayed then those events can be investigated. If you encounter WMI errors: For more information, seeWMI errorson page35.
WMI Test 2
This test checks that Microsoft tools can connect to WMI. Run this test from the Spotlight Diagnostic Server.
1. Login to the Spotlight Diagnostic Server under the account used to run the Spotlight Diagnostic Server. 2. ClickControl Panel | Administrative Tools | Computer Management.
3. Right clickComputer Management (Local) | Connect to another computer.
4. Specify the \\HOSTNAMEwhereHOSTNAMEis the name of machine you want to monitor with Spotlight. 5. ClickServices and Applications.
6. Right clickWMI Control | Propertiesto open the WMI Control Properties dialog. 7. Ensure theGeneraltab is open.
If successful, try to monitorHOSTNAMEwith Spotlight again.
WMI Test 3
If you encounter WMI errors: For more information, seeWMI errorson page35.
1. Run this command on the machine you want to monitor. Run this command locally from the command prompt.
wmic path Win32_PerfRawData_PerfDisk_LogicalDisk get FreeMegabytes
2. Run either of the following commands on the Spotlight Diagnostic Server.
wmic /node:HOSTNAME/user:DOMAIN\USERpath Win32_OperatingSystem get BuildNumber, Caption, CSDVersion, Version
or
wmic /node:HOSTNAME/user:DOMAIN\USERpath Win32_PerfRawData_PerfDisk_LogicalDisk get FreeMegabytes
HOSTNAME Identify the host computer you want to monitor with Spotlight. Use the fully qualified domain name, machine name or IP-address.
DOMAIN\USER Valid Windows login credentials.
WMI errors
The following is a guide to troubleshooting WMI errors.
Error Solution
The RPC server is unavailable. Exception from HRESULT: 0x800706BA
Spotlight on SQL Server is not able to establish a connection with the Windows server to be monitored.
Verify the following:
l The address of the server is entered correctly.Verify correct host name or IP
address. For more information, seeConfigure | Connectionson page46. Verify the host is available (not currently shut down).
l The Remote Procedure Call (RPC) service is running on the Windows server to be
monitored.Verity that "Remote Procedure Call (RPC)" is running and set to auto start after restart.
l TCP Port 135 is open to internal traffic on the Spotlight Diagnostic Server and
the Windows server to be monitored.
WMI opens an undetermined port in addition to port 135. This can be troublesome in a firewalled environment. Specifying a port range for WMI is recommended for this type of environment. For more information, seeHow to limit the number of ports used by WMIon page33.
Error Solution
Follow these steps to enable remote administration exception. On the Windows server to be monitored:
1) Open the Group Policy Object Editor (gpedit.msc), open Computer Configuration | Administrative Templates | Network | Network Connections | Windows Firewall 2) Open either Domain Profile or Standard Profile, depending on which profile you want to configure.
3) Enable the following exceptions: "Allow Remote Administration Exception" and "Allow File and Printer Sharing Exception".
http://msdn.microsoft.com/en-us/library/aa389286(VS.85).aspx
l The "TCP/IP NetBIOS Helper" service is running.Verity that "TCP/IP NetBIOS
Helper" is running and set to auto start after restart.
l The "Windows Management Instrumentation" service is running on the Windows
server to be monitored.Verity that "Windows Management Instrumentation" is running and set to auto start after restart.
Access is denied. Exception from HRESULT: 0x80070005 (E_ ACCESSDENIE D)
The Windows user specified is unknown to the Windows server or does not have administrator rights.
For more information, seeWindows account permissionson page28.
WMI connection time outs
The timeout value defaults to the value DCOM specifies (usually 60 seconds). You can adjust this value via dcomcnfg.exe
WMI query failed: Invalid class. [0x80041010]
The WMI class does not exist on the Windows server being monitored. Solution: Recreate the WMI classes.
Windows Connections
Either of the following will recreate the WMI classes:
l Open a command prompt window and run the following command:
wmiadap /f
l Use the Microsoft Extensible Counter List (Exctrlst) utility to enable the following
counters:
Win32_PerfDisk, Win32_PerfNet, Win32_PerfOS and Win32_PerfProc.
http://www.microsoft.com/downloads/details.aspx?displaylang=en&familyid=7FF996 83-B7EC-4DA6-92AB-793193604BA4
Error Solution
SQL Server Analysis Services Connections
Either of the following will recreate the WMI classes:
l Open a command prompt window on the server hosting the SQL Server Analysis
Services instance. Run the following command: wmiadap /f
l Unregister and re-register the WMI classes. To do so:
1. On the problematic machine with SQL Server Analysis Services installed, find out the SQL installation path. See below for the default installation path. Your installation path may be different.
SQL Server Analysis Services 2014 C:\Program Files\Microsoft SQL
Server\MSAS12.MSSQLSERVER\OLAP\bin\Counters SQL Server Analysis Services 2012
C:\Program Files\Microsoft SQL
Server\MSAS11.MSSQLSERVER\OLAP\bin\Counters SQL Server Analysis Services 2008
C:\Program Files\Microsoft SQL
Server\MSAS10.MSSQLSERVER\OLAP\bin\Counters SQL Server Analysis Services 2005
C:\Program Files\Microsoft SQL Server\MSSQL.2\OLAP\bin
Note:You are looking for the folder that contains the following files: For unamed instances:
MSSQLServerOLAPService
perf-MSSQLServerOLAPServicemsmdctr.ini For named instances:
MSOLAP$Your_SSAS_NamedInstanceName
perf-Your_SSAS_NamedInstanceNamemsmdctr.ini
If you need to check the named instance name, use services.msc. 2. At the command prompt, change folder to the installation path.
For example, cd C:\Program Files\Microsoft SQL Server\MSAS10.MSSQLSERVER\OLAP\bin\Counters
Error Solution
instances lodctr perf-MSSQLServerOLAPServicemsmdctr.ini named
instances
unlodctr MSOLAP$Your_SSAS_NamedInstanceName
lodctr perf-Your_SSAS_
NamedInstanceNamemsmdctr.ini
Tip:ReplaceYour_SSAS_NamedInstanceNamewith the SQL Server Analysis Services named instance name. If you need to check the named instance name, use services.msc.
4. Run the following command to parse all the performance libraries on the Windows server and refresh the performance counter classes on the Windows server:
wmiadap /f
5. Use wbemtest.exe to verify the WMI Classes exist. WMI query
failed: Invalid query. [0x80041017]
The columns returned by the WMI class are incomplete or unexpected.
Solution: On the Windows server to be monitored, update the WMI classes by running the following command at the command prompt.
wmiadap.exe /f
Seehttp://msdn.microsoft.com/en-us/library/aa394528(VS.85).aspxfor more information. 0x80014064
User credentials cannot be used for local connections
This error occurs when wmic command is executed locally on the target machine and credentials specified
[0x800705af] The paging file is too small for this operation to complete. You may find the following link useful:
http://blogs.technet.com/b/kevinholman/archive/2010/06/09/wmi-leaks-memory-on-server-2008-r2-monitored-agents.aspx
WMI query failed: Out of memory. [0x80041006]
1. At the command prompt run "wbemtest"
2. Connect to the "root" namespace (not "root\default", just "root") 3. ClickOpen Instance. Specify "__ProviderHostQuotaConfiguration=@" 4. SelectLocal Onlyfor easier readability. You will see the threshold values.
5. Increase the MemoryPerHost value to something greater. For example, double it (256 MB)
6. Save Property 7. Save Object 8. ClickExit.
Error Solution
9. Restart WMI services.
Invalid verb The wmic command has attempted to access a WMI class that does not exist. Solution: Check the spelling of parameters on the wmic command.
Invalid Global Switch
The specified host, user or domain name contains special characters like '-' or '/'. Solution: Modify the command by adding quotation marks.
wmic /node: 'MonHostFQDN' /user: 'DOMAIN\USER' path Win32_PerfRawData_PerfDisk_ LogicalDisk get FreeMegabytes
Monitoring the Spotlight Diagnostic Server
To monitor the Windows server that hosts the Spotlight Diagnostic Server, Windows requires that the Spotlight connection use Windows authentication.InConfigure | Connectionswhen creating / editing a Windows connection to the Spotlight Diagnostic Server host, select theUse Diagnostic Server credentialsoption.
12
Installation and upgrade
Permissions required during installation
Spotlight requires write access to the following folders
l The Spotlight installation folder
l Default for the Enterprise Edition Spotlight client (32bit):
C:\Program Files\Dell\Spotlight on SQL Server
l Default for the Enterprise Edition Spotlight client (64bit):
C:\Program Files (x86)\Dell\Spotlight on SQL Server
l C:\Program Files\Common Files\Quest Shared
Windows 7 / Windows 2008 Server / Windows Vista
l C:\ProgramData\Quest Software\Spotlight
Windows 2003 Server
l C:\Documents and Settings\All Users\Application Data\Quest Software\Spotlight
Elevated privileges
In many cases, the Spotlight installer will run at elevated privileges in order to perform the required actions. These privileges can specifically be allowed or disallowed by system administrators by means of standard Microsoft Installer (MSI) policy settings.
If the Spotlight Diagnostic Server user does not have privileges to start services, that privilege is granted by Spotlight during the installation process, if possible.
Multiple users of a system
If multiple users of a system install Spotlight for use, the additional users must be local administrators.
Install
Run the Spotlight on SQL Server Enterprise installation executable.
The Welcome screen presents a range of options beginning with the two types of installation: typical and compact. During installation you will be prompted to supply details for the Spotlight client, Spotlight Diagnostic Server and Playback Database.
Table 8: Types of installation
Typical Select to install the Spotlight on SQL Server client and/or Spotlight Diagnostic Server. Compact Select to install the Spotlight on SQL Server client and Spotlight Diagnostic Server on the local
computer.
Table 9: About the Spotlight client installation
Component Description
Install location Default installation folder (32 bit system)
C:\Program Files\Dell\Spotlight on SQL Server Default installation folder (64 bit system)
C:\Program Files (x86)\Dell\Spotlight on SQL Server
NOTE:Do not install the Spotlight client in the same location as an existing (but different entity of) Spotlight.
If you install a different Spotlight after you have installed Spotlight on SQL ServerEnterprise, do not install the new Spotlight in the Spotlight on SQL ServerEnterprise directory.
Table 10: About the Spotlight Diagnostic Server installation Component Description
Install location
Default installation folder for the Diagnostic Server (32bit and 64bit systems): C:\Program Files\Dell\Diagnostic Server
During a Typical install the diagnostic server can be installed on a computer networked to this computer.
Diagnostic Server Account
The Spotlight Diagnostic Server will run under the specified account. Enter a domain user account or select the local system account.
NOTE:
l When installing the Spotlight Diagnostic Server, Windows administrator
privileges are required to register the Spotlight Diagnostic Server as a Windows service and to create the Windows user groups that are used to authenticate Spotlight clients.
l When installing the Spotlight Diagnostic Server on a remote machine, the
Component Description
Windows administrator privileges on the Spotlight Diagnostic Server host and can be authenticated on the Spotlight client machine. The user is added to all Spotlight Diagnostic User Groups.
l If the user does not have privileges to start services the required privileges are
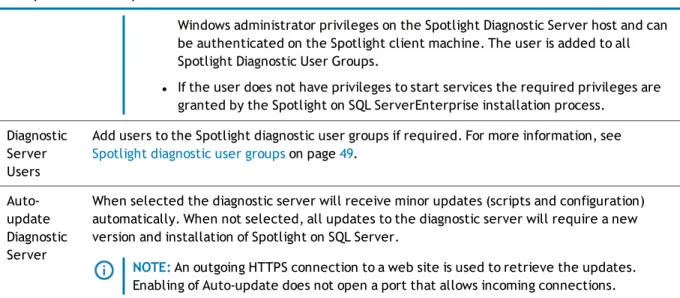
granted by the Spotlight on SQL ServerEnterprise installation process. Diagnostic
Server Users
Add users to the Spotlight diagnostic user groups if required. For more information, see Spotlight diagnostic user groupson page49.
Auto-update Diagnostic Server
When selected the diagnostic server will receive minor updates (scripts and configuration) automatically. When not selected, all updates to the diagnostic server will require a new version and installation of Spotlight on SQL Server.
NOTE:An outgoing HTTPS connection to a web site is used to retrieve the updates. Enabling of Auto-update does not open a port that allows incoming connections.
Table 11: About the Playback Database installation Component Description
Instance Select the Windows server to install the playback database on. The Playback database can be installed on the same server as the Spotlight client and Spotlight Diagnostic Server or a different server.
Authentication Select Windows or SQL server authentication.
Database Optionally rename the database. The default name isSpotlightPlaybackDatabase. If the database has not already been created, clickCreateto create the database.
Upgrade
You can upgrade only from Spotlight on SQL Server Enterprise10.5 or 10. If you are using an earlier version of Spotlight, upgrade to 10 before upgrading to 11.
To upgrade Spotlight on SQL Server Enterprise
1. Back up theDiagnostic Server\Agentdirectory. C:\Program Files\Dell\Diagnostic Server\Agent
2. On each Spotlight client, run the Spotlight on SQL ServerEnterprise executable. NOTE:
l The playback database and Spotlight Statistics Repository are upgraded automatically.
l Your enterprise may have multiple Spotlight clients. Ensure all Spotlight clients are included in
the upgrade process. If the Spotlight client and Spotlight Diagnostic Server are running different versions of Spotlight on SQL Server Enterprise, the client will be unable to connect to the Spotlight Diagnostic Server.
l Spotlight on SQL ServerEnterprise and Spotlight on SQL ServerStandard are separate products.
You cannot upgrade from Spotlight on SQL ServerStandard to Spotlight on SQL ServerEnterprise.
Monitoring your Spotlight on SQL Server connections on a
mobile device
If you have monitored your Spotlight on SQL Server connections on a mobile device in the past and intend to continue then the following additional upgrade instructions are required.
1. Uninstall theSpotlight Web PublisherviaWindows | Control Panel | Programs and Features. The Spotlight Web Publisher was required in the past to monitor SQL Server connections on a mobile device. It is now important that you uninstall it. By default the Spotlight Web Publisher was installed on the same computer as the Spotlight Diagnostic Server.
2. Start Spotlight. ClickConfigure | Spotlight Essentials. SelectUpload mobile monitoring data to Spotlight Essentials. Ensure your Spotlight Essentials account details are correct.
Preservation of configuration information
The following information on the Spotlight Diagnostic Server is preserved when you upgrade:
l Connection properties for all monitored servers (including changes to scheduling and alarms) l Enterprise views
l Collection properties
l Alarm Actions (These include running a program and sending an email.) l Planned Outages
l Global options such as user-created Error Log rules
l Configuration information for the Spotlight Statistics Repository (this applies only if you installed the
Spotlight Statistics Repository from an earlier version of Spotlight on SQL Server Enterprise) and the playback database.
Uninstall
Multiple Spotlight clients and servers may be involved. Uninstall the Spotlight Diagnostic Server before you uninstall all Spotlight clients.
1. Uninstall the Spotlight Diagnostic Server
For the Windows server on which the Spotlight Diagnostic Server is installed: 1. OpenWindows Control Panel.
2. Uninstall Spotlight on SQL Server Enterprise Clients
Repeat for each Windows server on which a client is installed: 1. OpenWindows Control Panel.
2. SelectPrograms and Features
3. SelectSpotlight on SQL Server Enterpriseand clickRemove.
The Playback Database and Spotlight Statistics Repository
The Playback Database and Spotlight Statistics Repository are not removed when Spotlight is uninstalled. You may delete them independently. You may use the Playback Database again with another Spotlight installation.
13
Configure
Configure Spotlight for your enterprise. Select options from theConfigureribbon.
Icon Ribbon Select
Description
Connections Add and delete monitored connections. Configure properties of monitored connections.
Alarms Configure the thresholds and severities that determine when alarms are raised.
Alarm Actions
Setup actions for Spotlight to take when an alarm is raised. The actions Spotlight can take include running a program and sending an email. Conditions on taking the action can be defined, such as the day of the week, the time of day, the severity of the alarm, the alarm type and the connection type.
Scheduling Schedule data collections.
Planned Outage
Enter the scheduled maintenance times for monitored connections. Spotlight will treat monitored connections as unavailable at the scheduled times, so will not raise alarms or collect data during the outage period.
SQL Analysis Configure the filters used to gather SQL Analysis data.
SQL Server Response Time
Define the SQL statement that is used to measure response time.
Custom Counters
For monitoring connections to SQL Server and Windows servers, create and configure Custom Counters.
Error Log Entries
Define the SQL error log entries for Spotlight to alarm on.
Monitored Files
For monitoring connections to Windows servers, track the growth of certain (log) files.
Configure | Connections
Add and delete monitored connections. Configure properties of monitored connections. 1. ClickConfigure | Connections.
2. Select the connection type. 3. ClickAdd a new connection.
Configure the Playback Database
The playback database stores recently collected data. Storing playback data allows Spotlight to show both current and recent data and lets you replay the behavior of a monitored connection.
NOTE:Each Spotlight Diagnostic Server requires its own playback database.
To store playback data
1. ClickConfigure | Diagnostic Server.
2. SelectConfigure the Playback Database. 3. Complete the following:
Option Description
Instance Type or select the name of a SQL Server to host the playback database. Clicking the down arrow displays a list of available instances.
NOTE:Due to the size of the playback database, it is recommended that this database is not installed on a SQL Express instance. The playback database cannot be installed on SQL Server 2000.
Store playback data forndays
Specify the number of days you want Spotlight to store playback data.
The number of days specified corresponds to the number of days of history available to Playback. The default is seven days. The minimum is two days.
Windows authentication
Select this option to connect to the playback database using the Spotlight Diagnostic Server credentials, that is the credentials of the user logged in to the Spotlight client.
SQL Server authentication
Select this option to connect to the playback database using SQL Server credentials and then complete the User and Password fields.
l User– A valid user that enables Spotlight to connect to the instance hosting
the playback database.
Option Description
instance hosting the playback database.
Database The name of the playback database. The default database is SpotlightPlaybackDatabase.
Create If you want your playback database to have a different name to the default, type a new name in the Database field before you click theCreatebutton.
To create a new playback database, clickCreateand enter the authentication details required to create the playback database. The authentication details must have permissions to create databases.
Configure the Spotlight Statistics
Repository
NOTE:This feature is available only in Spotlight on SQL Server Enterprise.
Spotlight uses a repository to store archived data.
For information on disk space requirements:- SeeSpotlight Statistics Repository You can reduce the size of the repository by:
l Limiting the number of collections archived l Reducing how often data is collected l Reducing the data retention period.
See "Schedule Data Collection" in the online help for information on the options that affect the size of the repository.
You can install a new repository on any computer system that has a SQL Server 2005 instance or later running, or select an existing data repository to use.
NOTE:Due to the size of the Spotlight Statistics Repository, it is recommended that this database is not installed on a SQL Express instance. The Spotlight Statistics Repository cannot be installed on SQL Server 2000.
To configure the Spotlight Statistics repository
1. ClickConfigure | Diagnostic Server.
2. SelectConfigure the Spotlight Statistics Repository. 3. Complete the following options: