Plankton production and its control
36
0
0
Full text
(2) 408. H. W. HARVEY, L. H. N. COOPER, M. V. LEBOUR AND F. S. RUSSELL.. portions filtered for estimation of pigment and of phosphorus content of the plankton, other portions being kept for counting the animals and plants. At the same time water samples were taken from various depths fOTthe estimation of the phosphate and salt content of the water, and determination of the temperature. Figure 1 shows the number of animals caught per cubic metre of sea on the various occasions throughout the year when observations were made. It also shows the units of plant pigments in the phytoplankton ~. .., TOOF. :.. PLANT PIGMENTS PER CU. MET.... " .'.'. NUMBER OF ANnw.s. PER CU. METRE. 0\. :,.\. ,., ,., ,,, '.'. 3000. 6000. , '. " ff. I. I. Ii "". 2000. ! ''. ::. , I, '. !:. :. :''''.'~ JJ\ ". 1,. ". \,'". \.!. 1000. \. \:". I. /', I'" \. 4000. " : '"\. :,,' ~ ""'.'1 "" " ,.,..'. 1II. .. ~. q. '. .. I'. ,',' !'-. \. \ / ~. ;. A R. ' ' ,':' '" f1 I "',, / ,.,." ' I . : ' \ .. .. :. 2000. "--J. ~. m. ~. ill. -. ~. -. ~. ill. ~. m. ~. FIG.. I.-Points joined by continuous line represent the units of plant pigments per cubic metre of water, in the water column between surface and 45 metres at Station L4. Circles joined by dotted lines represent number of animals per cubic metre. The lines joining the points and circles have no real significa.nce. Year 1934.. caught in the net per cubic metre of sea. It is noticeable that the changes in plant population are much greater and more sudden than the changes in the animal population. THE GENERAL HYDROGRAPHIC CONDITIONS.. In order to interpret the changes in plant and animal population through the year, it is necessary to consider, at least, movements of the water into and out of the area, also the seasonal changes in both temperature and available nutrient salts. Concerning the first we have little definite knowledge. The position L4 lies outside the belt of inshore water which is considerably diluted by run off from the land and has a different type of seasonal change in flora from offshore waters. It lies inside the northern edge of an area of.
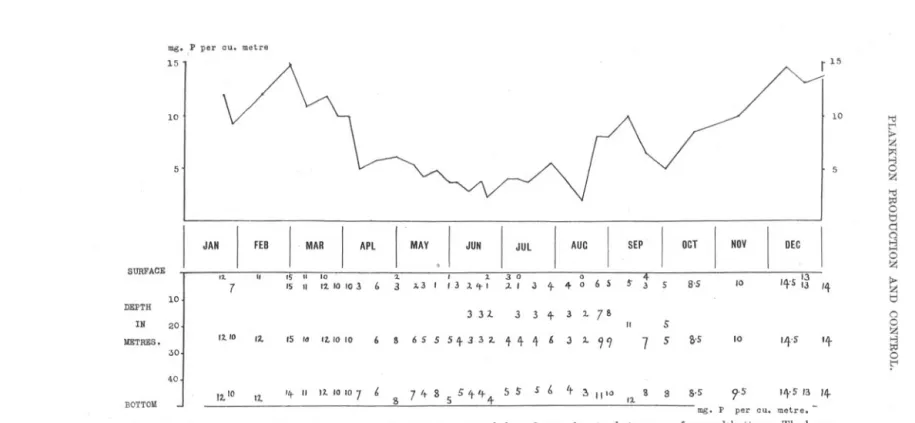
(3) PLANKTON. PRODUCTION. AND. CONTROL.. 409. water, gradually increasing in salinity and depth to the southward, which is not usually subject to considerable or rapid changes. Further to the southward, 50 or more miles distant from L4, variable and temporary inflows of water from the Atlantic are most apparent, but on occasions these changes extend further north. The water occupying the L4 area does not remain there all the year round. Marked changes in salinity sometimes take place and drift bottles, both surface and bottom, have been found to work up Ohannel and down Ohannel. Movements and changes are quite irregular, and it would require a close and extensive network of observations to follow them. Nevertheless it seems that, usually, the water entering the area has moved in from areas of similar depth where the plants and animals had been subjected to similar conditions. It follows that the samples taken at L4 may mostly be considered as chance samples of the flora and fauna over a more or less wide area where their conditions for growth have been similar. This element of uncertainty is inherent in any such series of observations made at a position in the open sea, for movements of the water masses are everywhere taking place. On account of this, comparison of the seasonal changes in flora and fauna and of the conclusions drawn from them with similar data in a semi-enclosed area, less subject to such waterchanges, such as Loch Striven, are particularly useful. In Figures 2 and 3 the changes in salinity and temperature of the water at L4 are shown. Full data will be published in the Bulletin Hydrographique for 1934. The phosphate contents of water collected at L4 are shown, to the nearest milligram of phosphorus per cubic metre, on the lower diagram in Figure 4, while the curve above shows the integral mean content of the whole column of water from surface to bottom expressed in terms of mg. P per m3. The winter of 1933-1934 was unusual, there was less phosphate in the water than in some previous years, the quantities fluctuating irregularly. During February, 1934, moving masses of water containing between 10 and 15 mg. Pfm3.-a rather low value for the time of year-occupied the area. During the latter part of the month, during March and early April, a decrease took place and the area became occupied with water containing 5 mg. Pfm3. We do not know that this mass of water occupied a similar coastal position subject to similar conditions for plant growth in February, but from its salinity this seems probable. We do not know that in February it contained a similar quantity of phosphate-1O to 15 mg. Pfm3-as the water then in the L4 area, but since this quantity is lower than usual in previous years, we can conclude that the phytoplankton had utilised at least some 6 mg. P fm 3. during the period of its spring flowering, and possibly as much as 8 mg. Pfm3..
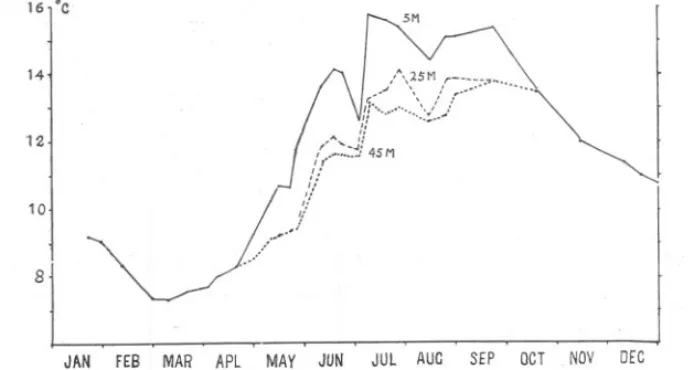
(4) 410. H. W. HARVEY,L. H. N. COOPER,M. V, LEBOURAND F. S. RUSSELL.. From the middle of April until the middle of August there is a further fall in dissolved phosphate, amounting to some 3 mg. Pfm3. During July a temporary increase occurred, perhaps due to the incursion 'of water richer in phosphate or perhaps indicating the beginning of regeneration;. . AUG' SEPT FIG. 2.-Isopleth. diagram representing the changes in salinity of the water between surface and bottom at L4 during 1934.. further to seaward at E1 an increase in phosphate in the bottom waters has been observed during July (Atkins, 1926). During the latter part of August a rapid increase in phosphate took place as the rate of regeneration outstripped the rate at which phytoplankton was utilising it. This continued until the September outburst of diatoms which synchronised with a decrease in phosphate. 16,'C. 14. A 25M. '. " 11<:':.:::::::~:~j"--'-' :i ,,-A'-Jf ~_.- 4SM ,,-. 12. '". f! ,.;-. 10 /. 1. ~. 8. JAN. FES MAR. FIG. 3.-Temperature. APL. MAY. JUN. JUL. AUG. SEP. OCT. NOV. DEC. of the water at 5, 25 and 45 metres depth at L4 during 1934.. The estimations of dissolved phosphate were made by means of the Atkins-Deniges method with the modification that half the customary concentrations of acid and molybdate were used (Kalle, 1934). A correction has been applied for salt error, the observed concentrations of phosphate being multiplied by the factor 1.13, as found by Kalle using a. photometer and confirmed here using direct visual colour comparison..
(5) mg. ,P per cu. metre 15. 10. 10. ~ ..., 0 Z "ti !;d 0 t:j c:j C. 5. JAN I SURFACE. FER I. IN. APL. ". I. 15 11 10 15 II 12.10 10. a. 2.. (,. 3. MAY.. ,. 2.. ,\,3 I I 3 :l't I. ~ 0. NOV. 8'5. '0. '4'5. 5. 8'5. 10. '4'5. 't. 8. &.5. 9'5. '4'5/3. 14-. SEP. J 4- 4- 0 6 5. !. 5. 7 S. I. OEC. I. I. 1. OCT. I. AUC. JUL. JUN I. 7 DEPTH. MAR I. 3 0. ;1.,. 0. !;. i. '4. 1C. 3 32.. 3. 3 4- 3 2. 78. 20. 12.'0. IlETHES.. 1:1.. .5 I.. It /010. '4- II. 12.10107. 6. 8. 65554-33:1.. 8. 74855'1''1-455. 30. II. t 4 4 (, J :t. 99. "ti t< i> Z. S. Z i> Z t:j c 0 Z ~ 0 !:". 40 BOTTOII. 12.'0 11.. 5. It. 11'0. 12.. mg. P per cu. metre. -. FIG. 4.-The upper curve, shows the average phosphate content of the column of water between surface and bottom. Thelower diagram shows the phosphate found in the various samples. In both the phosphate is expressed as mg. P per cubic metre. H>I-' I-'.
(6) 412. H. W. HARVEY, L. H. N. COOPER, M. V. LEBOUR AND F. S. RUSSELL.. The method of determining phosphorus in plankton has already been described (Cooper, 1934). SEASONAL VARIATION IN ILLUMINATION.. The daily production of vegetation is dependent upon the day to day population of growing plants and the light energy available for photosynthesis over the 24-hour period. It is further influenced by temperature, by the concentration of nutrient salts, and it doubtless varies with fo 15. 10. 5. . JAN FIG. 5.-The points illumination. MAR. MAY. JUL. SEP. NOV. on the curve show for each month the percentage of the total which fell throughout the whole year (W. R. G. Atkins).. the species of plants present, some diatoms being quicker growing than others. Of these factors the quantity of available light plays a marked and considerable part. Some knowledge of its change in magnitude during the course of the year is consequently necessary in order to interpret the data obtained during this survey. During 1930 the light falling on the roof of this laboratory was measured, and the total illumination for each month is plotted in Figure 5 in terms of the total illumination during the whole year (Atkins, unpublished data). The curve is distinctive. A similar amount of light energy reaches the sea.
(7) PLANKTON. PRODUCTION. AND. 413. CONTROL.. each month during April, May, June, July and August. This amount is nine times the amount reaching the sea in December and January. It does not follow that the quantity of light available for photosynthesis in the sea is nine times more in summer than in winter. In a position such as L4 where the water is tolerably clear, about one-half of the light entering the surface penetrates to a depth of 5 metres, a quarter 0. O2. .. .. 10 161. ,.,,-. 20. 30. 40. FIG. 6.-The points show the oxygen produced by a litre of diatom culture suspended in the sea at various depths over a period of 24 hours, July 12-13 and 19-20 (Miss P. M. Jenkin).. to 10 metres and an eighth to 15 metres. Hence the quantity of light penetrating below the 16 metre level in summer is comparable to the quantity entering the water at the surface in winter. The production of vegetation, or plant material, by the same number of diatoms has been investigated over 24-hour periods in July at different levels in the L4 area (Miss P. M. Jenkin, private communication). This shows that if the diatom population was evenly distributed between surface and bottom the production of vegetation would be related to depth in the manner shown in Figure 6. With the diatoms used in the experiments.
(8) 414. H. W. HARVEY, L. H. N. COOPER, M. V. LEBOUR AND F. S. RUSSELL.. TABLE T. Jan. Feb. 29 12 Bacillaria paradoxa. Biddnlphia. B. sinensis. mobiliensis. March. 9 20. 1. . 240 396 2,483 41. 18. 43. 97 103. 576. 22 16 41 50. B. regia . Chretoceros sp. C. decipiens. -. C. danicns C. didymus. -. C.denaus C. curvisetus C.teres. -. 27 -. -. -. -. C. debilis.. 4. -. 26. -. 6. 26. -. 340 1,035 82. 516 1,200. 25. -. -. C.radiatus. C. concinnus Dytilium brightwelli Eucampia zoodiacus Gyrosigma'sp. Guinardia llaccida. 39 2 52. Hyalodiscus stelliger: Nitzschia seriata N. delicatissima. 4 86. Paralia suleata. Rhizosolenia alata. 86 2. -. -. R. alata,var.indica. R. shrubsolei R. frercensis(1) R. setigera. 6 -. -. R. stolterfothii.. R.robusta R.styliformis Skeletonema. :. costat. Sehroderella schroderi Thalassiosira gravida T. subtilis T. decipiens. Thalassiothrix ';itzschioide Phreocystis Actinoptychus. ;"'dultus:. Asterionella japonica Ceratau1jna bergonii Lauderia borealis Navicula membranaea. Stephanopyxis pahneriana Streptotheca thamensis Leptocylindrus danicus Navicula sp. Noetiluca Nitzschia elostrium Ceratium furea C. fusus . Peridinium conicum:. P. depressum . P. ovatum Gymnodinium lunula Prmoeentrum micans Dinophysis sp.. 48. .. -. 2 -. 50 30. 13 40. 14 39. -. -. -. -. 288. 307. 8. 38. 262 8. 38. 91. 10. -. 10 -. -. 3. -. -. -. 190. 60. -. 40 12 133. 4 19. 675. 163. 4. 4. 154. -. -. 79. 34. 125. -. 96. 23. 40 73. 10 25. -. 43 13. 3 557 10 382. 5. -. 82 400. 59. -. -. -. -. -. 7 10 -. 131 5,500. 785. -. 33 786 793. 14 570 332. 82. 75. -. 15 125. -. -. 179 50,600. 218 279 150. 175 26. 19. 198. -. -. 91. -. -. -. 11 6. -. -. 13. 32. 6 202 3 106. 3. 30. 7. -. -. -. 416 1,305. -3. 29 108. 39 3 7. 208 -. -. 304. 11. -. 3. 130. 382. 215. 7 30. -. 78 -. 52. -. -. 74. 176. -. 520. 66. 52. 7. -. -. -. 15. -. 115. 55. -. 354. 109. -. -. -. -. - 15,300 142 5,240 10,200 350 5 435 168. 6. -. -. -. -. -. 254 -. -. -. -. -. -. -. -. 42. 33 4,600. -. -. -. 34. -. 75. 22 15. -. -. 96. -. 42. 6 608. 37. 125. 23. 3. -. 8. -. -3. -. -. 21. 33. 38. 7. 48. 5. 6. 18. 4. 30. -. 10. -. -. 460 1,404. - --. -. 7 2. 5. -. -. 24. -. 565 472 1,840 2,510 3,360 2,470 1,750 215 13. -. -. -. -. 100. 14. 30 53. -. -. 12. -6. 3 7. 23 5 61 1,085 316. -. 25. -. 4 521 4. 4 420 275 430 177. -. -. 6. -. May. 23. 10. 67. -. 15. -. 158 25. 10 50. 10. -. 102 575 180 -. 192. -. 1. 218 3. 49 16. 13. 20. 3 40. 546 71 37. 153. -. 233 274. - .228. -. 25 10 210. 64. 41. 139 1,415 3 41. C. convolntus C. constrictus. C. laciniosus C. mitra . Coscinodiscuse'xcenticus : 117 116 C. granii. 13 9. -. April. 3 20. 26. .241. 66.
(9) PLANKTON. PRODUOTION. AND. 415. OONTROL.. .. NUMBER June. 11. 4.. 18. July. 9 19. 3. 7. 7. -. -. -. -. -. -. -. 27. OF. August. 15 24. 7. 140. OELLS. - 40 - - 3 - - 3. 68. 20. -. 70. 21. - -. 33. 279. -. -. 104. 98. 2,055. 392. -. -. 35. -. 48. 98. -. -. 72. 71. -. -. 850. 9. 12. 330. -. -. -. 4. -- --. 12. -. -. -. --. ---. 8 196. 6. 10. 21. 72. -. -. -. -. -. -. 54 6. 55. 230. 44. 20. 10. 64. 8. -. 44. - --. -. 116. 350. -. -. 640. 243. 18. - 5 54 715. -. 7 1,790. 40 10,350 3.810 7. -. 20. -. -. -. -. -. -. -. 9. -. Sept. 11 21. -. -. -. -. 31. LITRE.. -. -. 147. -. - --. -. -. 80. PER. 415 -. -. --. 1,560 -. -. -. -. -. - 224 342. 28. 4. -8 -. 288 768. -. -. -. -. - 256. 11. -. -. 3. -. .5. 49 126 7. -. -. -. 93. -. 2. -. -. October. Nov. Dec. Jan. 18 31 14 10 1.'35. -. -. -6. 210 167. 95 33. 34. -. -. 790 400 8.800 - 1,715-. -. 1.560. -6. 340. 8.300 3.445 14.300 180. -. 25. -. - 59. 43 10. -. -. 7. 6. -. -. -. 30. 81. -. -. 17. -. 15. 155. -. 6. 22. 30. 310 155. - 268 540. 95. 11. -. 40 2,330 270. -. 80 80. -. -. -6. -5. 68. -. - 50 -w -70 5 6. -. 40. -. -. 6. 6. 6. -. -. 215 4,100. 610. 10. -. 9. -. 76. 6. -. 15. 45. 31. 12. 23. 4. 279. 107. -6. -. 21. 21. 35. 14. 940 -. 54. 243 -. 98. 490 -. 56. 84. 72. -. --. 257. -. --. -. -. -. --. 263. 28. 42. 27. 27. 11. 8. -. 8. -. 14. --. --. 18. q. -. -. -. 50. 48. 30. -. 280 -. -. -- -- -. -. -. 70. -. 100. 10. -. -. 10. -. -. 4. 4 -. 14. -. -6 -6. -- -- --6 - - -. -. -. 12. 31. 6. -. -. -. 6. -. -. -. -. 290 115 - 20 - 65. 204 12. 485. 87. 43 -. 43. -. -. -. 7 66. 188 244. 16. -. 6 6. 6. 4. -. 159. 4. 36.
(10) 416. H. w. HARVEY, L. H. N. COOPER, M. V. LEBOUR AND F. S. RUSSELL.. production took place from surface down to 45 metres. If the quantity of light over the 24 hours had been a ninth of that experienced, then the production would have been that taking place below about 16 metres in the experiments. The total production between surface and bottom in summer and winter is thus roughly proportional to the areas enclosed by the whole curve and by that part of it which lies below 16 metres. In this case the effect of reducing the light to 1/9th would be to reduce the production of vegetation to 43%. In December-January the temperature is some 4° C. colder than in July; if this is taken into consideration (Matthai, 1904) it puts the winter rate of production per 24-hour period at about one-quarter the summer rate. This calculation of relative magnitudes is not of general application, other species of diatoms may have different light requirements for growth and their compensation points may lie at different levels (Nielsen, in press). Moreover, diatoms are not usually distributed evenly between surface and bottom in nature.. THE PLANT POPULATION.. The species and their numbers per litre in the water between surface and the 45-metre level are shown in Table 1. These counts were made by the following procedure. A small quantity of the catch was placed on a slide and covered with a glass slip, the depth of the cell so formed being 1.75 mm. The numbers in the field of a microscope were counted after the diatoms had settled, the slide moved and the numbers in a new field counted. This was repeated in all five times, after which the slide was cleaned and refilled with a further portion of the catch. In this way the plants seen in 50 fields of the microscope, and in 0.194 c.c. of the catch -usually from about one-fifth of a litre of sea-water-were examined and counted. An analysis of several counts carried out in this manner was kindly made for us by Mr. G. M. Spooner and showed the values to have a satisfactory order of accuracy. In this way a record has been obtained throughout the year of the diatoms and peridinians in the water coluum at L4. The net has 200 meshes to the square inch, and when wet the open spaces, roughly rectangular in shape, average 41 X52fL in a new net. * It lets through a proportion of the smaller organisms. For this reason the record gives minimal values, particularly when very small diatoms are at all abundant, and in the summer when diatoms are few and much of the plant life might consist of small cells which pass through the net. Water samples were examined * Henson gives an average of 48.7 f.L for new and 30.6. f.L. for mU<Jh used material..
(11) PLANKTON. PRODUCTION. AND. 417. CONTROL.. by one of us in July and August, by sedimenting and examining the sediment from below, by centrifuging and by making a fine precipitate to carry down small organisms with it and examining this after centrifuging. It appeared that the greater bulk of the chlorophyllaceous matter was in organisms such as were caught in the net. With plants of such greatly differing size no exact relation would be expected between the number of diatoms per cubic metre and the quantity of plant pigments in them. However, if allowance is made for the size of only three species, whose cell contents were small and each of which NU1!J3ER OF DIATOMS /JID D!NO!'!.AeELLATES PER LITRE. WE!eIITED. UNITS OF PLANT P!G1\ENTS PER CU. METRE.. 0. 3000. 12000. 2000. 8000. 1000. 4000. dAN. FER. MAR. MAY. dUl. AUC. SEP. OCT. NDV. DEG. FIG. 7.-The points on the curve show the units of plant pigments per c~bic metre in the water column between surface and 45 metres at Station L4. The circles show the total number of diatoms+ dinoflagellates per cubic metre, the observed number of three species of diatoms being weighted.. was found in preponderating quantity at times between January and September, a clear correlation is seen. Figure 7 shows that the arbitrary "units of plant pigments" found per cubic metre of water and the number of plant cells per cubic metre, weighted so that 20 cells of Skeletonema costatum or 3 cells of Rhizosolenia alata or 3t cells of R. shrubsolei are counted as one" diatom of average cell contents." In September when several species of Chootocerosappear in quantity further weighting would be necessary to continue the correlation. During the early part of the year hauls rich in diatoms were obtained and it was possible to free them from most of the animal organisms present by filtration through bolting silk having 50 meshes to the linear inch. These opportunities were taken to find the relation between the.
(12) 418. H. W. HARVEY,L. H. N. COOPER,M. V. LEBOURAND F. S. RUSSELL.. phosphorus content of the diatoms and their content of plant pigments. with the followingresults.. .. Mg. P found. January 1/34 Almost pure phytoplankton. February 7/34. About 30% plankton. of bulk. February 20/34 About 20% frecal pellets. April 3/34 Nearly all diatoms. May 15/34 About 20% animals. Units of plant pigment found. Mg. P per 1000 units of plant pigment after arbitraryallowance for P in animals, etc.. 0,039 0,037 0,039 .039. 286. was animal 0.611 0,676 .643. 4000. 013. .189 .185 .187. 3400. 0.05.. . 0.244 0.243 0.275 .252. 2400. 0.10. . (0'304) 0.465 .46. 5200. 0.07. 0'135. In both 1933 and 1934 the same type of seasonal variation occurred, as shown in Figure 8. In 1933 growth commenced a little later, as there was less sunshine in February, but continued more rapidly, there being more sunshine in March. Then the population decreased more suddenly and completely at the beginning of April, although there was more sunshine during the first half of April than in 1934. During the summer the outbursts were more intense than in 1934, consisting mainly of Rhizosolenia alata in May and of R. stolterfothii and Guinardiaflaccida in June, whereas in 1934 the May outburst was mainly composed of R. shrubsolei, the June outburst of R. alata and the outburst at the beginning of July of Guinardia flaccida. It was possible to determine the pigment content of R. alata in both years. In 1933 one unit of plant pigments was contained in 7,300 cells while in 1934 the same quantity of plant pigments was contained in 11,300 cells, suggesting that the cells were rather smaller in the latter year. The autumn outbursts commenced in September. In 1933 it was composed mainly of R. styliformis and Biddulphia sinensis, the population increasing more gradually than in 1934, attaining nearly twice the density and continuing until December. The autumn of 1933 was notable for.
(13) PLANKTON. PRODUCTION. 419. AND CONTROL.. many sunny days while in 1934 dull days prevailed in November and early December. In 1934 the outburst was composed almost entirely of several species of Chootoceros. Although the same type of seasonal changes took place during the two years, it is clear from Figure 8 that the supply of vegetable food for animals was very different. /~~~~'.=:::::: :'.':.';.' ,,::~ !. : :. 5000. ::. ,i :, i. .. f. ,, ,,. I'. ". I: "., \ ::. :. ;",", \. i \.,. '". i. ''. \. :. .. \. : \, fii \. \ ~.:'. ". i. i\ f \. ! \. .,. ". :::: ",'. :,. :~ !\. ': .' \', : \. :\. :,, .. ~. ". "1\. 1. :. " ~ 3000. 1\. :\ ,'. : !, ,,. ~. ". "!\. \. :,. ~. ::. r. J:. ,.. 1J. ii ~. i. ,. 1000. :. :. i. /~ !. ~:. \ II j ::: :. ' \1. ,,. \\. ,. ~. ~--. A\!\ A A 1\ a. L...j. JAN. FIG. 8.-The. FER. points. MAR. APL. on the full.line. MAY. JUN'. curve. show the units. metre during the circles between surface1934 andand 45 metreB.. JUL. on the dotted. Aue. SEP. of plant. curve during. 0'1. pigments. NOV. DEe. per cubic. 19f3, at Station. L4. Furthermore, it seems reasonable to conclude that with the larger average breeding stock of diatoms in 1933, the production of vegetation was greater than in 1934, and their nutrient salt requirements greater also. This appears to have been the case since the difference between the maximum phosphate content of the water colunm found at the beginning of the year and the minimum found in the summer amounted in 1933 to some 17 mg. and in 1934 to 12 mg. phosphorus per cubic metre. THE ANIMAL PLANKTON.. The plankton animals in an aliquot part of each catch were counted. The total animals and the proportion of the more important organisms are given in Figure 9, which shows a seasonal increase from a low winter NEW. SERIES.-VOL. XX.. No.2.. AUGUST, 1935.. S.
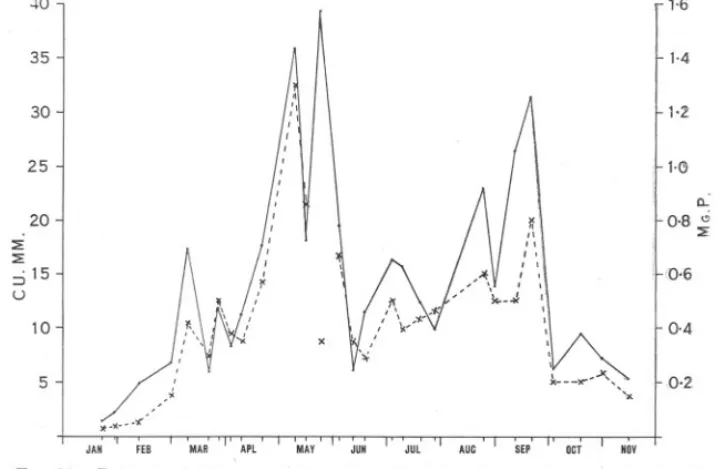
(14) '\ I. 420. H. W. HARVEY, L. H. N. COOPER, M. V. LEBOUR AND F. S. RUSSELL.. minimum to a maximum in September, with considerable fluctuations during the summer months. The composition of the copepod population is given in Figure 10. It shows that the late summer production of copepods is largely made up of the small species, Oithona, and of " small copepods" (mostly Pseudocalanus), while in May the much larger species, Temora, was abundant. The counts were made in the following manner. From 100 C.c. portion of the catch (derived from 70 to 150 litres of sea), the larger organisms were picked out-all medusoo, Calanus, adult Temora, Centropages, Sagitta, decapod larvoo and other large organisms together with most adult Pseudocalanus. All organisms and foocalpellets in a 10 C.c.portion were then counted under the microscope. When counting, the first. two of three copepodite stages of each species of copepod were lumped together as " small copepods " to give some index of relation of early to late stages.. To obtain a true picture of the quantity of animal plankton it is necessary to make some estimate of its volume, which requires size measurements of all the animals involved. It was thought that the phosphorus content of the zooplankton would give an even better index of the quantity of animal matter than any volume measurements. An attempt has been made to compute the volume of the catches. The average volumes for the different organisms given by Lohmann (1908, Table XI) have been used, while volumes for Sagitta and Calanus have been calculated from observations given by Gunther (1934). The computed volumes of some of the total catches so produced are given in Figure 11. This shows that, on the whole, late summer quantities are somewhat less than those for May, as was indicated by the composition of the copepods. In this same figure are given the calculated amounts of animal phosphorus in each of the catches whose computed volumes are shown. The agreement between the two curves is good, with the exception of two anomalies on May 23rd and September 11th. The agreement in the second half of the year is not so good as in the first half. The computed volumes for the animals then should possibly be slightly lower since allowance could not be made for the smaller size of the same species of plankton animals in summer than in spring. The general agreement between the two curves is however sufficient to show that the phosphorus estimations usually gave a good approximation for the total quantity of animal matter present in anyone catch. Although a considerable population of animals was supported in late summer they did not reach in actual animal matter the high spring values. In this respect our results are unlike Lohmann's, who found a greater production both of animals and plants in the late summer months. It should however be noted that Lohmann's late summer data are supplied for the year previous to his spring figures. Examination of his table on.
(15) . ,000. -. DIIJ. .,000. E3. . ,06. CO",",ODNAlIPLlI COPEPODSAIIDCOPEPCDIT" APPENDICULARIA CIRRIPEDE. R'Ul'LI. I. CLADOCERA. POLYCHAETE. ',000. [TI]. LIMACIR.. r:=J. ,OCTILUC'. c:::2:lI. ROTtlERA. c:J. LARVAE. ~. ~ 0. .,.C.. Z '1:! :d 0 tI q Q. <,000. ~ 0. 3.000. Z > Z tI Q 0. 2,000. Z .., :d 0. r 1,000. JAM. FIG. 9.-Diagram. FEB. MAR. APL. MAY. JUM. JUL. AUC. SEP. OCT. NOV. OEC. showing the total number and composition of the animals caught per cubic metre of water at Station L4 between surface and 45 metres during 1934.. II'>t-::> I-'.
(16) 2,00. I. -. PSEUDOCALAllUS. §. OITHONA. tII. ACARTIA. :a. 0. 0. 2.000",. TmORA. [[IJJ 0. E'2ZI. EtJrERPINA CENTROPAOES. I l. 500. 1++++1. CORYCAEU8. c=J. SMALLCOPEPODITES, ETC.. l':I. tII. ("). 0 0 "d l':I. Jd l,OOO. ;<: t"' l':I t:d 0 t:d :>Z t;:j. 500. ?> t:d 00 00 l':I t"' JAM. DEC. FIG. 1O.-Diagram showing copepods caught per cubic metre of water at Station L4 between surface and 45 metres during 1934..
(17) PLANKTON. PRODUCTION. 423. AND CONTROL.. page 345 shows that while in August, 1905, the volume of plants was 109 c.mm. and of animals 46 c.mm. yet in 1906 it was only 51 and 32 respectively. It seems like!y that by combining the two years as one consecutive calendar year a false impression has been produced. Our results for 1933 and 1934 show that the plant production in 1933 was throughout greater on the whole than in 1934 and it may well be that the year 1905 at Kiel was one of greater production than 1906. The frecal pellets found in the catches were too large to have been pro~ duced by copepod nauplii, and indeed many may have been produced by animals which were not caught in our net because they remained on the bottom during the day or, because they were swift enough to escape it. 40 ,.6 35. 1.4. 30. 1.2. 25. H). 20. c... 0.8 ci ::0:. ::0: ::0:. ,0,6. ::i 15 u 10. 0.4. x. 5. ,0,2. JAN. FEB. MAR. APl. MAY. JUN. dUl. AUC. SEP. OCT. NOY. FIG. ll.-Points on full-line curve show the estimated volume and crosses (on dotte<!l. curve) show estimated phosphorus content of animals caught per cubic metre of water.. In Figure 12 the numbers of frecal pellets per copepod and copepodite are plotted against the plant population. This shows that the numbers of frecal pellets bear a distinct relation to the amount of plant food available and seems to indicate that the amount of plant food eaten depends rather on the amount of food available than on the dietary requirements of the animals. It was noticeable that in spring when the numbers of plants were very high in relation to the number of animals the many frecal pellets present were distinctly green, suggesting that a large part of the plant matter had been passed through undigested. During the months March, April and May most of the Temora and the Cirripede larvre had their alimentary canals packed with food. This was in marked contrast to the few animals containing food in the late summer...
(18) 424 "'TS. H. W. HARVEY,L. H. N. COOPER,M. V. LEBOURAND F. S. RUSSELL. OF PLANTPI"""",S PER cu. METRE.. F ilCAL PELLEr S PER ANIMAL (COPEPOD ANa COPEPODITE:. !II. 3000. 12. ~. 2000. 8. 1000. 4. ,. "'" r. JAN. FED. MAR. APl. MAY. JUN. JUl. AUC. SEP. OCT. NOV. OEC. FIG. l2.-Points on curve show the units of plant pigment per cubic metre, and squares show the number of faecal pellets per copepod+ copepodite in the water between surface and 45 metres at Station L4.. It suggests that certain species are more voracious than others. Marshall (1924, p. 478) has also observed that" Temora appears to be more voracious." It may not be without significance that the first decrease in plant pigment in March corresponded with the period of abundance of cirripede larvre, while the heavy decrease in April and the beginning of May took place at the time when Temora were most abundant. A greater total production of plants and animals was found in the waters of Kiel Bay than at the Station L4. The monthly average numbers of animals in 100 litres of water were as follows :L4, Plymouth.. January February, March' April May June July August September October November December. 239 1934 545 2,024 2,518 3,365 2,440 2,852 4,963 4,818 1,839 1,338 736 27,677. Kiel Bay.. 3,700 1906 4,700 6,000 5,800 28,000 7,400 37,000 7,600 19,000 1905 24,000 24,000 13,000 5,700 190,000.
(19) PLANKTON. PRODUCTION. AND CONTROL.. 425. The greater numbers at Kiel are accounted for largely by Oithona and its nauplii, and by Rotifers in May and July; as a result the computed volumes of the animals are not so widely different between the two localities, except in the winter months when animal life was very much more abundant at Kiel than at Plymouth. THE SPRING CONDITIONS. The species which, on account of their numbers or their size, make up the bulk of the spring plant growth, were present in the water in January and February in significant quantity, with the exception of Lauderia borealis. The diatom population did not attain the density found in the previous year, and in neither year did it attain anything approaching the density attained in some other places, such as Kiel Bay, Loch Striven or Oslo Fiord. In 1933 the quantity of vegetation produced during the spring flowering was calculated from the phosphate taken from the water by the diatoms during the period of spring growth. This exceeded by many times the quantity of diatoms observed in the water. This calculation of magnitudes, in conjunction with the presence of many frecal pellets of herbivorous animals, green with diatom remains, led to the conclusion that the crop was being extensively grazed and disappeared because it was eaten (Harvey, 1934). Again in 1934 the estima~ed production of diatoms during the period of the spring outburst exceeded by many times the population found present on any day when samples were taken. Neither diatoms which were obviously dead nor empty frustules were found in any quantity. The L4 area has a clean gravelly bottom well scoured by tidal streaming. The diatoms disappear, unless there may be a suspension of diatoms close to the bottom which we have failed to find.* A relation between the numbers of animals and of plants was found, an increase in animals being accompanied by a decrease in diatom population (Figure 13). The number of frecal pellets green with diatom remains is also of interest. On March 20th, when the diatoms exceeded the animals to the greatest extent, the greatest number of pellets were found. This suggests that during this period when the diatoms are most abundant in the water the animals eat far in excess of their needs. It is of interest to consider surveys of other areas where the observations are such that they bear upon this question. Boysen Jensen (1915) while investigating the deposition of organic detritus in Danish waters calculated * During and after the spring outburst of 1935, samples of water were obtained from a few inches above the bottom by means of a hose and pump. The observations showed no material accumulation of diatoms in the bottom layer which was not traversed by the measuring net..
(20) 426. H. W. HARVEY, L. H. N. COOPER, M. V. LEBOUR AND F. S. RUSSELL.. the monthly production of phytoplankton. He made vertical hauls with a net from surface to bottom to estimate the phytoplankton population per unit area of the sea, and, regarding this population as a variable capital fund which daily yields a certain percentage of its amount, calculated this yield for each month. He used values for the rate of reproducduction of the organisms based on Karsten's and on Gran's observations of diatom growth rate. From the magnitude of this calculated yield or production, which must be finally either deposited on the bottom or consumed by other animals, he concluded that" only a limited proportion. .. UN I TS OF "PLANT PIOMENTS PER CUB I C METRE. NuMBER OF AN IMALS AND FAECAL PELLETS PER CU. METRE. .. ,,. ,II. , ... ,,. I , I.I , II I. 3000-. - 30000. ,. , /. ,:. I",,. 2000-. I I. 1000-. I. I. I. I. I. I. I. ". I I. I. I I. 1 't , I. I I I I I I I I. ". - 20000. .. I I. I. L. I. e. /' e\. \ \. l. PEL LETS. .... ,, ,\. -10000. ,,"PLANT. , PIGMENTS. ,, \. FEB. MAR. APL. FIG. 13.-Points on dotted curve show the units of plant pigments, on full-line curve the total number of animals and the black circles show the total number of faecal pellets caught per cubic metre of water at Station L4 between surface and 45 metres.. of the plankton production is deposited on the bottom; how large a proportion this may be it is impossible to say." In Loch Striven Marshall and Orr (1927, 1930)have observed the diatom population at various depths between surface and bottom at intervals throughout the spring growth, which consisted almost exclusively of Skeletonema costatum. These attained a population density many times greater than diatoms in the open sea at L4, even after allowing for their small size, and" disappeared" while there was still much available phosphate remaining in the water. Usually less than a month intervenes between the beginning of their rapid rise in numbers and their relatively.
(21) PLANKTON. PRODUCTION. 427. AND CONTROL.. complete disappearance, whereas at L4 the spring outburst lasted six weeks to two months in 1933 and 1934. Their distribution iri Loch Striven varied in different years. In 1928 a dense growth took place in the upper layers, but the diatoms were never found in quantity near the bottom. It seems probable that they were eaten while sinking and before reaching the bottom. In 1926 (Figure 14) the dense growth extended downwards and great numbers were found in the bottom water a few days before their sudden disappearance from all depths. This suggests that the Skeletonema was not all eaten, but that a part settled to the bottom. The sudden " disappearance" of the diatoms from the upper layers between April 13 APRil. MARCH. -15'. b. MAY. 7700-135'Oo-I0'00-2000-)&-13bO-)~-300o-I5lfO-228-0352 :z6. 147°0 :\2200 3400 1/;18013/0014540. 100. :Z4o0 43. 8000 153. st. 233. 3. '7°. 353. 62. S4. 6° 847 qooo. 196. OOO 301 .,... SURFACE. 12. 2500 2.0160. 4~ IF. 17°0. 80. /4°0. 610. :< st. 10FMS. %0 FMS.. 15. BOTTOM. POLYCHAETE. LARVAE. NUMEROUS. FIG. 14.-Diagram showing the number of chains of Skeletonema costatum in 20 c.c. at Clapochlar, Loch Striven. (Data supplied by Miss S. M. Marshall.). and 20 is remarkable unless they were eaten, because during this period there was a significant quantity of phosphate utilised, suggesting that active growth was taking place up to the end. Moreover, there was a recrudescence of the same species about a week later, and, furthermore, during the interval polychrete larvre were abundant. Annual bands of humus are found in the mud of the Clyde Sea area, which Moore has shown to be laid down each spring and formed from the organic matter (in frecal pellets composed of partly digested diatoms with some dead diatoms), which is deposited during and after each spring outburst. In 1930 he suspended pots at depths of 18 metres and 68 metres in Loch Striven (Table II). During the period of the spring outburst, which reached a maximum on March 28th, diatoms were deposited in the upper pot in great numbers from March 4th to about March 26th after which date the numbers of diatoms decreased and great numbers of frecal pellets were deposited. In the bottom pot diatoms did not start to be deposited until about March 26th. Many were deposited during the week ending April 2nd (3,800 cells per sq. cm.)..
(22) 428. H. W. HARVEY, L. H. N. COOPER, M. V. LEBOUR AND F. S. RUSSELL.. TABLE II. FROM DATA SUPPLIED BY H. B. MOORE. Pot at 18 m. No. of Skeletonema cells per em." per week.. 1930 March 4-11 11-18 18-26 26-April 2 April 2-23. Pot at 68 m. No. of Skeletonema cells per em." per week.. 11,500 1,040,000 almost pure diatoms 669,000. No diatoms, some green fmcal pellets. 84,000 with some green 3,800 with many pellets. fmcal pellets Some diatoms with very Some diatoms with very many fmcal pellets. many fmcal pellets. Total No. of Skeletonema cells deposited March 4-':"'April23 Less than 2,500,000. Considerably less than 2,000,000 probably less than 500,000.. After which gr,eat numbers of fmcal pellets fell and made counting the diatoms, which appeared to be decreasing, impossible. If we take the' estimate of the maximum number of diatoms deposited from the column of water 6,800 em. deep, then these diatoms if evenly . . 2,000,000 dIstrIbuted throughout the column of water would amount to 6,800 295 per C.c. or 500 chains per 20 C.c. During the maximum in 1926 the population averaged some 9,000 chains per C.c. The evidence indicates that only a small part of the spring outburst of diatoms is deposited on the bottom, without passing through the animals. During the 1926 spring outburst in Loch Striven a similar quantity of dissolved phosphate was utilised by the plants below each square metre, as is utilised by the spring growth of plants at the Plymouth Station, L4. It follows that a similar quantity of vegetation was produced in both areas, although in Loch Striven it reached a remarkable density in the upper layers (over 16 million cells of Skeletonema per litre at 5 fathoms), and the average density of vegetation in the whole column of water from surface to bottom on April 7th exceeded by several times the maximum found at L4. A simple explanation of this difference would be that the herbivorous.
(23) PLANKTON. PRODUCTION. AND. CONTROL.. 429. animals are fewer at the beginning of the outburst than at L4 and allow the population to build up more rapidly. As yet we have no knowledge of their relative numbers in Loch Striven. Conditions common to this and similar areas may influence their attaining a denser plant population than the open sea. The water contained more dissolved phosphate at the beginning of the 1926 outburst in Loch Striven than it does at L4 (1933, 1934), and growth is more rapid the higher the concentration of nutrient salts-at least for one species of diatom (Harvey, 1933). In Loch Striven the turbulence set up in the water by wave motion is less than in the open sea and there is no turbulence set up by tidal streaming or currents. Hence diatoms in the upper layers where light conditions are best for growth can better remain there, not being continuously moved to greater or lesser depths. Under these circumstances of optimum light a layer of dense population can be most rapidly formed, and having once formed the animals may avoid it* preferring to feed below it where the vegetation is ample but less dense and less likely to tangle about them. Thus a focus where plant growth is most rapid and grazing least intense would be formed, and persist until the animals having increased in numbers eat into it. The evidence all seems to point to the spring growth of diatoms, both in the Plymouth L4 area and Loch Striven, being regulated by the intensity of grazing. THE MAGNITUDE OF THE SPRING CROP OF PHYTOPLANKTON.. From the quantity of phosphate in the water which has been utilised, and the average phosphorus content of spring diatoms, the total production or crop of diatoms during the period may be calculated. In the early part of 1934 the general hydrographic conditions and the fluctuating phosphate content of the water were unusual, and the data collected at L4 is not necessarily typical of a watermass which has occupied a coastal area of similar depth and illumination during the whole period. In order to calculate the crop it is necessary to assume that it had done so, the decrease in phosphate due to utilisation by diatoms peing some 6 to 8 mg. P per cubic metre between the middle of February and the middle of April. The regularity with which a fall in phosphate has been observed over a number of years and its magnitude, suggests that this is a reasonable estimate. During the early part of the previous year 1933, this uncertainty is less. Between February 16th and March 28th the water at L4 lost some 6.75 mg. P per cubic metre due to its utilisation by diatoms. * The avoidance of thick phytoplankton Professor A. C. Hardy.. by the animals has been suggested by.
(24) 430. H. W. HARVEY,L. H. N. COOPER,M. V. LEBOURAND F. S. RUSSELL.. In order to arrive at an average value of the phosphorus content of the diatoms over the period of the spring flowering, the phosphorus content of the phytoplankton catches per cubic metre of water was calculated (Figure 15) on the basis of the three sets of analyses made during the period (vide p. 418). It shows that the average phosphorus content of the diatoms was roughly 0.14 mg. P per cubic metre. Their average content of plant pigments being 1,800 units, this gives an average ratio of 0.08 mg. P 0'3- MC P.PER CU. METRE. " ,, , , ,2-. , ,,. .J-. ,, ~. JAM. ,. ,/. / FED. ' ,/. "" , ,. /\ MAR. ,. """"~'". ",~ ~. ...........'.. APL. FIG. 15.-Pecked line shows phosphorus content of phytoplankton per cubic metre, calculated from ratio found on February 7. Full line from ratio found on March 20 and dotted line from ratio found on April 3.. per 1000 units of plant pigment, or 4 X10⁶ diatoms" of average cell contents" (p. 417). It follows from this that the total production or crop during the spring flowering between the middle of February and the middle of April in . . . 6 X1000 . 1934 was a quantIty 0f d Iatoms contammg some 0.08 or 75,000 to 8 X1000. . . . . or 100,000 umts 0f p1ant pIgments, an d durmg t h e SIXweeks. period between February 16th and March 28th, 1933, a quantity containing some 85,000 units of plant pigments. It is clear that the validity of these calculations depends upon our having struck a fair average value relating phosphorus content to pigment content to number of diatoms. The value cannot legitimately be applied to mixtures of other species of diatoms, but it was thought, however, that the result of applying such calculation to Marshall and Orr's Loch Striven data for 1926 would be interesting although grossly speculative. The decrease in phosphate since March 23rd in a column of water, 1 sq. metre cross section, extending from surface to bottom, was calculated for each day on which samples were taken. The population of Skeletonema on each day was also calculated The number of Skeletonema cells produced since March 23rd on each date was arrived at in the followingmanner. We had found at L4 that 20 cells of Skeletonemacostatum contained roughly the same quantity of plant pigments as one diatom of average cell contents. '--.
(25) PLANKTON. PRODUCTION. 431. AND CONTROL.. (p. 417) and 4 X 10⁶ of these contained 0.08 mg.P. We are indebted to Miss Marshall for measuring cells of Skeletonema caught at L4 on March 26th, 1934, and in Loch Striven during the spring of 1926 with the result that 28 cells from Loch Striven had the same volume as 20 from L4. From this the assumption is made that 0.08 mg.P was contained in 28 X 4 X 106 Skeletonema in Loch Striven. The phosphate utilised since March 23rd being known, the production of Skeletonema was calculated. These values are shown as circles in Figure 16. Movement of the water mass had taken place, particularly between March 23rd and April 7th, shown by change in salinity and by the irregular change in phosphate content. On account of this and the gross assumptions used in the calculation, the dotted curve is a conjecture. THE. RATE. OF DIATOM. GROWTH. DURING. THE. SPRING. FLOWERING.. In order to make a speculative estimate of the rate of growth the assumption has again to be made that the quantities of diatoms actually found at L4 on the various dates are representative of the population in the watermass which occupied the area in April. During the two months in 1934 the average population of diatoms found at L4 contained some 1,800 lmits of plant pigment, and to have produced a total crop containing 75,000 units must have divided about 40 times in the 60 days-an average of once every 36 hours. To have produced a total crop containing 100,000 units the average rate works out at once every 26 hours. During the 40 days between February 16th and March 28th, 1933, the average population contained some 2,500 units of plant pigments, and to have produced a total crop containing 85,000 units, must have divided about 34 times in 40 days-an average of once every 28 hours. These estimates are in fair agreement. On the other hand their magnitude, but not their agreement, depends upon our having assessed the very variable ratio of phosphorus to plant pigment in the diatoms correctly. Furthermore some of the phytoplankton undoubtedly passed through the measuring net, which makes the estimated rates too high. These estimates suggest that the diatoms divided on the average about once every 36 hours. This takes place for the most part in March, when the average daily illumination is only about one-third of its summer value and any material photosynthesis over a 24-hour period is not likely to take place below 25 metres, or half-way to the bottom, even in the transparent water at L4. As the diatoms are evenly distributed between surface and bottom, this suggests that the diatoms above 25 metres divide, on the average, once in less than 18 hours. This speculative estimate gives a rate-a maximum rate-which is strikingly high. However, spring diatoms do reproduce very rapidly at times. In 1922 Gran filled flasks with natural sea-water rich in diatoms and immersed them in the sea at a depth of 1 metre for three days between.
(26) 432. H. W. HARVEY,L. H. N. COOPER,M. V. LEBOURAND F. S. RUSSELL.. March 8th and 11th, when the numbers rose from 17,220 to 170,340 per litre showing that they divided on the average once in rather less than 24 hours. In a similar experiment one of the included diatoms, Biddulphia aurita, rose in numbers from 280 to 30,040 per litre in flasks immersed at 2 metres and to 23,000 at 5 metres during three days, March 22nd-25th, 1916, dividing on the average once every 10 hours. The temperature of. /. _-0 -',......-. /. SOJlIO"CELLJ OF S/(ELETONEMII. /. I ,t. /. 40.. /. /0. PROOUCTION. /. I I. I. / I. 30.. I. 0. I. I. I I I. POPUL/lTiON. I I. 20.. ,tV.-. II.. 0. 1O.. I1/1R23. /lPRIL2. 7. 13. zo. FIG. 16.. the Norwegian sea is about 5° O.colder in March than that of the English Ohannel. In Loch Striven during the eleven days between March 23rd and April 2nd, 1926, the population of diatoms below each square metre increased from some 9 X10⁹ or less to some 180 X109 individual cells. This corresponds to an average of one division in about 48 hours, or in less if allowance is made for diatoms eaten during the period. This minimum rate of one division in 48 hours corresponds with our calculated maximum rate of one division in 36 hours; both being average rates for the entire water column..
(27) PLANKTON. PRODUCTION. AND CONTROL.. 433. THE FATE OF THE SPRING OROP.. Our estimate of the production, which is in the order of 340,000 diatoms of average size per litre, exceeds by many times the population found to be present on any day when samples were taken during the spring outburst. Neither diatoms which were obviously dead, nor empty frustules, have been found in any quantity. The L4 area has a clean gravelly bottom well scoured by tidal streaming, and, unlike Loch Striven, there is no-annual deposition of mud. The crop disappears; we have failed to find a suspension of dead diatoms in the water close to the bottom. It is of interest to calculate how much vegetable matter plankton animals eat during the period of the spring outburst, on the supposition that they alone eat almost the whole estimated crop, no account being taken of those eaten by the bottom fauna and larger animals. Raben's analyses of plankton show that the N to 0 ratio is variable, but on the average similar in animal plankton and diatoms, Oooper's that the P to N ratio is similar. Hence for a rough approximation it is assumed that quantities of living animal and plant plankton containing the same quantity of phosphorus, cOI?-tainabout the same weight of organic matter. The diatom crop per m.3 contains some 7 mg. P-an average daily production of diatoms containing 0.11 mg. P-and the animal plankton present on anyone day, between the middle of February and the middle of April from our estimates contained on the average some 0.29 mg. P or two and a half times that of the average daily plant production. The deduction that rather less than a half of the herbivores own weight is on the average eaten daily, as a maximum estimate, lies within the bounds of possibility. The magnitude of the animals feeding rate if they regulate the diatom population can also be estimated in other terms. From Figure 1 it appears that the animals eat down the daily production of diatoms from a breeding stock containing IjlOth of their number of units of plant pigments, or 400 times their number of diatoms" of average cell contents," dividing about once every 36 hours. That is, each animal eats some 270 diatoms of average size daily. Again on March 20th, if the animal plankton was just keeping the diatom population from increasing, then animals containing 0.3 mg. P were eating daily diatoms containing 36 24 X0.208 mg. P or roughly halft~ejr . . . . 12,697,000 24 own WeIgh t, each ammalon the average eatmg X - or 570 14,470 36 plant cells. The copepod Eurytemora hirundoides has been observed by Lucas (private communication) to eat as many as 5,000 cells of the very small diatom Nitzschia closterium hourly, or 120,000 per day. From Atkins'.
(28) 434. H. W. HARVEY,L. H. N. COOPER,M. V. LEBOURAND F. S. RUSSELL.. observation (1923) these would contain 0.000056 mg. P, which is contained in some 2,800 diatoms of average size. The extent of the part played by the bottom fauna is unknown. If each average square metre of the bottom contains filter feeding organisms comparable in activity to 3 or 4 common mussels, they will only filter the diatoms from some m.3 of water every 24 hours, that is 1/200th of the water column. From this consideration it seems unlikely that they play a material part in determining the diatom population of the water column from day to day. On the other hand it is not improbable that many diatoms at times sink and remain in the water close to the bottom until they are ingested by the bottom fauna. These considerations suggest that only a part-probably even a small part-of the spring crop is converted directly into animal tissue, the remainder being present in the form of ffficalpellets, the detritus formed from them, and, in some areas, of dead diatoms close to the bottom. In some areas a rich bottom fauna is supported by this remainder. The possible fate of that part of the spring crop which is not converted into animal tissue may be traced a little further. Analyses of fffical pellets, green with diatom remains, showed that they were poor in phosphorus and suggest that much of the phosphoproteins and phospholipins dissolve into the sea when diatoms are eaten but only partially digested by copepods. A period of three to four months intervenes between the disappearance of the spring crop and the reappearance of phosphate in the water; after the spring outburst the phosphate in the water continues to decrease-the rate at which it is used by phytoplankton exceeding the rate at which it is reformed-until some time in July or August. These present researches have shown that a very considerable accumulation of dead diatoms would have to break down in order to provide the phosphate which reappears in the late summer, and as we do not find any such accumulation, the phosphate is not apparently reformed directly from dead diatoms. If the phosphate were reformed directly from animal tissue we should expect a noticeable mortality of animals shortly before the reformation at the end of summer, but no such mortality is known to take place. Much of the phosphorus compounds may dissolve out of broken diatoms when they are eaten but only partially digested by zooplankton at the times of diatom maxima and remain in solution during the interval until finally broken down into phosphate by bacterial action. These vegetable phosphorus compounds are stable and only break down slowly into phosphate. If 'solution of the contents of the broken and partially digested cells into the water is the fate of any considerable part of the spring crop we should expect more dissolved organic matter, particularly organic phosphorus compounds, in the water in May than. t.
(29) PLANKTON. PRODUCTION. AND. 435. CONTROL.. in the winter months. Analytical methods are only now becoming sufficiently developed to investigate this. THE SUMMER POPULATION. Early in April many of the species of diatoms which are plentiful in March cease to be represented, except by occasional individuals, and do not appear again in the catches before the autumn or even later. The Baccillaria, Biddulphia and Coscinodiscus are' cases in point. Relatively few Chretoceros occurred during the summer although plentiful in March and making up most of the September catches, These spring-autumn diatoms proliferate when the water is coldest and again when it is quite warm in autumn; at both seasons the length of day is roughly 12 hours. The summer population was composed of species which were well represented throughout the year, in the case of Guinardia flaccida., Rhizo:solenia alata, shrubsolei, stolterfothii and Navicula membranacea reaching a greater concentration in the summer than at other times. At the beginning of the period Slceletonemacostatum, a diatom typical of springtime, was found in varying abundance' until the end of May. 'Only a fraction of this minute species will be retained by the silk net, and ,owing to its loss our values for the plant population are likely to be too low during April and May. . , On May 10th a dense animal population was encountered with many :green frecal pellets, in water with few diatoms. It is hence probable that an outburst of diatoms, which we missed, had taken place just previously and been eaten down. The outbursts of Rhizoselenia shrubsolei on May 15th and 30th and of R. stoltelfothii and Guinardia on July 27th occurred at times when the :animal population was relatively low. It was thought that these summer 'Outbursts were oflimited area and took place where the intensity of grazing :allowed. The 1933 survey suggested that in June" the zooplankton may have occurred in swarms, accounting for the uneven distribution of diatoms." On May 25th, 1934, a series of observations were made at varying distances off shore and showed a variable plant population. On July 27th a number of observations were made in the vicinity of L4 and it was found that the water to the south and west contained few diatoms. The number of animals and units of plant pigment in the water at a position 2 miles to the south of L4 were ascertained and show more :animals with fewer plants. At L4.. Units of plant pigments/m.3 Animals/m.3 Frecal pellets/m.3 NEW. SERIES,-VOL.. XX.. No.2.. . AUGUST, 1935.. 560 21,290 9,070. 2 miles south of L4. 100 32,690 1,200 T.
(30) 436. H. W. HARVEY, L. H. N. COOPER, M. V. LEBOUR AND F. S. RUSSELL.. On the other hand the outburst of Guinardia found on July 3rd was in water with relatively many animals, of which however the proportion of nauplii was very high. During the greater part of August and the first week in September, 1934, the phytoplankton caught in the net at L4 was sparse. Examination of the water failed to show any material quantity of small vegetable organisms which would have passed through the net. There was on the other hand a considerable quantity of organic detritus in the water. Meanwhile the zooplankton remained abundant. The number of f::ecal pellets per animal remained low, and they were never tinted green with diatom remains (Figure 12). .It is not unlikely that much of the zooplankton, normally herbivorous, was feeding on detritus with its associated protozoa .and bacteria. If we consider the plant population from day to day as the breeding stock or capital fund, the daily production of vegetation can have been very little during this period,. even if the net was letting through its meshes as great a weig):lt of small plant organisms as it was catching. However, it is possible that the breeding stock during the summer is. augmented owing to the presence of" spores." In September, 1918, the plankton in a sample of sea-water was counted after separation by centrifuge and also determined by a culture method (Allen, 1919). By counting, the number of diatoms was found to be 12,200 per litre, and by the culture method 376,000. Amongst the diatoms were several large species which, as well as the small species, were found to be more numerous. by the culture method. A sample of water collected in August was also examined by the culture method and found to contain 290,000 diatoms. per litre. "To what extent the number found represents individual cells. and to what extent it represents' spores' it is impossible to say definitely. " T~is classical experiment suggests the possibility that the IA area is heavily seeded during the late summer, and perhaps capable of a rather considerable daily production of vegetation. It seems clear from Figure 12 that the animals feed heavily when there is much food present, greatly in excess of their needs. From the data obtained during this survey we have no means of gauging the minimal food supply necessary. Concerning the magnitude ofthis there have been many estimates made (Putter and others), perhaps the most suitable for our purpose being an investigation of the metabolic rate of the copepod Calanus finrnarchicus (Marshall, Nicholls and Orr, 1935). This. indicates that this animal, typical of the majority of zooplankton, requires less than 5% of its own weight daily of digestible vegetation. As a very rough approximation we conclude that the summer zooplankt:)Q. ".
(31) PLANKTON. PRODUCTION. AND CONTROL.. 437. per cubic metre containing an average of 0.6 mg. P will require daily, if two-thirds of them depend on vegetation, a quantity ofphytoplanktcn containing 0.002 mg. P or 30 units of plant pigments or 120X103: diatoms of average size. The daily production of this quantity of vegetation could reasonably be expected. It is a quarter of the average diatom population caught in the measuring net during this period. If the sparse plant life in August, by means of normal binary fission provides a sufficiency of food, as is suggested by this rough calculation.. then during the rest of the year a very considerable excess of vegetable foodstuff is produced. This excess, the greater part of which seems to be eaten but only partially digested, is not necessarily unused. Some of it at least is converted into the protoplasm of flagellates on which in turn other animals feed. When a culture of diatoms dies a dense population of flagellates springs up; Marshall, Nicholls and Orr found minute flagellates in great numbers in Loch Striven immediately following two diatom maxima (Marshall, Nicholls and Orr, 1934). However, even if this is taken into account, these observations indicate a great wastage of vegetable food by the plankton except during relatively short periods in the summer. In connexion with this conclusion it is of interest to consider a conclusion based on entirely different premises for an area having a very different flora and fauna, seasonal variation and conditions for growth. In surveying the plankton of Kiel Bay in order to determine the relation between animals and plants, Lohmann (1908) employed methods whereby samples of the total plankton down to the minutest organisms were obtained. He computed the total volume of the plankton organisms by displacement with scale models of each species. As a result he was able to give a complete picture of the plankton community throughout the year and concluded that in December, January and February the plants. made up less than one-third of the total volume, in November and MarcIL their proportion was between one-third and one-half, and in the remainder of the year the plants formed one-half to three-quarters of the volume of the plankton. On the basis that all Metazoa required a daily ration of one-tenth of their own volume and supposing that always only one-third of the mass of producers present was destroyed then there would be a deficit in January and February, but for the remainder of the year therec would be a surplus. . It is also of interest to compare the summer population of plants in the' L4 area with that in Loch Striven. The growth of diatoms in Loch Striven during the summer of 1926 (Marshall and Orr, 1927) was in several ways different from the growth at L4 in the summer of 1933 and 1934..
(32) 438. H. W. HARVEY, L. H. N. COOPER, M. V. LEBOUR AND F. S. RUSSELL.. The population of diatoms only once reached a really low level (on July 14th) for a short period and for relatively long periods they were abundant. Both in the Loch, and at L4 in 1934 there appears to have been a sufficiency of nutrient salts, brought into the upper layers from below, throughout the summer. At the end of May and beginning of September very little phosphate in the surface layers in Loeh Striven is shown by analyses, but this is not reflected in the number of diatoms. The upper 45 metres of water was richer in phosphate than that at L4 and the water below 45 metres very rich, averaging some 24 mg. P per {}ubicmetre during the summer. The spring outburst of Skeletonema had disappeared by April 20th 1926, on which date polychrete larvre were abundant. This may be ;significant since the end of the spring outburst at L4 in 1933 was likewise marked by an abundance of these larvre. By April 27th they had cdiosappearedand a recrudescence of Skeletonema commenced, reaching its maximum on May 18th when its numbers rapidly fell and its place was taken by several species of Chretoceros and Thalassiosira, which had for the most part developed while the Skeletonema were becoming less numerous. In their turn these" disappeared" by June 10th. Theirfurther -development was doubtless impeded to some extent by lack of phosphate. This first secondary outburst was followed by a second short-lived -outburst commencing at the end of June and lasting only some ten days. It was composed of Chretoceros, Cerataulina and Skeletonema. On July 14 the diatom population was at a minimum and on this day lamellibranch larvre were found in great abundance in the tow-nets. Towards the end of July a third outburst of diatoms commenced and lasted until the middle of September. During this period of abundant diatoms, it should be mentioned that, at intervals copepods and, on August 20th, lamellibranch larvre were found in abundance. At L4 during the latter part of July and August in 1934 the numerous .animals kept the diatoms grazed down to a low level; in Loch Striven, in 1926, the animals did not. In the summer of 1930 Moore found only a few diatoms deposited on the bottom of this loch compared with the .quantity deposited immediately after the spring outburst. If the latter were only a minority of the spring outburst, then only a minority of the :summer production escapes being eaten. A considerable deposit of frecal pellets composed of diatom remains took place throughout the ~summer. AUTUMN AND WINTER. CONDITIONS.. In the middle of September a rapid increase in the population of diatoms took place. A maximum was found before the end of the month and the outburst" disappeared" before the end of October. It is seen from.
(33) PLANKTON. PRODUCTION. AND. CONTROL.. 43g. Figure 8 that the autumn and winter of 1934 and 1933 were very dissimilar. The latter part of October and all November, 1934, were dark and overcast, unlike the previous year when November was sunny and bright. It appears that the extent and duration of the autumn outburst depends. largely upon weather conditions-illumination-as had been noticed by Herdman. This autumn outburst consisted mostly of several species of Chretoceros, whereas in 1933 Rhizosolenia and Biddulphia were dominant. In both years the phosphate in the water had started to increase someweeks previous to the autumn outburst of diatoms, and in 1934 a considHable supply had been available since August 24th, available for some three weeks prior to any material increase in diatoms. We have no estimates of the nitrogen salts in the water, but previous investigations. have shovm that nitrite and nitrate are regenerated a little later than phosphate. It has been found for one species of diatom that its rate of growth is greatly increased by increasing the concentration of nutrient salts when these are present in small quantity, although there may have been sufficient for a considerable growth at the lower concentrations. Although an increase in phosphate took place some time before, it is probable that an increase in nitrogen salts did not occur before early September. The survey has in general indicated that a change in diatom population is brought about by a change in one or both of two opposing factors-the rate of growth of the diatoms (depending upon illumination and probably concentration of nutrient salts) and the rate at which the diatoms are eaten (depending upon the number and kind of herbivorous animals). During the September period when the population of diatoms was rapidly increasing, the animal population was very high. On the 21st, when the maximum population of diatoms was found, the animals were almost at a maximum. That they were not feeding freely upon thenumerous diatoms is suggested by the number of frecal pellets per animal being similar to the numbers in July and August when diatoms were very sparse, and by examination of the animals showing very few to contain food in contrast to the large numbers of cirripede nauplii and Temora found feeding earlier in the year. The early autumn community of numerous animals allowed a con-siderable population of diatoms to be built up during the third week in September and did not start to feed freely upon them until later in the month. Then and during October the numbers of animals were much lessOur thanks are due to Mr. G. M. Spooner for making various statistical analyses in connexion with the diatom counts, to Miss S. M. Marshall for-.
(34) 440. H. W. HARVEY, L. H. N. COOPER, M. V. LEBOUR AND F. S. RUSSELL.. supplying original data of the Loch Striven survey, to Dr. H. B. Moore for data concerning the deposition of frecal pellets in Loch Striven, to Professor A. C. Hardy and to Mr. Lucas for data concerning the distribution ,of plankton in the North Sea and the experimental feeding of plankton animals, to Miss P. M. Jenkin for data concerning the growth of diatoms at different depths over a 24-hour period and to Dr. W. R. G. Atkins for data concerning illumination. SUMMARY. Vertical hauls between surface and 45 metres depth were made with a measuring net, throughout 1934, at a position 5 miles S.W. of Plymouth Breakwater in circa 50 metres depth of water. The phytoplankton organisms were counted and also assessed from their content of plant pigments. A close relation was found between numbers of diatoms and their pigment contents after making allowance for the small size of three species. The phosphorus content of the phytoplankton was estimated on several 'occaSIOns.. The zooplankton organisms per cubic metre of sea were counted and ,estimations were ma~e of their phosphorus content. The diatom population differed from that found in 1933, in which year ;the spring outburst was' shorter but more intense, -the sporadic summer "outbursts were more intense, the autumn one lasted longer; and more phosphate was utilised by the plants during the first half of the year. Evidence is presented that the spring outburst of diatoms is limited in quantity and time by the grazing of the herbivorous plankton animals. Some species of these herbivores appear to eat greatly in excess of their needs when diatoms are IiLbundant. No evidence was found that the herbivores are reduced in numbers by lack of food during late summer, and a calculation suggests that there was ,always a sufficient daily production of vegetable matter for their meta,bolic needs. The duration of the autumn outburst of diatoms appeared to be controlled by the amount of light available. Calculations gave a maximum value for the average rate of growth of ,diatoms in the sea in spring. This value lies between observed rates. Only a fraction of the phosphate utilised by phytoplankton during the first half of the year has been found as phosphorus compounds in the planktonic population. It is considered that much of the organic phosphorus compounds in diatoms may pass undigested through animals and remain in solution in the sea until regeneration to phosphate takes place in late summer..
(35) PLANKTON. PRODUCTION. AND. CONTROL.. 441. REFERENCES. ATKINS,W. R. G. 1926. Phosphate content of sea water in relation to algal plankton. .Tour. Mar. BioI. Assoc., N.S., Vol. 14, p. 447. --1923. Phosphate content of waters. Jour. Mar. BioI. Assoc., N.S., Vol. 13, p. 119. BOYSENJENSEN,P. 1915. Studies concerning the organic matter of the sea bottom. Rep. Danish BioI. Station, Copenhagen. COOPER,L. H. N. 1934. The Determination of Phosphorus and Nitrogen in Plankton. Jour. Mar. BioI. Assoc., N.S., Vol. 19, pp. 755-760. GUNTHER,E. R. 1934. Observations on the Fatty Constituents of Marine Plankton. I. Biology of the Plankton. Jour. Exper. BioI., Vol. XI, No.2, pp. 173-197. HARVEY,H. W. 1934. Measurement of Phytoplankton Population. Jour. Mar. BioI. Assoc., N.S., Vol. 19, p. 761. -1934. Annual Variation of Planktonic Vegetation, 1933. Jour. Mar. BioI. Assoc., N.S., Vol. 19, p. 775. -1933. On the Rate of Diatom Growth. Jour. 'Mar. BioI. Assoc., N.S., Vol. 19, p. 253. HERDMAN,W. A. 1922. Investigation of plankton in the Irish Sea. Jour. Linn. Soc. Botany, Vol. 66, pp. 837-868. KALLE, K. 1934. Meereskundliche chemische Untersuchungen mit Hilfe des Zeisschen Pulfrich-Photometers. III. Methodische Untersuchung der Phosphatgehaltbestimmung. Ann. d. Hydrog., Vol. 62, pp. 65-74 and 95-102. LOHMANN, H. 1908. Untersuchungen zur Feststellung des vollstiindigen Gehaltes des Meeres an Plankton. Wiss. Meeresunter. N.F., Bd. X, Abt. Kiel, pp. 131-370. MARSHALL, S. M., and ORR, A. P. 1927. The relation of Plankton to some Chemical and Physical Factors in the Clyde Sea Area. Jour. Mar. BioI. Assoc., N.S., Vol. 14, p. 837. --1930. A Study of the Spring Diatom Increase in Loch Striven. Ibid., Vol. 16, p. 853. MARSHALL,S. M., NICHOLLS,A. G., and ORR, A. P. 1934. Biology of Calannsfinmarchicns. V. Ibid., Vol. 19, p. 793. 1935. Ibid., VI. Ibid., Vol. 20, p. 1. MATTHAI,G. 1904. The effect of temperature on carbon dioxide assimilation. Proc. Roy. Soc., Vol. 72, p. 355. MOORE,H. B. 1931. Muds of the Clyde Sea Area. III. Jour. Mar. BioI. Assoc., N.S., Vol. 17, p. 325..
(36)
(37)
Figure


+7


Related documents
Our findings suggest that S. mansoni infection among pre-school children is associated with a reduced antibody response to catch-up measles immunisation, and that praziquantel
Comparative study of efficacy and safety of sitagliptin versus glimepiride in patients of type-2 diabetes mellitus inadequately controlled with
Therefore John Eliot, an English puritan missionary in New England and one of the most remarkable missionaries of all time, wrote his Christian Commonwealth , based upon
More specifically the aim of this study was to investigate the associations between health, social and work-related factors, recovery, as well as biological stress markers among
Se informa sobre este caso para recordar el peligro potencial de este pro- cedimiento y Ia necesidad de proceder con cuidado en su ejecuci#{243}n. Este m#{233}todono debera emplearse
However, if different patterns of progress are identified, as in the charts presented, and the pattern to which a given child con- forms is recognized he may be found con- sistent
19% serve a county. Fourteen per cent of the centers provide service for adjoining states in addition to the states in which they are located; usually these adjoining states have
Preparation, characterization, and immunological properties in mice of Escherichia coli O157 O-Specific polysaccharide- protein conjugate vaccines. Konadu EY, Parke JC, Tran
