Salary Benchmarking Report
CEO Salary Survey
AME Recruitment
January 2015
Salary Benchmarking LGA SA Page 1
January 2015.
Executive Summary
AME Recruitment are retained by Local Government Association of South Australia to collect and collate CEO
Salary Data for South Australian Local Government entities with comparisons to be made with the Not for Profit
Sector, Interstate Local Government entities and Selected Public Sector Organisations. This report is updated
and reissued yearly in January in order to capture changes in the salary packages and conditions under which LG
CEOs are employed.
Data Collection
AME undertook extensive data collection and verification in order to produce an accurate set of results against
which informed comment and analysis could take place. Specifically we sought information from:
•
South Australia’s 68 Local Government Councils;
•
Equivalent Local Government Councils from Western Australia, Victoria and Broken Hill;
•
Equivalent roles within the South Australian Public Service;
•
Relevant South Australian not-for-profit organisations.
Information was asked for from all 68 Councils. Where a response was not received data used is from the
December 2014 report. 6 councils did not respond.
The data requested was:
•
Salary package, including all additional benefits both cash and non cash;
The appendices include information for every SA Council.
Data Analysis
The CEO Salary Survey data was collated and reviewed for validity.
The data was then segmented to enable comparison within segmented groups, between segmented groups, and
between South Australian Local Government entities and Interstate Local Government entities.
Data Segmentation
Grouping of Councils have been made using the following measures:
•
Council size, scale and location, using classifications such as G6 + ACC, Other Metro, Outer Metro and
Regional and Small Regional.
•
Elected Member Groupings as determined by the Remuneration Tribunal
Salary Benchmarking LGA SA Page 2
January 2015.
Key Data
Contained within the attached tables are the results and averages for all South Australian Local Government
Councils split and presented in various ways. Key numbers are highlighted below:
1. The average Total Salary Package in January 2015 (comprised of base salary, super and motor vehicle)
for the CEO of all 68 Councils is $208,654 (vs. $202,342 in January 2014), an increase of 2.75% in the
past 12 months.
207,902 is made up of base salary, super and motor vehicle. (See Table 1 for details)
2. The average annual salary package (comprised of base salary, super and motor vehicle) for the CEO of
all 68 Councils split into common groupings (based on size, locations and Council scale) is:
(See Table 2 for details)
3. The average annual salary (comprised of base salary, super and motor vehicle) for the CEOs of all 68
Councils split into groups as per Elected Members Remuneration Tribunal Classification (i.e. Group 1,
etc)
Measure
January 2015 Total
Base Salary, Super
and Vehicle
January 2014 Total
Base Salary, Super
and Vehicle
July 2013
Total Base Salary,
Super and Vehicle
Average CEO
Salary
$207,902
$202,342
$196,041
Average CEO
Salary
January 2015
Total Base Salary,
Super and Vehicle
January 2014
Total Base Salary,
Super and Vehicle
July 2013
Total Base Salary,
Super and Vehicle
G6 + ACC
$308,379
$302,742
$295,169
Other Metro
$253,915
$240,826
$239,698
Outer Metro
$230,864
$217,867
$217,549
Regional
$200,794
$194,007
$188,008
Small Regional
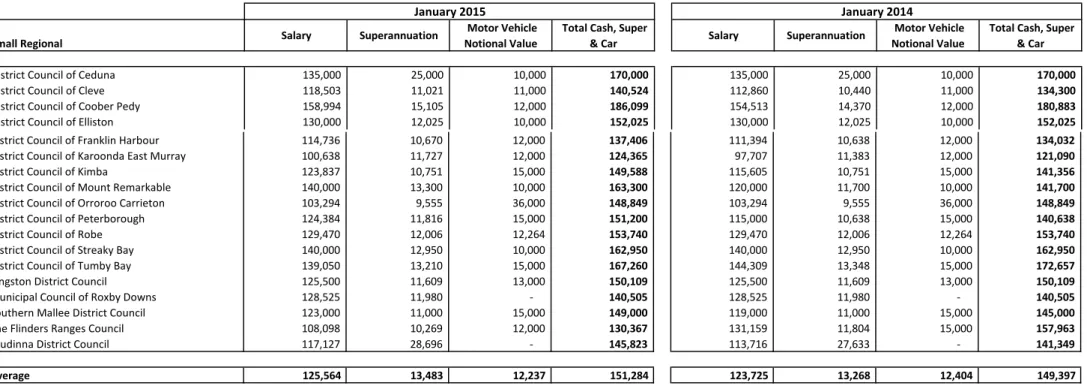
$151,284
$149,397
$143,022
Average CEO
Salary
January 2015
Total Base Salary,
Super and Vehicle
January 2014
Total Base Salary,
Super and Vehicle
July 2013
Total Base Salary,
Super and Vehicle
Group 1
$300,377
$293,550
$286,982
Group 2
$241,110
$232,507
$225,135
Group 3
$214,088
$207,115
$201,474
Group 4
$180,877
$175,524
$169,976
Group 5
$151,284
$149,397
$143,022
Salary Benchmarking
LGA SA
Page 3
Notes on Other Benefits
The salary package numbers reported throughout this report are the summation of Base Salary, Superannuation
and the contractual value of Motor Vehicle supplied to the CEO. These numbers should be consistent with the
Salaries Register maintained by Councils and available for public review.
The following additional benefits have been excluded due to the subjective nature of their valuation:
Additional Annual Leave
Special Leave
Performance Bonuses
Council supplied housing
Other Allowances
Private phone calls (mobile and land line)
Subscriptions
Professional Memberships
A vast majority of “Other Benefits” is made up of additional annual leave (15 instances have been reported)
which ranges from 1 to 2 weeks.
Notes on Calculations
The following notes should be read in conjunction with the tables produced.
Superannuation is 9.5% unless the CEO is in the Defined Benefit scheme where it is currently 9.55%. Few CEOs
have negotiated additional superannuation contributions in lieu of salary – all these factors are reflected in the
Total Salary Package calculation.
A number of Councils are reporting superannuation contributors of 9.0% or 9.3% (the old statutory and defined
benefits rate).
The value of motor vehicles is as advised by individual Councils and is between $7,000 and $15,000 with one
outlier at $36,000.
Additional benefits such as additional salary benefits, additional annual leave and rent assistance have not been
assigned a commercial value. A number of CEO respondents have presented an argument that additional leave
(taken in the year of allocation) does not have a commercial value nor a financial cost to the Council. With this
argument in mind, several CEOs have elected not to disclose additional annual leave. To ensure equity and
accuracy, base salary, superannuation and motor vehicle components of the CEOs salary package have only
been included.
Salary Benchmarking
LGA SA
Page 4
Average Increase in Salaries
South Australian Local Government Councils
In the period July 2013 to January 2014, the average increase across all Local Government CEO Salaries was
3.17%.
In the period January 2014 to January 2015 the average increase across all Local Government CEO Salaries was
2.75%.
South Australian Public Service
The average increase for CEOs in the Public Sector has been 2.0% per annum. Salary increases for Public Sector
CEOs have been constrained in line with general salary constraints placed upon the Public Sector by
Government.
State Government Business Entities
A cross section of CEOs from State Government Business Entities sector (i.e. directly owned or substantially
funded by State Government) shows an increase of 2.0% per annum between 2013 and 2014.
This low rate is a result of Government fiscal restraint.
Not for Profit Sector
A cross section of salaries of CEOs from the Not for Profit Sector are outlined below.
Generally salary increases in this sector mirror that of the Private Sector as major Not For Profits seek to attract
and retain skilled corporate leaders. This is further reinforced by the presence of Corporate Leaders occupying
key decision making Board positions. It is for this reason that the average salary increase across this sector has
been around 3.0% per annum for the past 3 – 4 years.
National Average Private Sector
The average increase for CEOs on a national basis has been between 3.0% and 4.0% per annum with general
constraint being common place in many companies for the past 3 to 4 years driven primarily by subdued
economic climate.
South Australian Average Private Sector
The average increase for CEOs in the private sector in South Australia has been 2.5% and 3.5% per annum with
general constraint being common place in many companies for the past 3 to 4 years driven primarily by subdued
economic climate.
Salary Benchmarking LGA SA Page 5
January 2015.
The Role of CEO
The CEO is the highest ranking officer within an organisation and is responsible for the total management of an
organisation. Whilst the business they are leading may vary their broad responsibilities cover:
•
Leadership
•
Financial Management
•
Strategic Planning
•
Governance
•
Stakeholder Management
Hence the salaries of CEOs within different sectors are able to be compared.
It should be noted, however, that in comparison to CEOs in other sectors, those in Local Government are
employed by Council and so report to the whole Council.
Councils business requires these Executives and their Senior Management Team to attend Council meetings and
Workshops which are usually held after hours. The number of nights per month is dependent the number of
meetings held. These meetings have no time limit.
Chief Executives within Local Government are also expected to attend community functions which again are
often after hours and on weekends. There is generally no time in lieu for this time commitment and is an
expectation of the role of the Chief Executive.
Salary Benchmarking
LGA SA
Page 6
Interstate data
Below are a sample of Councils from Western Australia, Victoria and New South Wales (selected as these States
border SA). Salary Packages are similar in size and composition to those available in South Australia.
Western Australia
CEO Salary Package
Council
Numbers
Staff
Budget
Salary
Super
Vehicle
Super and Car
Total Cash,
Albany
365
$84,000,000
$248,890
$23,644
$8,600
$281,135
Broome
155 (FTE)
$37,282,130
$220,910
$34,241
$15,000
$270,151
Kalgoorlie-Boulder
410
$67,715,000
$249,000
$22,410
$15,000
$286,410
Perth
610
$166,000,000
$330,285
$31,377
-
$361,662
South Perth
268
$46,375,000
$226,510
$35,108
$15,000
$276,618
Victoria Park
185
$47,914,000
$206,002
$35,020
$10,000
$251,022
Average
$287,833
Other states
CEO Salary Package
Council
Staff Numbers
Budget
Salary
Super
Vehicle
Super and Car
Total Cash
Glenelg Shire Vic
247
$61,000,000
$208,461
$20,640
$8,800
$237,901
Broken Hill
Council
240
$13,975,000
$174,216
16,115
$11,000
$201,331
Warrnambool
City Council
404.52 (FTE)
$70,000,000
$253,323
$25,015
$10,000
$288,338
Average
$242,523
Salary Benchmarking LGA SA Page 7
January 2015.
State Government Business Entities
Below is a cross section of CEOs from State Government Business Entities sector (i.e. directly owned or
substantially funded by State Government). Salary packages range in size in a similar way as salaries do in the
Local Government Sector.
Salaries for the 4 SGBE’s listed below have increased on average by 2.0% since December 2013.
December 2014 Salaries / Wages
2013
SGB Entities
Budget
Count
Head
Salary
Super
Vehicle
Total Package
Package
Salary
Growth
SGBE # 1
$48,500,000
200
$258,060.00 $24,515.70
$19,000.00
$301,575.70
$296,200.00
1.81%
SGBE # 2
$18,844,000
110
$215,229.18 $20,446.77
$235,675.95
$230,000.00
2.47%
SGBE # 3
$8,258,000
50
$176,154.00 $16,734.63
$192,888.63
$188,243.00
2.47%
SGBE # 4
$4,600,000
15
$139,230.00 $13,226.85
$152,456.85
$150,000.00
1.64%
Average
$220,649.28
$216,110.75
Average
Increase
1.02%
Salary Benchmarking LGA SA Page 8
January 2015.
Not For Profit Sector
A cross section of CEOs from the Not for Profit sector is shown below.
Salaries have increased for the Not for Profits listed below by an average of 3.0% since January 2014.
2014 Salaries / Wages
NFP Entities
Budget/Income
Head Counts
Salary
Superannuation
Notional Value
Motor Vehicle
Total Package
NFP # 1
$3,300,000
13
$131,896.57
$12,530.17
$144,426.74
NFP # 2
$17,800,000
573
$264,524.60
$25,129.84
$25,000.00
$314,654.44
NFP # 3
$18,950,000
145
$263,981.70
$25,078.26
$289,059.96
NFP # 4
$48,300,000
200
$285,516.00
$27,124.02
$19,000.00
$331,640.02
NFP # 5
$53,000,000
1100
$259,267.74
$24,630.44
$12,000.00
$295,898.17
NFP # 6
$105,000,000
1500
$259,267.74
$24,630.44
$283,898.17
Average
$276,596.25
Yours sincerely,
AME Recruitment Pty Ltd
Adam Kennedy
Senior Consultant
Phone: (08) 8228 3800
Email:
[email protected]
Salary Benchmarking
LGA SA
Page 9
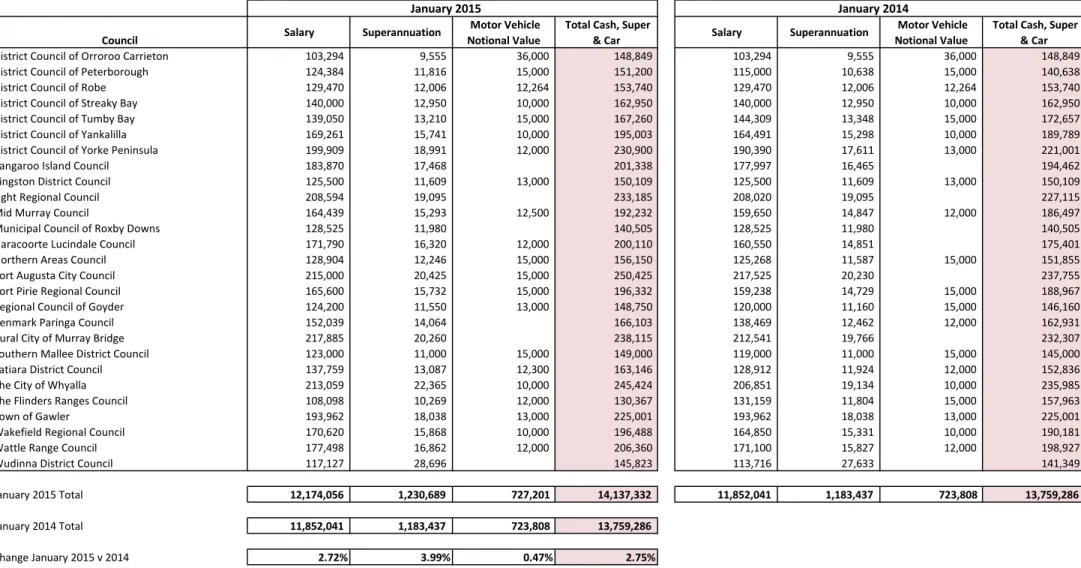
Table 1 -
All Councils
January 2015 vs January 2014
Council Salary Superannuation
Motor Vehicle Notional Value
Total Cash, Super
& Car Salary Superannuation
Motor Vehicle Notional Value
Total Cash, Super & Car
Adelaide City Council 344,944 33,864 19,192 398,000 344,944 33,864 19,192 398,000
Adelaide Hills Council 191,981 18,238 12,894 223,113 186,184 17,222 12,894 216,300
Alexandrina Council 225,339 22,534 12,000 259,873 214,608 21,461 12,000 248,069
Barossa Council 197,440 18,760 13,800 230,000 185,400 17,150 13,800 216,350
Campbelltown City Council 218,400 20,748 12,000 251,148 206,664 19,116 15,433 241,213
City of Burnside 198,895 19,365 4,949 223,209 190,327 17,700 8,743 216,770
City of Charles Sturt 258,853 31,827 13,000 303,680 258,853 31,827 13,000 303,680
City of Holdfast Bay 216,417 20,019 14,272 250,708 209,193 19,350 14,272 242,815
City of Marion 275,989 24,839 8,000 308,828 275,989 24,839 8,000 308,828
City of Mitcham 240,500 22,848 12,000 275,348 228,924 21,591 12,000 262,515
City of Mount Gambier 202,363 20,742 12,000 235,105 195,520 20,040 12,000 227,560
City of Norwood Payneham & St Peters 221,650 20,613 12,000 254,263 221,650 20,613 12,000 254,263
City of Onkaparinga 247,693 24,769 19,500 291,962 220,815 20,425 18,760 260,000
City of Playford 241,765 22,484 264,250 234,496 21,808 256,304
City of Port Adelaide Enfield 252,199 27,761 15,000 294,960 252,199 27,761 15,000 294,960
City of Port Lincoln 161,758 14,944 8,500 185,202 161,758 14,944 8,500 185,202
City of Prospect 219,422 20,845 8,880 249,067 213,451 19,744 8,800 241,995
City of Salisbury 256,041 23,684 24,000 303,725 256,041 23,684 24,000 303,725
City of Tea Tree Gully 235,590 21,910 257,500 228,728 21,272 250,000
City of Unley 213,194 21,346 11,500 246,040 206,650 20,178 11,500 238,328
City of Victor Harbor 200,159 18,515 12,000 230,674 193,835 17,633 12,000 223,468
City of West Torrens 246,188 59,332 305,520 240,156 57,332 297,488
Clare & Gilbert Valleys Council 161,406 14,930 15,000 191,336 161,406 14,930 15,000 191,336
Coorong District Council 152,500 14,106 12,500 179,106 152,500 14,106 12,500 179,106
Corporation of the Town of Walkerville 194,512 18,089 7,000 219,601 194,512 18,089 7,000 219,601
District Council Mount Barker 221,865 22,614 244,479 199,677 18,470 218,147
District Council of Barunga West 120,000 11,160 13,150 144,310 120,000 11,160 13,150 144,310
District Council of Berri Barmera 171,376 16,281 187,657 166,073 15,362 181,435
District Council of Ceduna 135,000 25,000 10,000 170,000 135,000 25,000 10,000 170,000
District Council of Cleve 118,503 11,021 11,000 140,524 112,860 10,440 11,000 134,300
District Council of Coober Pedy 158,994 15,105 12,000 186,099 154,513 14,370 12,000 180,883
District Council of Copper Coast 185,764 17,648 15,000 218,412 180,353 16,682 15,000 212,035
District Council of Elliston 130,000 12,025 10,000 152,025 130,000 12,025 10,000 152,025
District Council of Franklin Harbour 114,736 10,670 12,000 137,406 111,394 10,638 12,000 134,032
District Council of Grant 152,505 14,107 12,000 178,609 146,640 13,564 12,000 172,204
District Council of Karoonda East Murray 100,638 11,727 12,000 124,365 97,707 11,383 12,000 121,090
District Council of Kimba 123,837 10,751 15,000 149,588 115,605 10,751 15,000 141,356
District Council of Lower Eyre Peninsula 144,200 13,338 157,538 140,000 13,020 153,020
District Council of Loxton Waikerie 175,416 16,314 10,000 201,730 169,485 15,762 10,000 195,247
District Council of Mallala 173,188 16,020 15,000 204,208 168,144 15,553 15,000 198,697
District Council of Mount Remarkable 140,000 13,300 10,000 163,300 120,000 11,700 10,000 141,700
Council Salary Superannuation
Motor Vehicle Notional Value
Total Cash, Super
& Car Salary Superannuation
Motor Vehicle Notional Value
Total Cash, Super & Car
District Council of Orroroo Carrieton 103,294 9,555 36,000 148,849 103,294 9,555 36,000 148,849
District Council of Peterborough 124,384 11,816 15,000 151,200 115,000 10,638 15,000 140,638
District Council of Robe 129,470 12,006 12,264 153,740 129,470 12,006 12,264 153,740
District Council of Streaky Bay 140,000 12,950 10,000 162,950 140,000 12,950 10,000 162,950
District Council of Tumby Bay 139,050 13,210 15,000 167,260 144,309 13,348 15,000 172,657
District Council of Yankalilla 169,261 15,741 10,000 195,003 164,491 15,298 10,000 189,789
District Council of Yorke Peninsula 199,909 18,991 12,000 230,900 190,390 17,611 13,000 221,001
Kangaroo Island Council 183,870 17,468 201,338 177,997 16,465 194,462
Kingston District Council 125,500 11,609 13,000 150,109 125,500 11,609 13,000 150,109
Light Regional Council 208,594 19,095 233,185 208,020 19,095 227,115
Mid Murray Council 164,439 15,293 12,500 192,232 159,650 14,847 12,000 186,497
Municipal Council of Roxby Downs 128,525 11,980 140,505 128,525 11,980 140,505
Naracoorte Lucindale Council 171,790 16,320 12,000 200,110 160,550 14,851 175,401
Northern Areas Council 128,904 12,246 15,000 156,150 125,268 11,587 15,000 151,855
Port Augusta City Council 215,000 20,425 15,000 250,425 217,525 20,230 237,755
Port Pirie Regional Council 165,600 15,732 15,000 196,332 159,238 14,729 15,000 188,967
Regional Council of Goyder 124,200 11,550 13,000 148,750 120,000 11,160 15,000 146,160
Renmark Paringa Council 152,039 14,064 166,103 138,469 12,462 12,000 162,931
Rural City of Murray Bridge 217,885 20,260 238,115 212,541 19,766 232,307
Southern Mallee District Council 123,000 11,000 15,000 149,000 119,000 11,000 15,000 145,000
Tatiara District Council 137,759 13,087 12,300 163,146 128,912 11,924 12,000 152,836
The City of Whyalla 213,059 22,365 10,000 245,424 206,851 19,134 10,000 235,985
The Flinders Ranges Council 108,098 10,269 12,000 130,367 131,159 11,804 15,000 157,963
Town of Gawler 193,962 18,038 13,000 225,001 193,962 18,038 13,000 225,001
Wakefield Regional Council 170,620 15,868 10,000 196,488 164,850 15,331 10,000 190,181
Wattle Range Council 177,498 16,862 12,000 206,360 171,100 15,827 12,000 198,927
Wudinna District Council 117,127 28,696 145,823 113,716 27,633 141,349
12,174,056 1,230,689 727,201 14,137,332 11,852,041 1,183,437 723,808 13,759,286 11,852,041 1,183,437 723,808 13,759,286 January 2015 Total January 2014 Total Change January 2015 v 2014 2.72% 3.99% 0.47% 2.75% January 2015 January 2014
Table 2
-
Region
G6 + ACC Salary Superannuation
Motor Vehicle Notional Value
Total Cash, Super
& Car Salary Superannuation
Motor Vehicle Notional Value
Total Cash, Super & Car
Adelaide City Council 344,944 33,864 19,192 398,000 344,944 33,864 19,192 398,000
City of Charles Sturt 258,853 31,827 13,000 303,680 258,853 31,827 13,000 303,680
City of Marion 275,989 24,839 8,000 308,828 275,989 24,839 8,000 308,828
City of Onkaparinga 247,693 24,769 19,500 291,962 220,815 20,425 18,760 260,000
City of Port Adelaide Enfield 252,199 27,761 15,000 294,960 252,199 27,761 15,000 294,960
City of Salisbury 256,041 23,684 24,000 303,725 256,041 23,684 24,000 303,725
City of Tea Tree Gully 235,590 21,910 - 257,500 228,728 21,272 - 250,000
Average 267,330 26,951 14,099 308,379 262,510 26,239 13,993 302,742
Other Metro Salary Superannuation
Motor Vehicle Notional Value
Total Cash, Super
& Car Salary Superannuation
Motor Vehicle Notional Value
Total Cash, Super & Car
City of Mitcham 240,500 22,848 12,000 275,348 228,924 21,591 12,000 262,515
City of Playford 241,765 22,484 - 264,250 234,496 21,808 - 256,304
City of West Torrens 246,188 59,332 - 305,520 240,156 57,332 - 297,488
Campbelltown City Council 218,400 20,748 12,000 251,148 206,664 19,116 15,433 241,213
City of Burnside 198,895 19,365 4,949 223,209 190,327 17,700 8,743 216,770
City of Holdfast Bay 216,417 20,019 14,272 250,708 209,193 19,350 14,272 242,815
City of Norwood Payneham & St Peters 221,650 20,613 12,000 254,263 221,650 20,613 12,000 254,263
City of Prospect 219,422 20,845 8,880 249,067 213,451 19,744 8,800 241,995
City of Unley 213,194 21,346 11,500 246,040 206,650 20,178 11,500 238,328
Corporation of the Town of Walkerville 194,512 18,089 7,000 219,601 194,512 18,089 7,000 219,601
Average 221,094 24,569 8,260 253,915 214,602 23,552 8,975 247,129
Outer Metro Salary Superannuation
Motor Vehicle Notional Value
Total Cash, Super
& Car Salary Superannuation
Motor Vehicle Notional Value
Total Cash, Super & Car
Adelaide Hills Council 191,981 18,238 12,894 223,113 186,184 17,222 12,894 216,300
District Council Mount Barker 221,865 22,614 - 244,479 199,677 18,470 - 218,147
Town of Gawler 193,962 18,038 13,000 225,001 193,962 18,038 13,000 225,001
Average 202,603 19,630 8,631 230,864 193,274 17,910 8,631 219,816
January 2015 January 2014
January 2015 January 2014
Regional Salary Superannuation Motor Vehicle Notional Value Total Cash, Super & Car Salary Superannuation Motor Vehicle Notional Value Total Cash, Super & Car
Alexandrina Council 225,339 22,534 12,000 259,873 214,608 21,461 12,000 248,069
Barossa Council 197,440 18,760 13,800 230,000 185,400 17,150 13,800 216,350
City of Mount Gambier 202,363 20,742 12,000 235,105 195,520 20,040 12,000 227,560
Rural City of Murray Bridge 217,885 20,260 - 238,115 212,541 19,766 - 232,307
The City of Whyalla 213,059 22,365 10,000 245,424 206,851 19,134 10,000 235,985
City of Port Lincoln 161,758 14,944 8,500 185,202 161,758 14,944 8,500 185,202
City of Victor Harbor 200,159 18,515 12,000 230,674 193,835 17,633 12,000 223,468
District Council of Berri Barmera 171,376 16,281 - 187,657 166,073 15,362 - 181,435
District Council of Copper Coast 185,764 17,648 15,000 218,412 180,353 16,682 15,000 212,035
District Council of Loxton Waikerie 175,416 16,314 10,000 201,730 169,485 15,762 10,000 195,247
District Council of Yorke Peninsula 199,909 18,991 12,000 230,900 190,390 17,611 13,000 221,001
Light Regional Council 208,594 19,095 - 233,185 208,020 19,095 - 227,115
Port Augusta City Council 215,000 20,425 15,000 250,425 217,525 20,230 - 237,755
Port Pirie Regional Council 165,600 15,732 15,000 196,332 159,238 14,729 15,000 188,967
Wattle Range Council 177,498 16,862 12,000 206,360 171,100 15,827 12,000 198,927
Clare & Gilbert Valleys Council 161,406 14,930 15,000 191,336 161,406 14,930 15,000 191,336
Coorong District Council 152,500 14,106 12,500 179,106 152,500 14,106 12,500 179,106
District Council of Barunga West 120,000 11,160 13,150 144,310 120,000 11,160 13,150 144,310
District Council of Grant 152,505 14,107 12,000 178,609 146,640 13,564 12,000 172,204
District Council of Lower Eyre Peninsula 144,200 13,338 - 157,538 140,000 13,020 - 153,020
District Council of Mallala 173,188 16,020 15,000 204,208 168,144 15,553 15,000 198,697
District Council of Yankalilla 169,261 15,741 10,000 195,003 164,491 15,298 10,000 189,789
Kangaroo Island Council 183,870 17,468 - 201,338 177,997 16,465 - 194,462
Mid Murray Council 164,439 15,293 12,500 192,232 159,650 14,847 12,000 186,497
Naracoorte Lucindale Council 171,790 16,320 12,000 200,110 160,550 14,851 - 175,401
Northern Areas Council 128,904 12,246 15,000 156,150 125,268 11,587 15,000 151,855
Regional Council of Goyder 124,200 11,550 13,000 148,750 120,000 11,160 15,000 146,160
Renmark Paringa Council 152,039 14,064 - 166,103 138,469 12,462 12,000 162,931
Tatiara District Council 137,759 13,087 12,300 163,146 128,912 11,924 12,000 152,836
Wakefield Regional Council 170,620 15,868 10,000 196,488 164,850 15,331 10,000 190,181
Average 174,128 16,492 9,992 200,794 168,719 15,723 9,565 194,007
January 2015 January 2014
District Council of Franklin Harbour 114,736 10,670 12,000 137,406 111,394 10,638 12,000 134,032
District Council of Karoonda East Murray 100,638 11,727 12,000 124,365 97,707 11,383 12,000 121,090
District Council of Kimba 123,837 10,751 15,000 149,588 115,605 10,751 15,000 141,356
District Council of Mount Remarkable 140,000 13,300 10,000 163,300 120,000 11,700 10,000 141,700
District Council of Orroroo Carrieton 103,294 9,555 36,000 148,849 103,294 9,555 36,000 148,849
District Council of Peterborough 124,384 11,816 15,000 151,200 115,000 10,638 15,000 140,638
District Council of Robe 129,470 12,006 12,264 153,740 129,470 12,006 12,264 153,740
District Council of Streaky Bay 140,000 12,950 10,000 162,950 140,000 12,950 10,000 162,950
District Council of Tumby Bay 139,050 13,210 15,000 167,260 144,309 13,348 15,000 172,657
Kingston District Council 125,500 11,609 13,000 150,109 125,500 11,609 13,000 150,109
Municipal Council of Roxby Downs 128,525 11,980 - 140,505 128,525 11,980 - 140,505
Southern Mallee District Council 123,000 11,000 15,000 149,000 119,000 11,000 15,000 145,000
The Flinders Ranges Council 108,098 10,269 12,000 130,367 131,159 11,804 15,000 157,963
Wudinna District Council 117,127 28,696 - 145,823 113,716 27,633 - 141,349
Average 125,564 13,483 12,237 151,284 123,725 13,268 12,404 149,397
Small Regional Salary Superannuation Motor Vehicle Notional Value Total Cash, Super & Car Salary Superannuation Notional Value Motor Vehicle Total Cash, Super & Car
135,000 25,000 10,000 170,000 135,000 25,000 10,000 170,000
118,503 11,021 11,000 140,524 112,860 10,440 11,000 134,300
158,994 15,105 12,000 186,099 154,513 14,370 12,000 180,883
District Council of Ceduna District Council of Cleve District Council of Coober Pedy
District Council of Elliston 130,000 12,025 10,000 152,025 130,000 12,025 10,000 152,025
January 2015 January 2014