SELECTING AND PREPARING TEACHERS AND SCHOOL LEADERS TO IMPROVE EDUCATIONAL OUTCOMES
Kevin C. Bastian
A dissertation submitted to the faculty of the University of North Carolina at Chapel Hill in partial fulfillment of the requirements for the degree of Doctor of Philosophy in the
Department of Public Policy.
Chapel Hill 2013
iii
ABSTRACT
KEVIN C. BASTIAN: Selecting and Preparing Teachers and School Leaders to Improve Educational Outcomes
(Under the direction of Gary Henry)
In the following three studies we explore ways to improve the quality of school-based personnel by identifying characteristics and training of effective teachers and principals. First, to enhance the selection and hiring of teachers into preparation programs and/or school districts, we examine whether teachers’ non-cognitive characteristics predict teacher value-added and evaluation ratings. This work builds upon research in psychology and economics which shows the impact of individuals’ cognitive attributes on outcomes of interest. Here, evidence indicates that teachers’ non-cognitive characteristics significantly influence student achievement gains and predict higher evaluation ratings. Due to the select sample of teachers examined in this analysis—Teach For America corps members—this work represents a “proof of concept” and calls for continued research on a more representative sample of teachers.
iv
patterns—high rates of turnover coupled with the attrition of less effective teachers—help explain their performance. This suggests policy mechanisms to increase the in-state prepared teaching population and improve the quality of out-of-state prepared teachers.
v
ACKNOWLEDGEMENTS
I came to North Carolina in the summer of 2006, fresh out of college and ready to make a difference as a Teach For America corps member. As an undergraduate I had studied the Civil Rights Movement and naturally, saw educational equity as the civil rights issue of today. During my two years teaching sixth grade language arts I learned a lot about myself and what I wanted. Most importantly, I learned that teaching was not my long-term career—I was only an average teacher at best—but that education, especially finding ways to systematically improve educational quality and outcomes for disadvantaged students, was a real passion. This led me to public policy and the belief that research and evidence-based policymaking plays a vital role in systematic change. Along this path, as I have progressed from a novice graduate student to an independent education researcher, I have learned and received support from many people who I wish to thank for helping me get to where I am today.
vi
and principal quality and more than anyone else, taught me how to think like a researcher. He has been the driving force to shape me into the researcher I am today.
I consider myself especially fortunate to have had a second mentor, Charles Thompson, throughout my graduate school tenure. Given our mutual affection for southern history and high-quality BLT sandwiches, it was always easy to hit it off with Charles. When it came to research Charles taught me the value of asking questions, challenged me to express ideas with greater clarity, and modeled how to make research findings graspable for the audience. I am deeply thankful to Charles for the faith and confidence he has always shown in me and for his commitment to improve education in North Carolina.
vii
same time. I feel fortunate to have learned from all of you, I look forward to continuing research projects with you, and I am happy to call you all friends.
I would also like to acknowledge my broader research community in North Carolina. I thank all of my committee members, including Doug Lauen, Jeremy Moulton, Bill McDiarmid, and Charles Clotfelter for providing guidance and support throughout my dissertation. I am honored to have worked with each of you and I look forward to future research collaboration. I also wish to thank Alisa Chapman with the University of North Carolina General Administration and the University of North Carolina Council of Education Deans for being truly great research partners. Our research has improved the teacher preparation programs at UNC system schools and I believe the best is yet to come.
I must also acknowledge my amazing graduate student cohort of Rod Rose, Shanyce Campbell, Jade Marcus, and Shelley Golden. Together, we made it through math camp, classes, and all our departmental exam requirements. Along the way we enjoyed lunches, ran up the steepest hills in Chapel Hill, worked on research projects, celebrated accomplishments and holidays, and shared in landmark moments in each other’s lives. I believe graduate school is an experience best done with a cohort and I could not have asked for a better one. I look forward to seeing all the incredible things you do.
viii
memories. Most of all I thank Kiani and Matthew Gardner—I cannot think of North Carolina without thinking of our trivia nights, time on the lake, and nearly constant laughter.
ix
TABLE OF CONTENTS
List of Tables ... xiii
List of Figures ...xv
Overview ... 1
Chapter 1: Do Teachers’ Non-Cognitive Skills and Traits Predict Effectiveness and Evaluation Ratings? ... 14
Summary ... 14
Introduction ... 15
Background ... 17
The Effects of Cognitive Ability on Teacher Effectiveness ... 17
What Are Non-Cognitive Characteristics? ... 19
The Effects of Non-Cognitive Skills and Traits ... 20
Data and Sample ... 23
Background on Teach For America ... 23
Teach For America Data ... 25
Research Sample ... 30
Dependent Variables and Covariates ... 32
Analysis Plan ... 35
Teacher Effectiveness ... 35
x
Findings ... 39
Teacher Effectiveness ... 39
Evaluation Ratings of Teacher Competencies ... 42
Discussion ... 44
References ... 50
Chapter 2: Teachers Without Borders: Consequences of Teacher Labor Force Mobility ... 62
Summary ... 62
Introduction ... 63
Prior Research on the Effects of Teacher Preparation ... 66
Explanations of Performance Disparities ... 70
The Quality of Imported Teachers ... 70
Teachers’ Lack of Familiarity with the Importing State ... 71
Teacher Turnover and Differential Attrition ... 73
Data and Sample... 74
Classification of Teachers ... 75
Study Sample ... 76
Dependent Variables and Covariates ... 77
Analysis Plan ... 78
Teacher Value-Added ... 78
xi
Findings ... 81
Descriptive Information ... 81
How Effective Are Out-of-State Prepared Teachers? ... 82
Why Do Out-of-State Prepared Teachers Underperform? ... 84
Discussion ... 90
References ... 94
Chapter 3: The Apprentice: Pathways to the Principalship and Their Effects on Student Achievement ... 106
Summary ... 106
Introduction ... 107
Background ... 109
Estimating Principal Effectiveness ... 109
Research on Principal Effectiveness and Its Determinants... 112
Why Prior Work Environments May Matter ...114
Data and Sample ... 116
Data Sources ... 116
Research Sample ... 117
Measures ...118
Analysis Plan ... 122
Findings ... 124
What Are the Characteristics of First-Time Principals and the Schools That Hire Them? ... 124
xii
Discussion ... 131
References ... 137
Conclusion ... 148
Appendix A: Additional Results from Chapter One ... 153
Appendix B: Estimating the Apprenticeship Learning Environment ... 158
xiii
LIST OF TABLES
Table 1.1: Descriptive Information for the TFA Data ... 56
Table 1.2: The Selectivity of TFA Corps Members ... 57
Table 1.3: Covariates Used in Value-Added Analyses ... 58
Table 1.4: Do Non-Cognitive Skills and Traits Predict Teacher Effectiveness in Elementary Grades? ... 59
Table 1.5: Do Non-Cognitive Skills and Traits Predict Teacher Effectiveness in High School? ... 60
Table 1.6: Do Non-Cognitive Skills and Traits Predict Teacher Evaluation Ratings? ... 61
Table 2.1: Covariates for Analyses ... 98
Table 2.2: Teacher Preparation Category Descriptive Information ... 99
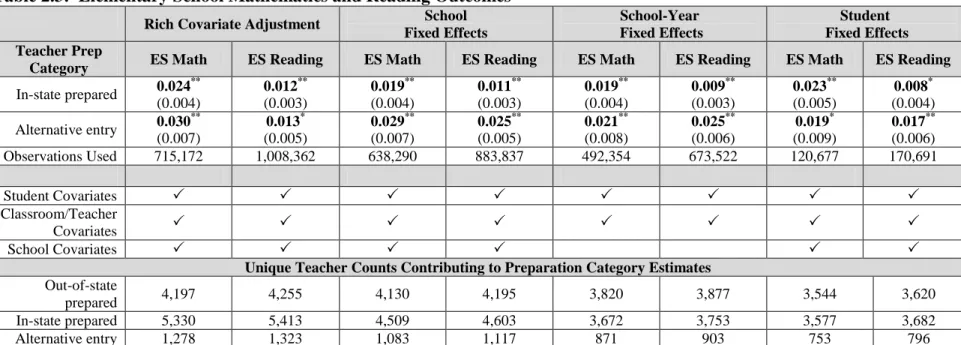
Table 2.3: Elementary School Mathematics and Reading Outcomes ... 100
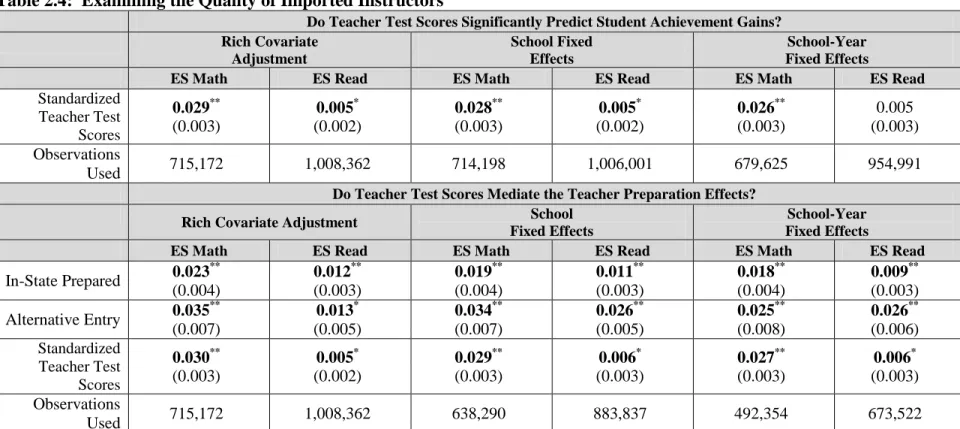
Table 2.4: Examining the Quality of Imported Instructors ... 101
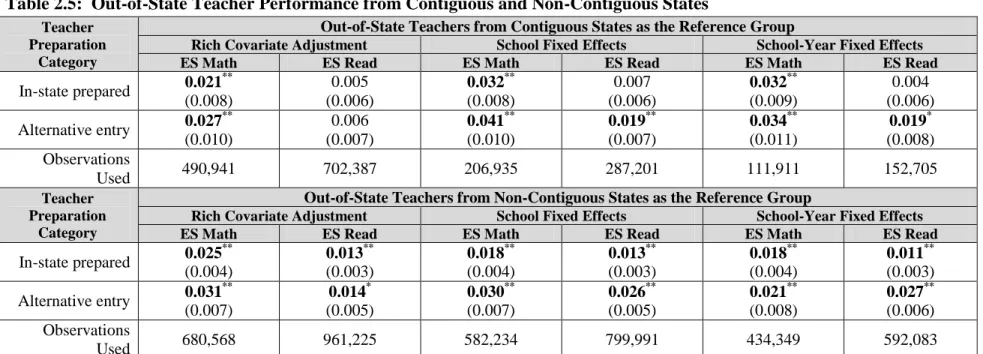
Table 2.5: Out-of-State Teacher Performance from Contiguous and Non-Contiguous States... 102
Table 2.6: Comparing the Effectiveness of First Year Teachers ... 103
Table 2.7: Logistic Regression Results for Teacher Turnover ... 104
Table 2.8: Teacher Effectiveness for Out-of-State Teachers Who Stay or Leave ... 105
Table 3.1: Covariates Available for Value-Added Models ... 142
Table 3.2: Demographic Information and Career Trajectory ... 143
Table 3.3: School Characteristics Inherited by First-Time Principal Sample ... 144
Table 3.4: Principal Characteristics and Student Achievement ... 145
xiv
Appendix Table A1: Teacher Evaluation Scores from the 2010-11
School Year ... 154 Appendix Table A2: Do Non-Cognitive Skills and Traits Predict
Teacher Effectiveness in Elementary Grades ... 155 Appendix Table A3: Do Non-Cognitive Skills and Traits Predict
Teacher Effectiveness in High School ... 156 Appendix Table A4: Do Non-Cognitive Skills and Traits Predict
Teacher Evaluation Ratings ... 157 Appendix Table C1: Individual Principal Characteristics and
Student Achievement ... 162 Appendix Table C2: Previous Work Environment Characteristics and
Student Achievement ... 164 Appendix Table C3: Individual Principal Characteristics and
Student Achievement ... 165 Appendix Table C4: Individual Principal Characteristics and
Student Achievement ... 167 Appendix Table C5: Previous Work Environment Characteristics and
Student Achievement ... 169 Appendix Table C6: Previous Work Environment Characteristics and
xv
LIST OF FIGURES
Figure 3.1 The Distribution of Principal Experience—
2006-07 through 2010-11 ... 140 Figure 3.2 School Performance During the Transition to a
OVERVIEW
The provision of high-quality public education entails clear, substantial benefits for both individuals and society. Individual wage returns to another year of education are approximately ten percent, larger than the relative returns from other investments (Card, 1999; Harmon, Oosterbeek, & Walker, 2003; Psacharopoulos & Patrinos, 2004). Beyond wages, educational attainment is also associated with a number of other desired, individual and societal outcomes: improved health status and decreased mortality rates; reduced rates of unemployment and incarceration; improved child outcomes, including future educational attainment; increased tax contributions; and greater levels of civic participation (Adams, 2002; Dee, 2004; Jencks, 1972; Lleras-Muney, 2005; Lochner & Moretti, 2004; Ross & Wu, 1995; Rouse, 2005). Quite simply, in an increasingly competitive global economy, sizable economic incentives exist for policymakers to create education systems that promote greater achievement.
2
countries—of economically disadvantaged students in the United States and (2) the large achievement gaps between more and less-affluent students in the United States explains a substantial portion of these international performance differences (Carnoy & Rothstein, 2013). To quantify these achievement gaps, results from the 2011 4th grade mathematics National Assessment of Educational Progress (NAEP) show that, on average, students eligible for free school lunches scored 23 points below—0.79 standard deviation units— their non-eligible peers (National Center for Education Statistics, 2012). Further exacerbating these performance disparities in the United States is the inequitable distribution of educational resources—peers, teachers, and funding—to academically at-risk students (Bastian, Henry, & Thompson, 2012; Burke & Sass, 2008; Clotfelter, Ladd, & Vigdor, 2005; Downes & Stiefel, 2008; Lankford, Loeb, & Wyckoff, 2002). Overall, the effects of these achievement and inequality statistics threaten societal and economic development and present a significant impetus for policy action.
3
which they live may have long-term, beneficial effects on academic outcomes (Ladd, 2012).
4
earnings for a class of twenty-students, and students assigned to these high value-added teachers are more likely to attend college and higher-ranked colleges, live in higher SES neighborhoods, and save more for retirement (Chetty, Friedman, & Rockoff, 2011; Hanushek, 2011). For policymakers interested in education outcomes, improving teacher quality is a clear direction for action.
5
Overall, research evidence clearly demonstrates that the quality of teachers and school leaders significantly affects student achievement, and importantly, can mitigate the influence of family and demographic factors. To improve educational outcomes policymakers must increase the quality of school-based human capital available to students. This means enacting policies that better recruit/select, prepare, develop, evaluate, distribute, and retain high quality teachers and principals. Within each of these policy areas key questions remain, and therefore, the challenge for education policy researchers is to assemble evidence identifying promising policy practices.
In response to this challenge, I present a three chapter dissertation that contributes to the teacher and principal quality research agenda by: (1) identifying characteristics and training of effective teachers and principals (2) detailing directions for continued, follow-up research and (3) suggesting promising policy practices to promote teacher and principal effectiveness.
6
Mischel, Shoda, & Rodriguez, 1989; Rockoff, Jacob, Kane, & Staiger, 2011). Using data provided by Teach For America (TFA), I find that: (1) in elementary grades teachers’ organizational ability strongly predicted students’ achievement gains, while in high school, teachers’ respect (academic and behavior expectations) for students significantly predicted value-added effectiveness and (2) measures of teacher leadership and motivational ability significantly predicted higher evaluation ratings across multiple teacher competencies. While these results illustrate that non-cognitive characteristics can significantly affect outcomes of interest, the highly select research sample—TFA corps members—necessitates further work to determine whether and how the effects of non-cognitive characteristics generalize to a wider population of teachers. Therefore, this research represents a “proof of concept” and impetus for partnerships between researchers and practitioners (teacher preparation programs and school districts) to gather similar non-cognitive data and test effects. The policy implications of such work are clear, as findings could better equip teacher preparation programs and school districts to: (1) recruit and select/hire prospective teachers and (2) cultivate these non-cognitive characteristics.
7
8
prepared teachers’ transition into the state and (3) identifying screening and hiring practices to better select out-of-state prepared teachers.
9
tenure. From a policy perspective, this suggests that school districts’ patterns of assigning assistant principals and principals to schools should be carefully considered.
10
REFERENCES
Adams, S. (2002). Educational attainment and health: Evidence from a sample of older adults. Education Economics, 10(1), 97-109.
Aaronson, D., Barrow, L., & Sander, W. (2007). Teachers and student achievement in the Chicago public high schools. Journal of Labor Economics, 25(1), 95-135.
Bastian, K.C., Henry, G.T., & Thompson, C.L. (2013). Incorporating access to more effective teachers into assessments of educational resource equity. In press, Education Finance and Policy.
Bidwell, C., & Kasarda, J. (1980). Conceptualizing and measuring the effects of school and schooling. American Journal of Education, 88(4), 401-430.
Bifulco, R., & Ladd, H. (2006). The impacts of charter schools on student achievement: Evidence from North Carolina. Education Finance and Policy, 1(1), 50-90.
Booher-Jennings, J. (2005). Below the bubble: “Educational triage” and the Texas accountability system. American Educational Research Journal, 42(2), 231-268. Boyd, D., Lankford, H., Loeb, S., & Wyckoff, J. (2005). The draw of home: How teachers’ preferences for proximity disadvantage urban schools. Journal of Policy Analysis and Management, 24(1), 113-132.
Boyd, D., Grossman, P., Lankford, H., Loeb, S., & Wyckoff, J. (2006). How changes to entry requirements alter the teacher workforce and affect student achievement.
Education Finance and Police, 1(2), 176-216.
Boyd, D., Grossman, P., Lankford, H., Loeb, S., & Wyckoff, J. (2009). Teacher
preparation and student achievement. Educational Evaluation and Policy Analysis, 31(4), 416-440.
Branch, G., Hanushek, E., & Rivkin, S. (2012). Estimating the effect of leaders on public sector productivity: The case of school principals. NBER working Paper 17803.
Burke, M., & Sass, T. (2008). Classroom peer effects and student achievement. Federal Reserve Bank of Boston Working Paper 08-5.
Card, D. (1999). The causal effect of education on earnings. Handbook of Labor Economics, 3(1), 1801-1863.
11
Carnoy, M., & Rothstein, R. (2013). What do international tests really show about U.S. student performance. Economic Policy Institute. Available from:
http://www.epi.org/files/2013/EPI-What-do-international-tests-really-show-about-US-student-performance.pdf.
Chetty, R., Friedman, J., & Rockoff, J. (2011). The long-term impacts of teachers: Teacher value-added and student outcomes in adulthood. NBER Working Paper 17699. Clingman, J., & Fowler, R. (1976). The effects of primary reward on the I.Q.
performance of grade-school children as a function of initial I.Q. level. Journal of Applied Behavior Analysis, 9(1), 19-23.
Clotfelter, C., Ladd, H., & Vigdor, J. (2005). Who teaches whom? Race and the distribution of novice teachers. Economics of Education Review, 24(4), 377-392. Coelli, M., & Green, D. (2012). Leadership effects: School principals and student outcomes. Economics of Education Review, 31(1), 92-109.
Coleman, J., Campbell, E., Hobson, C., McPartland, J., Mood, A., Weinfeld, F., et al. (1966). Equality of Educational Opportunity. Washington, DC: U.S. Government Printing Office.
Dee, T. (2004). Are there civic returns to education? Journal of Public Economics, 88(9-10), 1697-1720.
Dhuey, E., & Smith, J. (2012). How important are school principals in the production of student achievement? Available from: www.sole-jole.org/11034.pdf.
Downes, T., & Stiefel, L. (2008). Measuring equity and adequacy in school finance. In H. Ladd & E. Fiske (Eds.), Handbook of Research in Education Finance and Policy. New York: Routledge.
Duckworth, A. Quinn, P., & Seligman, M. (2009). Positive predictors of teacher effectiveness. The Journal of Positive Psychology, 4(6), 540-547.
Eberts, R., & Stone, J. (1988). Student achievement in public schools: Do principals make a difference? Economics of Education Review, 7(3), 291-299.
Gates Foundation. (2010). Learning about teaching: Initial findings from the Measures of Effective Teaching project. MET Project Policy Brief.
12
Hanushek, E., & Rivkin, S. (2010). Using value-added measures of teacher quality. Calder Institute Policy Brief 9.
Hanushek, E. (2011). The economic value of higher teacher quality. Economics of Education Review, 30(3), 466-479.
Harmon, C., Oosterbeek, H., & Walker, I. (2003). The returns to education: Microeconomics. Journal of Economic Surveys, 17(2), 115-156.
Heckman, J.J., & Rubinstein, Y. (2001). The importance of non-cognitive skills: Lessons from the GED testing program. American Economic Review, 91(2), 145-149. Heckman, J.J. (2006). Skill formation and the economics of investing in disadvantaged children. Science, 312(5782), 1900-1902.
Jacob, B., & Lefgren, L. (2008). Can principals identify effective teachers? Evidence on subjective performance evaluation in education. Journal of Labor Economics, 26(1), 101-136.
Jencks, C. (1972). Inequality: A re-assessment of the effect of family and schooling in America. New York: Basic Books.
Kennedy, M. (2010). Attribution error and the quest for teacher quality. Educational Researcher, 39(8), 591-598.
Ladd, H., & Lauen, D. (2010). Status versus growth: The distributional effects of school accountability policies. Journal of Policy Analysis and Management, 29(3), 426-450. Ladd, H. (2012). Presidential address: Education and poverty: Confronting the evidence. Journal of Policy Analysis and Management, 31(2), 203-227.
Lankford, H., Loeb, S., & Wyckoff, J. (2002). Teacher sorting and the plight of urban schools: A descriptive analysis. Educational Evaluation and Policy Analysis, 24(1), 37-62.
Lleras-Muney, A. (2005). The relationship between education and adult mortality in the United States. Review of Economic Studies, 72(1), 189-221.
13
National Center for Education Statistics. (2012). Mathematics 2011: National Assessment of Education Progress at Grades 4 and 8. U.S. Department of Education: NCES 2012-458. Available from:
http://nces.ed.gov/nationsreportcard/pdf/main2011/2012458.pdf.
Nye, B. Konstantopoulos, S., & Hedges, L. (2004). How large are teacher effects? Educational Evaluation and Policy Analysis, 26(3), 237-257.
Psacharopoulos, G., & Patrinos, H.A. (2004). Returns to investment in education: A further update. Education Economics, 12(2), 111-134.
Reininger, M. (2012). Hometown disadvantage? It depends on where you’re from: Teachers’ location preferences and the implications for staffing schools. Educational Evaluation and Policy Analysis, 34(2), 127-145.
Robinson, V., Lloyd, C., & Rowe, K. (2008). The impact of leadership on student outcomes: An analysis of the differential effects of leadership types. Educational Administration Quarterly, 44(5), 635-674.
Rockoff, J. (2004). The impact of individual teachers on student achievement: Evidence from panel data. American Economic Review, 94(2), 247-252.
Rockoff, J., Jacob, B., Kane, T., & Staiger, D. (2011). Can you recognize an effective teacher when your recruit one? Education Finance and Policy, 6(1), 43-74.
Ross, C., & Wu, C. (1995). The links between education and health. American Sociological Review, 60(5), 719-745.
Rouse, C. (2005). The labor market consequences of an inadequate education. Prepared for the Equity Symposium on The Social Costs of Inadequate Education at Teachers’ College, Columbia University. Available from:
www.literacycooperative.org/documents/TheLaborMarketConsequencesofanInadequateE d.pdf.
Sewell, W., & Hauser, R. (1972). Causes and consequences of higher education: Models of the status attainment process. American Journal of Agricultural Economics, 54(2), 851-861.
Thompson, C.L., Brown, K.M., Townsend, L.W., Henry, G.T., & Fortner, C.K. (2011). Turning around North Carolina’s lowest achieving schools (2006-2010). Consortium for Educational Research and Evaluation—North Carolina. Available from:
http://publicpolicy.unc.edu/research/publications-presentations-and-reports.
CHAPTER ONE
Do Teachers’ Non-Cognitive Skills and Traits Predict Effectiveness and Evaluation Ratings?1
SUMMARY
Building upon research in economics and psychology that shows the significant effects of individuals’ non-cognitive characteristics on outcomes of interest, this paper uses data from Teach For America’s corps member selection process to ask whether measures of teachers’ non-cognitive characteristics predict value-added and evaluation ratings of teacher competencies. Overall, results indicate that non-cognitive skills and traits exert a significant influence on teacher quality. Teachers’ organizational ability and academic/behavioral expectations of students predicted value-added gains in elementary grades and high school, respectively, while expected non-cognitive characteristics (e.g. leadership) predicted higher ratings for specific teacher competencies (e.g. teachers demonstrate leadership). This research represents a “proof of concept” concerning the influence of non-cognitive characteristics; the importance of this work for policy—better equipping preparation programs and school districts to recruit and select/hire teachers and cultivate these traits—necessitates continued research on a more representative sample of teachers.
1Kevin C. Bastian is the sole author on this paper and completed all data management, analysis, and
15
INTRODUCTION
Increasingly, a rich body of research in economics and psychology indicates that individuals’ non-cognitive skills and traits—e.g. perseverance, self-control, motivational ability—significantly influence academic and labor market outcomes of interest. For example, Duckworth and Seligman show that measures of self-discipline, not IQ scores, more accurately predict middle school students’ grade point averages (Duckworth & Seligman, 2005), while Heckman and Rubinstein find that differences in non-cognitive characteristics explain the wage differentials between high school graduates and GED holders (Heckman & Rubinstein, 2001). Further evidence suggests that individuals’ non-cognitive characteristics are malleable and can be cultivated through direct intervention (Mischel, Shoda, & Rodriguez, 1989).
16
classroom learning is dependent upon the cooperation and investment of students, a teacher’s motivational ability—making students believe they can and want to learn course material—may impact student achievement gains (Ames, 1990; Cohen, 2011).
As of yet, however, rigorous quantitative evidence regarding the effects of teachers’ non-cognitive characteristics is limited. Therefore, to better understand why teachers succeed, I employ a unique dataset of eight pre-service teacher traits, many of them non-cognitive in nature, measured by Teach For America during its corps member selection process and ask the following questions:
1) Do pre-service measures of teachers’ non-cognitive skills and traits predict value-added effectiveness?
2) Do pre-service measures of teachers’ non-cognitive skills and traits predict evaluation ratings of teacher competencies?
17
While these findings illustrate the effects of non-cognitive traits, the highly-select research sample—TFA corps members—necessitates further work to determine whether and how the effects of non-cognitive skills and traits generalize to a wider population of teachers. Therefore, this research represents a “proof of concept” and impetus for researcher-practitioner partnerships to gather similar non-cognitive data and test effects. The policy implications of such work are clear, as findings could better equip teacher preparation programs and school districts to: (1) recruit and select/hire prospective teachers and (2) actively develop or cultivate non-cognitive skills and traits.
In the following sections I first present research evidence regarding the significant, yet limited effects of teachers’ cognitive ability and then provide background and review evidence regarding non-cognitive skills and traits. Next, I detail the data and sample, particularly the eight traits measured by TFA. Then, I describe the analytical plan for addressing each research question. Finally, I present the results from the analyses of teacher effectiveness and evaluations of teacher competencies and conclude with a discussion of research and policy significance.
BACKGROUND
The Effects of Cognitive Ability on Teacher Effectiveness
18
last several decades, largely in response to greater labor market opportunities for women (Bacolod, 2007; Corcoran, 2007).
19
Overall, the research evidence suggests that recruiting and selecting/hiring prospective teachers with higher levels of cognitive ability may modestly improve the effectiveness of the teacher workforce. The small portion of variance in teacher effectiveness explained by such credentials, however, helps motivate a greater focus on non-cognitive skills and traits.
What are Non-Cognitive Characteristics?
Broadly defined, non-cognitive characteristics are those academically and occupationally relevant skills and traits that, while not specifically intellectual or analytical in nature, influence behavior and facilitate achievement (Rosen, Glennie, Dalton, Leonnon, & Bozick, 2010). Examples of such attributes include perseverance, motivation, and self-control. Importantly, the term non-cognitive should not imply a complete absence of cognitive ability, as cognition is present in almost all aspects of human behavior. Rather, cognition can be conceptualized across a spectrum, with certain skills/abilities more readily identified as cognitive and other traits more readily identified as non-cognitive. Despite this lack of a sharp contrast, cognitive ability can be conceptually and empirically separated from non-cognitive traits (Borghans, Duckworth, Heckman, and ter Weel, 2008).
20
highest level, with each factor summarizing a host of distinct, specific personality characteristics. For instance, within the conscientiousness factor are personality facets such as order, dutifulness, competence, and self-discipline. Issues with the Big Five include: (1) the exclusion of certain traits, especially individual motivation and (2) controversy concerning to which factor certain personality facets belong (Borghans, Duckworth, Heckman, & ter Weel, 2008). While both psychologists and economists study the relationship between non-cognitive characteristics and later outcomes of interest—academic and occupational—studies in economics lack the unifying structure of the Big Five. Instead, economists tend to examine a single or small group of traits, focusing on effects and their implications for policy—for example, Heckman has focused on the Perry Preschool Program in studies assessing the cost-effectiveness of policymakers investing in programs that develop the non-cognitive characteristics of children (Heckman, 2006). Overall, the present study is more aligned with this economics tradition, asking how these eight teacher traits influence teacher quality and what the findings mean for research and policy.
The Effects of Non-Cognitive Skills and Traits
Beyond cognitive ability, researchers in economics and psychology have long been interested in the relationships between outcomes of interest (academic achievement, labor market success) and individuals’ non-cognitive skills and traits. Overall, a rich body of research evidence clearly supports both the significance and malleability of these characteristics. Below, I highlight the results of a few noteworthy studies.
21
but rather, increases significantly with motivation—the introduction of a performance incentive (candy) (Clingman & Fowler, 1976); (2) measures of self-control, indicated by whether a four year-old child is able to delay gratification and not consume a marshmallow, significantly predict higher SAT scores and enrollment at higher ranked colleges (Mischel, Shoda, & Rodriguez, 1989); and (3) measures of grittiness and perseverance explain success in National Spelling Bee competitions (Duckworth, Kirby, Tsukayama, Berstein, & Ericsson, 2011). Non-cognitive characteristics continue to influence outcomes of interest for adults, as research also shows that: (1) non-cognitive measures, not cognitive ability, explain the wage differentials between high school graduates and GED holders (Heckman & Rubinstein, 2001); (2) in the workplace, conscientiousness, one of the Big Five personality traits, consistently predicts job proficiency for five different occupational groups (Barrick & Mount, 1991); and (3) measures of childhood self-control significantly predict physical health, substance dependence, personal finances, and criminal offense outcomes at age 32 (Moffitt et al., 2011). Finally, research evidence indicates that these non-cognitive traits are not fixed, but rather, can respond to intervention as: (1) children coached in self-control strategies were better able to delay gratification in the marshmallow experiment (by 7-18 minutes depending on strategy) (Mischel, Shoda, & Rodriguez, 1989) and (2) high-school students participating in mental contrasting activities—concentrating on both a positive outcome and steps needed to overcome the obstacles in the way—more diligently prepared for the SAT exam (Duckworth, Grant, Loew, Oettingen, & Gollwitzer, 2011).
22
questionnaires or interview protocols, such as the Haberman Star Teacher Pre-Screener or the Teacher Perceiver Interview, to identify prospective teachers’ non-cognitive traits and make hiring decisions. Likewise, many teacher preparation programs measure and cultivate the dispositions of pre-service teachers. A primary reason that districts and teacher education programs engage in such activities is the belief that these traits directly influence the quality of teacher practices, and then indirectly, impact student academic outcomes. For instance: (1) higher levels of perseverance may cause teachers to work harder and try multiple instructional strategies to make an academic concept clear to a struggling student or (2) greater motivational ability may enable teachers to first invest their students in the academic goals of the class and then push students to exert the effort required to reach those goals.
23
While this work represents an important advance, the results should be interpreted cautiously, as the measure of academic gains used did not come from state or district criterion-referenced exams, but rather, was teacher reported. In research focused on New York City TFA corps members, Dobbie finds that a one standard deviation increase in corps members’ leadership and perseverance predict achievement gains in math of 0.054 and 0.040 standard deviations, respectively (Dobbie, 2011). In comparison to Dobbie’s analysis, an advantage of the present study is a more comprehensive examination of teacher quality—both teacher value-added and evaluation ratings—and a more heterogeneous sample of school environments—schools in both urban and rural communities across North Carolina.
Overall, evidence suggests that non-cognitive characteristics may help explain what makes teachers effective, and longer-term, facilitate results-aligned selection/hiring practices for school districts and preparation programs. The present study contributes to this nascent research agenda by examining the effects of non-cognitive skills and traits on two teacher quality outcomes—value-added effectiveness and evaluation ratings of teacher competencies. Below, I provide background information regarding Teach For America and describe the eight pre-teaching measures that are the focus of this work.
DATA AND SAMPLE
Background on Teach For America
24
background in teacher education, TFA provides both an intensive, five-week Summer Institute prior to corps members’ first year teaching and on-going coaching and professional development. Corps members commit to teach in their low-income placement schools for at least two years; evidence from administrative data suggests that a large majority of corps members fulfill this two-year commitment but only a minority continue teaching beyond this point (Henry, Bastian, & Smith, 2012).2 Existing research on TFA corps members’ effects on student achievement gains returns mixed results (Boyd, Grossman, Lankford, Loeb, & Wyckoff, 2006; Darling-Hammond, Holtzman, Gatlin, & Heilig, 2005; Decker, Mayer, & Glazerman, 2006; Henry, Bastian, Fortner, Kershaw, Purtell, Thompson, & Zulli, 2013; Kane, Rockoff, & Staiger, 2008; Raymond, Fletcher, & Luque, 2001; Xu, Hannaway, & Taylor, 2011). Over time, however, the trend in evidence suggests that corps members are effective at promoting student achievement growth, especially in STEM courses (mathematics and science) and at the secondary school level (Boyd, Grossman, Hammerness, Lankford, Loeb, Ronfeldt, & Wyckoff, 2012; Decker, Mayer, & Glazerman, 2006; Henry, Bastian, & Smith, 2012; Henry et al., 2013; Xu, Hannaway, & Taylor, 2011).
Most relevant to the present study is the process by which TFA selects applicants for admission into the program. Essentially, TFA collects data on applicants’ cognitive ability and non-cognitive characteristics throughout its application process—submission of documents, such as a letter of intent, resume, college transcript, and letters of recommendation; a phone interview; and an in-person interview—and based upon internal analyses showing how these traits predict corps member effectiveness, TFA uses
2Evidence from three cohorts of TFA corps members in North Carolina (2004-05, 2005-06, and 2006-07)
25
this applicant information to make data-driven admissions decisions (Ripley, 2010). Below, I detail the measures of cognitive ability and non-cognitive traits measured by TFA.
Teach For America Data
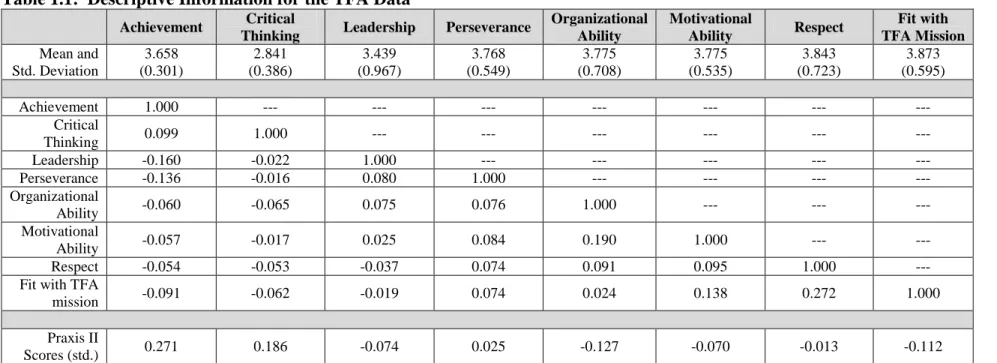
To examine the effects of non-cognitive skills and traits on teachers’ effectiveness and ratings of teacher competencies, I employ a unique dataset of eight pre-teaching measures collected by TFA and used during its corps member selection process. Two of the selection criteria are more cognitive in nature—prior academic achievement and critical thinking skills—while the remaining six criteria are more non-cognitive in nature—leadership, perseverance, organizational ability, motivational ability, respect for low-income students and communities, and fit with TFA’s mission to close the achievement gap (See the top portion of Table 1.1 for the mean and standard deviation of each trait). Below, I briefly detail what each criterion measures and review the theoretical and empirical relation between each trait and teaching quality. Here, it should be noted that due to the level of selectivity of TFA corps members, which I further detail in the research sample section, results for these measures may differ from results for a more generalizable sample of teachers.3 I conclude this section with the results of a factor analysis to determine whether TFA measures eight unique traits or a smaller number of latent constructs.
Prior academic achievement: This criterion captures whether an individual has achieved ambitious, measurable results in prior academic work. Empirical research
3Prior research evinces that, on average, TFA corps members have significantly higher levels of cognitive
26
indicates that teachers with higher levels of cognitive ability—SAT/ACT scores, college GPA, licensure exams (Praxis), or rankings within teacher preparation programs— produce larger student test score gains than lower-scoring peers (Goldhaber, 2007; Greenwald, Hedges, & Laine, 1996; Kukla-Acevedo, 2009; Rockoff, Jacob, Kane, & Stagier, 2011; Rockoff & Speroni, 2011).
Critical thinking skills: This criterion captures an individual’s ability to accurately assess the cause of problems and generate effective solutions. While little quantitative work examines whether this teacher trait predicts student achievement gains, many rubric-based teacher observation and evaluation protocols specifically rate teachers’ competency to reflect on practice—requiring critical thinking skills—and implement changes to address problems or shortcomings (Danielson, 2007; McREL, 2009). As data from these protocols becomes available, researchers may be able to determine whether critical thinking predicts a teacher’s ability to promote student achievement gains.
Leadership: This measure evaluates an individual’s performance and experience
27
Perseverance: This measures the extent to which an individual, when challenged, works purposefully and relentlessly to achieve goals. Education researchers have long identified perseverance—the ability to overcome obstacles—as a key characteristic of successful teachers, particularly in challenging school and classroom environments (Haberman, 1995; Stotko, Ingram, & Beaty-O’Ferrall, 2007). Recent quantitative research focused on student test score outcomes corroborates this finding, showing that teachers with higher levels of grittiness or perseverance produce larger student achievement gains than peers with lower perseverance scores (Dobbie, 2011; Duckworth, Quinn, Seligman, 2009).
Organizational ability: This measures the extent to which an individual plans well—keeping the goal in mind—and effectively manages tasks until completion. Outside education, work in psychology on the Big Five personality traits indicates that conscientiousness—related to organizational ability—consistently predicts job performance (Barrick & Mount, 1991; Judge, Higgins, Thoreson, & Barrick, 1999). Education researchers also connect organization and planning to teaching success, especially given the recent focus on backwards planning—planning with the final objective in mind—as a key component of reaching academic goals (Haberman, 1995; Wiggins & McTighe, 2005).
28
students and helping them believe that they can and want to reach academic goals (Ames, 1990; Cohen, 2011).
Respect for low-income students and communities: This indicates the extent to which an individual holds high academic and behavioral expectations for low-income and low-achieving students and communities. As defined, respect closely relates to locus of control—a teacher’s belief that explanations for student academic success reside in the actions of teachers and students themselves (Dembo & Gibson, 1985; Haberman, 1995; Murray & Staebler, 1974). Considerable research indicates that high expectations can be predictive of student achievement gains (Brophy, 1983; Brophy, 1986; McKown & Weinstein, 2008; Rosenthal & Jacobsen, 1966).
Fit with the TFA mission: This measures an individual’s understanding of and commitment to the TFA mission to close the achievement gap between students in high-poverty versus low-high-poverty communities and schools. While this criterion, in comparison to those above, is more specific to TFA, its underlying construct—a primary focus on significantly improving student achievement—is supported as a characteristic of successful schooling and teaching, particularly in high-need schools (Haberman, 1995; Henry, Thompson, Brown, Cunningham, Kainz, Montrosse, Sgammato, & Pan, 2008; Thompson, Brown, Townsend, Henry, & Fortner, 2011).
29
TFA mission at 0.27, while most of the remaining traits have correlations less than 0.10 in absolute value. This is a preliminary indication that these characteristics may represent unique traits of the prospective teachers.
To test these relationships more rigorously, I performed principal components factor analysis with an oblique rotation procedure. Using Eigenvalues greater than one as a cut-off to identify factors, this approach originally returned a three factor structure, with respect and fit with the TFA mission loading together, organizational ability and motivational ability loading together,4 and achievement, leadership, perseverance, and critical thinking all loading together. While the first two factors strongly loaded in the same direction, the last factor had items strongly loading both positively (achievement and critical thinking) and negatively (leadership and perseverance). Upon considering this factor one clear distinction was that the two items loading positively—achievement and critical thinking—are cognitive in nature, while the two items loading negatively— leadership and perseverance—are non-cognitive in nature. This suggested a way to separate these items into two conceptually distinct factors. To examine this possibility further, I correlated teachers’ Praxis II licensure exam scores, a proxy for cognitive ability, with the eight skills and traits measures. As shown at the bottom of Table 1.1, the Praxis II measure correlated positively with achievement and critical thinking at 0.271 and 0.186, respectively, while it correlated negatively or not at all with leadership and perseverance.5
4
The groupings of these first two factors is not surprising, since respect and fit had the highest pair-wise correlation value of 0.272 and organization ability and motivational ability had the second highest pair-wise correlation value of 0.190.
5
The middle portion of Table 1.1 also shows that prior academic achievement and critical thinking
30
Therefore, with both conceptual and empirical support, I created separate factors for prior achievement and critical thinking and leadership and perseverance. The final factor structure includes one factor that is cognitive in nature—prior academic achievement and critical thinking—and three factors that are non-cognitive in nature— leadership and perseverance, organizational ability and motivational ability, and respect and fit with the TFA mission. Due both to the weak correlations between the eight selection criteria (shown in Table 1.1) and the challenge of drawing research and policy implications from analyses in which factors (combinations of traits) are the focal variables, I table and discuss results for the eight individual traits in the findings section. I include results from models with the four factors in Appendix A.
Research Sample
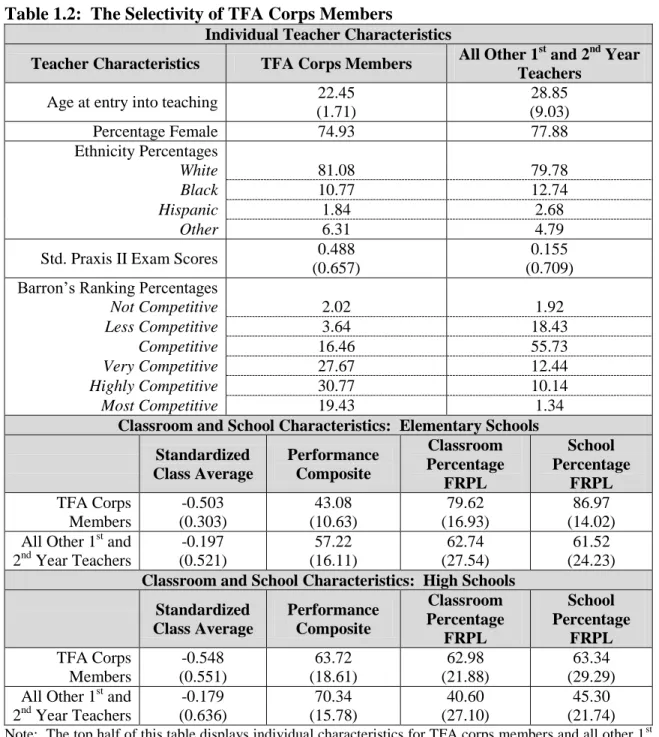
The sample for this research consists of individuals accepted into TFA from 2007-08 through 2010-11 and placed into one of the organization’s two North Carolina regions (Charlotte or Eastern North Carolina). As shown in Table 1.2, this sample is distinguished from other beginning teachers in two ways. First, TFA corps members entered the teaching profession with greater amounts of cognitive ability than other novice peers. For example, TFA corps members score one-third of a standard deviation higher on Praxis II licensure exams, and the percentage of corps members graduating from an undergraduate institution with a very, highly, or most competitive Barron’s ranking is three times greater than other novice teachers. Second, in comparison to other novice tested-grade/subject teachers, TFA corps members work in particularly challenging school and classroom environments. For instance, corps members teaching
31
in a tested-grade in elementary schools work in (1) schools in which students passed only 43 percent of the End-of-Grade exams taken and 87 percent of the student body qualifies for subsidized school lunches and (2) classrooms in which the average prior achievement score is one-half of a standard deviation below the statewide mean and 80 percent of students are eligible for subsidized school lunches. It is these individual and workplace characteristics of corps members that necessitate continued research on a more representative sample of teachers and environments. Below, I describe the specific sample of corps members and study years included in the analyses of teacher effectiveness and evaluation ratings of teacher competencies.
32
(2) second year teachers only, to determine whether the effects of non-cognitive skills and traits develop or dissipate with experience; and (3) first and second year teachers combined, to determine whether non-cognitive skills and traits have an overall effect on student test score gains. Because TFA has a two-year teaching commitment and a majority of corps members in North Carolina public schools do not persist into a third year, I did not perform value-added analyses with more experienced teachers.
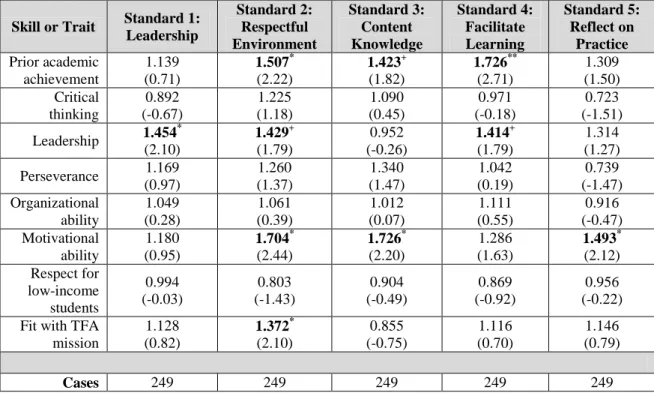
Evaluation Ratings: In the 2010-11 school year North Carolina piloted the McREL teacher evaluation system, a rubric-based observation and evaluation protocol with which principals rate teacher competencies across five standards (detailed in the dependent variables section below). To examine whether non-cognitive skills and traits predict teachers’ evaluation ratings, the research sample for this question consists of all corps members from the full sample—selected into TFA from 2007-08 through 2010-11—rated by their school principal during the 2010-11 school year (251 teachers total; 249 with non-missing covariates for analyses). Due to the small size of this sample, I do not perform any sub-analyses by teacher assignment type (grade level, tested vs. non-tested grade/subject); future analyses, with larger samples, may benefit from separately investigating the effects of non-cognitive skills and traits in these areas.
Dependent Variables and Covariates
33
grade, or from 8th grade for high school students, serve as the measure of prior achievement in these value-added models.6 More on the control variables included to isolate the effects of non-cognitive skills and traits in the teacher effectiveness analyses is included in the covariates section below.
For analyses of teacher competency ratings, the dependent variable comes from the McREL teacher evaluation protocol. The North Carolina State Board of Education approved this new evaluation rubric in October 2008 and schools piloted the evaluation system in the 2010-11 school year. McREL contains five standards on which principals rate teacher competency: (1) teachers demonstrate leadership (2) teachers establish a respectful environment for a diverse group of students (3) teachers know the content they teach (4) teachers facilitate learning for their students and (5) teachers reflect on their practice. Within each of these standards, principals document the presence of key teacher behaviors. For instance, with standard five—teachers reflect on practice—principals focus on whether teachers collect student assessment data to analyze learning, adapt practice based on data, and participate in professional development to address areas for professional growth. To evaluate probationary teachers (the sample of corps members for this work), principals conduct at least three formal observations during the school year. Prior to the first observation principals and teachers have a pre-conference and after each formal observation, principals and teachers have a post-conference. Finally, at the end of the school year, principals and teachers have a summary evaluation conference and for each of the five McREL standards principals officially rate teachers as either: not demonstrated, developing, proficient, accomplished, or distinguished. Given prior
6In elementary grades students’ prior achievement scores are an average of the standardized mathematics
34
research indicating that many teacher evaluation systems do not distinguish effectively between teachers of differing quality, I created outcome measures from the McREL ratings that identify a select sample of teachers (Toch & Rothman, 2008; Weisberg, Sexton, Mulhern, & Keeling, 2009). Specifically, across each of the five evaluation standards ‘proficient’ was the modal scoring category for corps members, with principals rating approximately 70 to 80 percent of corps members at ‘proficient’ or below.7
Therefore, for each of the five evaluation standards I created a dichotomous dependent variable for whether or not the principal rated the teacher ‘above proficient’—either ‘accomplished’ or ‘distinguished.’ This specification allowed me to determine whether: (1) non-cognitive skills and traits predict higher ratings of teacher competency and (2) different non-cognitive skills and traits predict different facets of teachers’ practices (See Appendix Table A1 for descriptive information on corps members’ ratings and the ratings of all other teachers evaluated in the 2010-11 school year).
Covariates: The focal variables for the analyses of teacher effectiveness and teacher competency ratings are the eight individual traits—six of them non-cognitive in nature—measured by TFA during its selection process. All results for models with the four factors are included in Appendix A. For analyses, I standardized each of the traits within cohort-year and entered the eight standardized traits into models, collectively, to identify their independent effects on teacher effectiveness or ratings of teacher competencies. As detailed in Table 1.3, to further isolate the effects of these non-cognitive skills and traits on students’ adjusted average test score growth, I included a rich set of student, classroom, teacher (including experience controls for models with 1st
7There were no TFA corps members in my sample rated as ‘not demonstrated’ for any of the five McREL
35
and 2nd year corps members), and school covariates in value-added models. Finally, in logistic regression analyses predicting whether principals rate teachers above proficient for the five evaluation standards, I controlled for teacher experience—since more experienced teachers are significantly more likely to be highly rated—and the same set of school covariates as listed in Table 1.3.
ANALYSIS PLAN
Teacher Effectiveness
The goal of this analysis was to isolate the effects of teachers’ non-cognitive skills and traits on their students’ adjusted-average test score gains. To do this I utilized the extensive set of administrative data provided by the North Carolina Department of Public Instruction to estimate a value-added model with a rich set of student, classroom, teacher, and school covariates (Table 1.3). Here again, I ran separate models for first year corps members, second year corps members, and a combined model of first and second year corps members to examine how the effects of non-cognitive skills and traits may change early in teachers’ careers. I also used cluster-adjusted standard errors at the teacher level to account for the clustering of students within teachers that, if left unadjusted, could result in reduced standard errors and false positive hypothesis tests.8 The equation used to estimate the effects of the individual teacher traits on corps member effectiveness is as follows:
(1)
where is the test score for student i taught by teacher j in school s at time t;
8I chose to cluster standard errors at the teacher level for two reasons: (1) in these models my sample is
36
represents the prior test score(s) for student i;
represents a vector of the eight standardized individual teacher traits; estimates the average effect of the eight individual teacher traits on students’
adjusted-average test score growth;
represents a set of time-invariant and varying individual student characteristics; represents a set of classroom and teacher characteristics;
represents a set of school characteristics;
and is a disturbance term representing all unexplained variation in student
achievement.
37
primary endogeneity threat—that within the sample of corps members, individual teacher traits have positive associations with assignment to students. As comparable datasets become available for a larger, more generalizable sample of teachers, these fixed effect estimation approaches may be feasible to better isolate the effects of non-cognitive skills and traits.
Finally, to provide a broader context for the non-cognitive skills and traits results, given the select estimation sample of TFA corps members, I include additional value-added models comparing the effectiveness of TFA corps members to all other novice teachers.9 Specifically, I omit the individual teacher trait variables from equation one, insert an indicator variable for TFA, and specify models comparing: (1) first year corps members with all other first year teachers; (2) second year corps members with all other second year teachers; and (3) a combined model with first and second year teachers.10 Results from these models provide a basis of comparison, or means to quantify the size of the non-cognitive skills and traits estimates from equation one and help illustrate that in this select sample even if the average effect of a trait is negative (positive), the overall effectiveness of the corps members may be positive (negative).
Evaluation Ratings of Teacher Competencies
Because (1) many important aspects of teaching quality, such as reflecting on practice, assuming school and departmental leadership roles, or establishing a respectful classroom environment, may not be well-captured by value-added outcomes; (2) only
9
Because these are statewide value-added models I cluster standard errors at the school-by-year level—the highest level of relevant sorting in the analysis.
10Since these models have a much larger sample size I include specification checks with school fixed
38
35% of classroom teachers teach in tested grades/subjects; and (3) improvements in teachers’ instructional quality are generally a pre-cursor to student achievement gains, I also examined whether non-cognitive skills and traits predict evaluation ratings of teacher competencies. For these models I specified a dichotomous dependent variable—rated above proficient—for each of the five evaluation standards and used a logistic regression framework, controlling for teacher experience and a set of school contextual factors, to estimate odds ratios for the relationship between teacher traits and the evaluation score. Here, I included cluster-adjusted standard errors—at the school level—to account for dependence in the data. Overall, the equation to estimate the effects of the individual teacher traits is as follows:
where is a binary outcome equal to 1 for teacher j and
evaluation standard s if the school principal rated the teacher above the ‘proficient’ category;
represents a vector of the eight standardized individual teacher traits;
represents a set of single-year teacher experience indicators, in reference to first year corps members;
and represents a vector of school contextual factors.
39
models, the small sample of teachers with evaluation ratings working in the same schools precludes such an estimation approach. Therefore, while the findings are suggestive of relationships between teacher traits and evaluation ratings, these models cannot rule out rating tendencies of individual principals.
FINDINGS
Teacher Effectiveness
The goal of the first research question was to determine whether individual teacher traits, particularly those that are non-cognitive in nature, predict teacher effectiveness. As detailed in Table 1.2, these estimates of interest make comparisons within a highly-select sample of teachers and school/classroom environments, meaning value-added results may generalize differently to a full sample of instructors. Therefore, this work represents a “proof of concept” and opportunity for hypothesis generation regarding the effects of non-cognitive skills and traits. Below, I present teacher effectiveness findings at the elementary school and high school levels.11
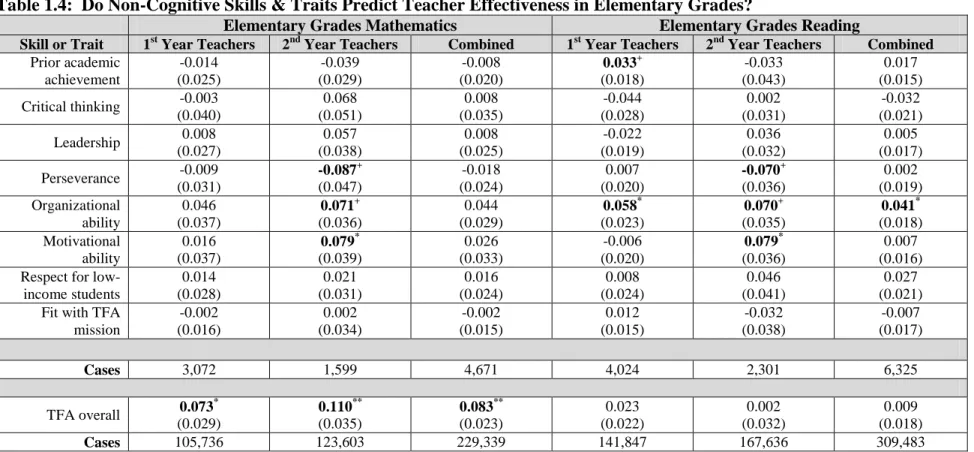
Examining Table 1.4, non-cognitive skills and traits, particularly teachers’ organizational ability, exhibit strong relationships with teacher value-added in elementary grades.12 In mathematics models the effect of organizational ability is significant for second year teachers, while in reading, organizational ability significantly predicts effectiveness across all three models. These results (1) are consistent with prior research findings from psychology which indicate that conscientiousness—related to
11
Value-added results in middle grades mathematics and reading models revealed few significant
relationships between individual teacher traits and teacher effectiveness. Therefore, I focus on elementary and high school findings. Middle grades results are available upon request from the author.
12
40
organizational ability—predicts workplace performance (Barrick & Mount, 1991) and (2) suggest that teachers’ ability to plan and manage tasks is important in elementary grades. Additionally, teachers’ motivational ability, which loaded onto the same factor as organizational ability, significantly predicts second year teacher effectiveness in both mathematics and reading. In contrast to these positive findings, increased levels of teacher perseverance predict a significant decrease in achievement for students taught by second year teachers. This result is particularly unexpected since higher levels of perseverance were anticipated to help teachers succeed, especially in low-performing environments. Finally, there is one significant relationship between a cognitive trait and teacher effectiveness in elementary grades models—prior academic achievement predicts value-added for first year reading teachers.
41
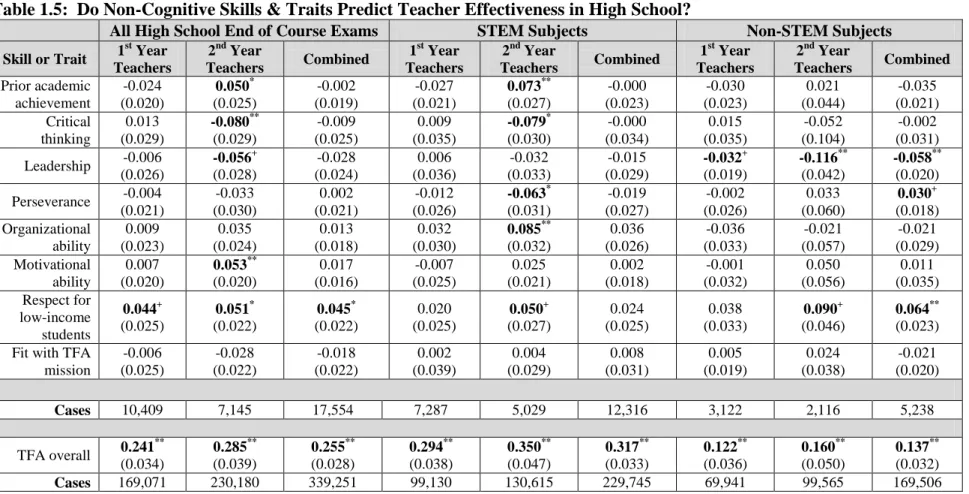
has a negative effect on the achievement of students taught by second year STEM teachers; even more consistently negative is the relationship between teachers’ leadership ability and student achievement gains in non-STEM courses. Finally, value-added estimates indicate mixed results for cognitive traits. Across all high school End-of-Course exams and in models limited to STEM subjects, prior academic achievement positively predicts effectiveness for second year teachers, however, critical thinking negatively predicts effectiveness for the same sample.
As a way to quantify the magnitude of these effects, the bottom portions of Tables 1.4 and 1.5 present results comparing TFA corps members with all other first year, second year, and first and second year teachers. In elementary grades mathematics, for example, second year corps members outperform other second year teachers by 0.110 standard deviations, an effect equivalent to an additional 27 days of student learning in a 180 school-year. By comparison, a one-standard deviation increase in organizational ability for second year corps members produces student test score gains of 0.071 standard deviations—an effect equivalent to two-thirds of the overall TFA mathematics result and nearly 18 days of additional student learning.13 In all high school EOC subjects a one standard deviation increase in teachers’ respect is equivalent to one-fifth of the effect of TFA corps members versus all other novice instructors; in non-STEM subjects, the effect of respect is equivalent to one-half of the difference between corps members and other novice teachers. While these non-cognitive characteristics do not necessarily explain the comparative effectiveness of TFA corps members—the non-cognitive (or cognitive) characteristics explaining variability in TFA effects may be different than those driving
13
42
average differences between corps members and other novice teachers—these results do suggest that non-cognitive characteristics can have sizable and practically significant effects on student achievement.
Overall, these teacher effectiveness models returned mixed results concerning the effects of cognitive traits. In light of the high levels of cognitive ability for TFA corps members shown in Table 1.2—on average, corps members score one-third of a standard deviation higher on standardized licensure exams than other novice instructors—this finding should not suggest that teachers’ cognitive ability is unimportant, but rather, that a more generalizable sample of teachers may be required to detect effects. Corroborating findings on non-cognitive characteristics from other research disciplines, value-added results indicated that teachers’ non-cognitive skills and traits can significantly influence student achievement. More on these value-added findings, including the unexpected perseverance and leadership results and why significant effects were concentrated in teachers’ second year, is included in the discussion section.
Evaluation Ratings of Teacher Competencies
43
teachers’ instructional practices, especially the classroom environment they create, their levels of content knowledge, and their ability to facilitate student learning, are likely a precursor to greater levels of student achievement.
Examining Table 1.6, results for standard one—teachers demonstrate leadership in the school and classroom—indicate that teachers’ measured levels of leadership ability significantly increase the odds of a teacher receiving an evaluation rating above proficient. High ratings for standard two—teachers establish a respectful classroom environment—are predicted by academic achievement, leadership, motivational ability, and fit with the TFA mission. For the most cognitive of standards—teachers know the content they teach—one cognitive trait, prior academic achievement, and one non-cognitive trait, motivational ability, predict the odds of a teacher rating above proficient. Facilitating student learning, or teachers’ ability to present ideas clearly, provide quality feedback to students, and check for understanding, is significantly predicted by academic achievement and leadership ability. Finally, higher levels of measured motivational ability significantly increase teachers’ odds of being rated above proficient for the reflecting on practice standard.