Systems/Circuits
ERK/MAPK Signaling Is Required for Pathway-Specific
Striatal Motor Functions
Scott R. Hutton,
1James M. Otis,
1X
Erin M. Kim,
1Yashna Lamsal,
1Garret D. Stuber,
1,2,3and William D. Snider
11Neuroscience Center,2Department of Psychiatry, and3Department of Cell Biology and Physiology, University of North Carolina at Chapel Hill, Chapel Hill,
North Carolina 27599
The ERK/MAPK intracellular signaling pathway is hypothesized to be a key regulator of striatal activity via modulation of synaptic plasticity and gene transcription. However, prior investigations into striatal ERK/MAPK functions have yielded conflicting results. Further, these studies have not delineated the cell-type-specific roles of ERK/MAPK signaling due to the reliance on globally administered pharmacological ERK/MAPK inhibitors and the use of genetic models that only partially reduce total ERK/MAPK activity. Here, we generated mouse models in which ERK/MAPK signaling was completely abolished in each of the two distinct classes of medium spiny neurons (MSNs). ERK/MAPK deletion in D1R-MSNs (direct pathway) resulted in decreased locomotor behavior, reduced weight gain, and early postnatal lethality. In contrast, loss of ERK/MAPK signaling in D2R-MSNs (indirect pathway) resulted in a profound hyperlo-comotor phenotype. ERK/MAPK-deficient D2R-MSNs exhibited a significant reduction in dendritic spine density, markedly suppressed electrical excitability, and suppression of activity-associated gene expression even after pharmacological stimulation. Our results dem-onstrate the importance of ERK/MAPK signaling in governing the motor functions of the striatal direct and indirect pathways. Our data further show a critical role for ERK in maintaining the excitability and plasticity of D2R-MSNs.
Key words: activity-induced gene expression; basal ganglia; dendritic spine; hyperlocomotion; MAP kinase; medium spiny neuron
Introduction
The basal ganglia govern a vast array of psychomotor behaviors (Nelson and Kreitzer, 2014;Graybiel and Grafton, 2015). Senso-rimotor information is integrated into the basal ganglia via the striatum, where glutamatergic and dopaminergic inputs con-verge onto two distinct classes of medium spiny neurons (MSNs) (Gerfen et al., 1990;Kawaguchi et al., 1990;Gong et al., 2007;
Cerovic et al., 2013). Direct-pathway MSNs (D1R-MSNs) ex-press the dopamine 1 receptor (D1) and largely project to the substantia nigra reticulata (SNr) and globus pallidus internae (GPi). Indirect-pathway MSNs (D2R-MSNs) express dopamine 2 (D2) and adenosine A2a (A2a) receptors and predominantly target the globus pallidus externae (GPe). Experimental evidence suggests that D1R-MSN and D2R-MSN activities have opposing actions. In the motor system, stimulation of the direct pathway elicits activation of motor behaviors, whereas stimulation of the indirect pathway inhibits motor activity (Kravitz et al., 2010; Far-rell et al., 2013). Silencing each pathway has the converse effects (Durieux et al., 2009;Hikida et al., 2010).
The convergence of glutamatergic and dopaminergic signaling onto MSNs leads to long-term alterations in neuronal excitability, changes in activity-induced gene expression and modulation of dendritic spine density (Cerovic et al., 2013;Nelson and Kreitzer, 2014). A major signaling pathway implicated in mediating these long-lasting changes is ERK/MAPK (ERK) (Thomas and Huganir, 2004; Pascoli et al., 2014). Glutamatergic stimulation leads to
Received Feb. 20, 2017; revised May 29, 2017; accepted July 1, 2017.
Author contributions: S.R.H., J.M.O., G.D.S., and W.D.S. designed research; S.R.H., J.M.O., E.M.K., and Y.L. per-formed research; S.R.H., J.M.O., E.M.K., and Y.L. analyzed data; S.R.H., J.M.O., G.D.S., and W.D.S. wrote the paper.
This work was supported by the National Institutes of Health (NIH Grants NS031768 to W.D.S., Grant R01-DA032750 to G.D.S., and Grant F32-DA041184 to J.M.O.). We thank the UNC Confocal and Multiphoton Imaging Core (supported by the NIH National Institute of Neurological Disorders and Stroke Center Grant P30 NS045892), the UNC Functional Genomics Core, the UNC Viral Vector Core, and Yaohong Wu for technical assistance.
The authors declare no competing financial interests.
Correspondence should be addressed to William D. Snider, Neuroscience Center, 115 Mason Farm Rd., NRB Rm 8109D, CB #7250, University of North Carolina, Chapel Hill, NC 27599. E-mail:[email protected].
DOI:10.1523/JNEUROSCI.0473-17.2017
Copyright © 2017 the authors 0270-6474/17/378102-14$15.00/0
Significance Statement
ERK activation through a NMDAR-mediated calcium-dependent mechanism (Krapivinsky et al., 2003;Mao et al., 2004; Valjent et al., 2005), whereas dopamine differentially regulates ERK activity based on the dopamine receptor subtypes expressed by the neuron (Calabresi et al., 2014). Therefore, ERK is hypoth-esized to initiate appropriate cellular responses to patterned ac-tivity from different classes of presynaptic input (Valjent et al., 2005;Girault et al., 2007).
Prior work has implicated ERK activity in striatally mediated locomotor and adaptive behaviors, but these studies have pro-duced conflicting results (Girault et al., 2007;Cerovic et al., 2013; Calabresi et al., 2014). Pharmacological inhibition of ERK signal-ing prevented consolidation of motor skill learnsignal-ing, instrumental learning, and habit formation (Bureau et al., 2010;Shiflett et al., 2010;Shiflett and Balleine, 2011). In contrast, loss of ERK1 in germline knock-out mice showed surprising effects, including baseline hyperactivity, increased synaptic plasticity, enhanced learning, and enhanced locomotor response to cocaine (Selcher et al., 2001;Mazzucchelli et al., 2002;Ferguson et al., 2006;Engel et al., 2009). This disparity has been attributed to increased ERK2 function in ERK1-deleted animals, emphasizing the need to de-lete both ERK1 and ERK2 in genetic studies (Mazzucchelli et al., 2002;Ferguson et al., 2006). Moreover, prior genetic and phar-macological studies have failed to target ERK inhibition to spe-cific striatal cell types, further confounding interpretations of ERK function. Therefore, despite the evidence supporting the importance of ERK signaling to striatal functions and adapta-tions, pathway-specific functions of ERK signaling have not been identified (Fasano and Brambilla, 2011).
Here, we have delineated cell-type-specific functions of ERK signaling by conditionally deleting ERK2 on an ERK1-null back-ground using D1-Cre and D2-Cre lines (Gong et al., 2007). Loss of ERK in D1R-MSNs led to decreased locomotor activity, failure to thrive, and early postnatal lethality, precluding further analysis of the mice. Deletion of ERK in D2R-MSNs resulted in a hyper-locomotor phenotype that is comparable to D2-specific cell ab-lation studies reported previously (Durieux et al., 2009). We report, for the first time, physiological analysis of D2R-MSNs in the setting of complete ERK deletion. ERK-deleted D2R-MSNs are remarkably hypoexcitable, showing reduced frequencies of postsynaptic currents and major reductions in intrinsic excitability. Finally, expression of immediate early and plasticity-associated genes are markedly reduced in ERK-deleted D2R-MSNs both at baseline and in response to pharmacological stimulation. We conclude that ERK signaling is required for pathway-specific stri-atal motor functions. Furthermore, ERK signaling is essential to the excitability and activity-regulated gene expression of D2R-MSNs.
Materials and Methods
Animals.Animals were used and maintained in accordance with the
National Institutes of Health’sGuide for the Care and Use of Laboratory Animalsand all protocols were approved by the Institutional Animal Care and Use Committee at the University of North Carolina-Chapel Hill (UNC). Drd2-EGFP, Drd1a(EY262)-Cre, Drd2(EY43)-Cre, and
Adora2a-Cre mice were purchased from the Mutant Mouse Regional
Resource Center (MMRRC) (Gong et al., 2007).Erk1⫺/⫺(Mapk3⫺/⫺) andErk2loxP/loxP(Mapk1loxP/loxP) mice (Nekrasova et al., 2005;Samuels
et al., 2008) were kindly provided by G. Landreth (Case Western Reserve
University, Cleveland, OH).Drd1atdTomato(Ade et al., 2011), Ai3-EYFP, and Ai9-tdTomato (Madisen et al., 2010) reporter lines were purchased from The Jackson Laboratory. All animals were maintained on a C57BL/6J background. For birth-dating, the day of birth was recorded as postnatal day 0 (P0). All experiments were replicated independently with
a minimum of three animals per condition. Power analysis was con-ducted on preliminary samples to determine sample size using StatMate software (GraphPad). We chose a significance␣value of 0.05 and a power value of 0.8. Mixed-sex samples were used for analyses unless otherwise noted. For all experiments,Erk1⫺/⫺;Erk2loxP/loxPlittermate controls were used for comparison unless otherwise specified. For geno-typing, DNA was extracted from tail or toe samples and PCR analysis was conducted using standard techniques. Genotyping primer sequences were as follows: D1-Cre: Fwd-5⬘-GCTATGGAGATGCTCCTGATGG AA-3⬘, Rev-5⬘-CGGCAAACGGACAGAAGCATT-3⬘;D2-Cre: Fwd-5⬘
-GTGCGTCAGCATTTGGAGCAA-3⬘, Rev-5⬘-CGGCAAACGGACAGA
AGCATT-3⬘; Adora2a-Cre: Fwd-5⬘-CGTGAGAAAGCCTTTGGGAA GCT-3⬘, Rev-5⬘-CGGCAAACGGACAGAAGCATT-3⬘;D2-GFP:
Fwd-5⬘-GAGGAAGCATGCCTTGAAAA-3⬘, Rev-5⬘-TGGTGCAGATGAAC
TTCAGG-3⬘; ERK1 KO: Fwd-5⬘-AAGCAAGGCTAAGCCGTACC-3⬘, Rev (WT)-5⬘-AAGGTTAACATCCGGTCCAGCA-3⬘, Rev(Mut)-5⬘-CA TGCTCCAGACTGCCTTGG-3⬘;ERK2 Flox: Fwd-5⬘-AGCCAACAATC CCAAACCTG-3⬘, Rev-5⬘-GGCTGCAACCATCTCACAAT-3⬘; Ai3:
Fwd(WT)-5⬘-AAGGGAGCTGCAGTGGAGTA-3⬘, Rev(WT)-5⬘-CCG
AAAATCTGTGGGAAGTC-3⬘, Fwd (Mut)-5⬘-ACATGGTCCTGCTG
GAGTTC-3⬘, Rev(Mut)-5⬘-GGCATTAAAGCAGCGTATCC-3⬘; Ai9:
Fwd(WT)-5⬘-AAGGGAGCTGCAGTGGAGTA-3; Rev(WT)-5⬘-CCGA
AAATCTGTGGGAAGTC-3⬘, Fwd (Mut)-5⬘-GGCATTAAAGCAGCG
TATCC-3⬘, Rev(Mut)-5⬘-CTGTTCCTGTACGGCATGG; D1tdTomato:
Fwd-5⬘-CTTCTGAGGCGGAAAGAACC-3⬘, Rev-5⬘-TTTCTGATTGA
GAGCATTCG.
Acute tissue extraction.Mice were killed via cervical dislocation and the brains immediately extracted and rinsed in ice-cold 1⫻PBS. The brains were then placed in a chilled acrylic brain matrix (Ted Pella) and 1-mm-thick coronal slices were made using a razor blade. Slices were then placed in chilled 1⫻PBS and, using a 1 mm micropunch (Ted Pella), 2–3 tissue punches were extracted from dorsal striatum from each hemisphere for analysis using gene expression profiling (see below).
Gene expression profiling.Striatal punches were extracted from three littermate control and three mutant P17 male mice generated from three independent litters. Total RNA was extracted using TRIzol reagent (Invitrogen), followed by mRNA extraction using an RNeasy Mini Kit (Qiagen) according to the manufacturer’s instructions. Quantity of ex-tracted mRNA was analyzed using a Nanodrop (ND1000) spectropho-tometer and the quality was verified with an Agilent Technologies 2100 Bioanalyzer. The RNA was then amplified, labeled, and hybridized to an Affymetrix Clariom D Array in the UNC Functional Genomics Core using the manufacturer’s protocol. Gene-level differential expression analysis was conducted using Transcriptome Analysis Console version 3.0 (Affymetrix) with the default algorithm parameters for the Clariom D Array. Log2sample values were used to determine differential gene ex-pression andp-values. Genes were considered upregulated or downregu-lated if there was a⫾1.5-fold difference in expression levels compared with control samples. Changes were considered significant atpⱕ0.05. The data discussed herein have been deposited in NCBI’s Gene Expres-sion Omnibus (Edgar et al., 2002) and are accessible through GEO Series accession number GSE93844 (https://www.ncbi.nlm.nih.gov/geo/query/
acc.cgi?acc⫽GSE93844).
Tissue fixation and preparation.Mice were anesthetized with a 2.5% Avertin solution (Sigma-Aldrich) and then transcardially perfused with 4% paraformaldehyde/PBS (Sigma-Aldrich). Brains were then postfixed in 4% paraformaldehyde solution at 4°C overnight. Tissue was mounted in 4% low-melt agarose and 80m coronal or sagittal sections were generated using a vibratome (Leica).
Antibodies.Primary antibodies used for Western blot were rabbit phospho-MAPK1/3(ERK1/2) (Thr202/Tyr204) and rabbit MAPK1/ 3(ERK1/2) (Cell Signaling Technology). Primary antibodies used for im-munohistochemistry were as follows: rabbit Erk2 and rat Ctip2 (1:500, Abcam), rabbit c-FOS (1:500; Cell Signaling Technology), chicken GFP (1:1000; Aves Laboratories), rabbit RFP and mouse RFP (1:250; Rock-land), and rabbit ARC (1:1000; Synaptic Systems). Secondary antibodies used: goat/chicken/donkey Alexa Fluor 488, goat/donkey Alexa Fluor 568, and goat/donkey Alexa Fluor 647 (1:1000; Life Technologies).
Viral injections.P1 mice were individually cryo-anesthetized on wet ice for 3 min and then immediately injected with 200 nl of virus solution using a 5l Hamilton syringe fitted with a 32 gauge beveled needle mounted to a stereotaxic arm. AAV8-CAG-GFP (UNC Vector Core, Chapel Hill, NC) virus was prepared by diluting concentrated virus with PBS⫹5% sorbitol⫹0.1% Fast Green (for visualization) for a final concentration of 5⫻108molecules/l. Unilateral injections were made into the striatum. After the injection, pups were placed on a heating pad until they recovered. Upon recovering, all pups were then placed back into their home cage.
Locomotor activity.Naive animals were evaluated for spontaneous lo-comotor activity using a 45⫻45 cm Plexiglass arena and Ethovision XT 11.5 (Noldus) video-tracking software. Distance traveled was measured using Lowess smoothing to minimize tracking fluctuations. All animals were acclimated to the testing room 3 h before locomotor testing.
Catalepsy.Two-month-old mice were injected with 1 mg/kg haloper-idol (0.1 mg/ml) 1 h before evaluation of cataleptic behavior. To test catalepsy, both front paws were placed on a horizontal bar mounted 4 cm above the testing chamber floor while both hindpaws remained on the floor. The time taken to remove both forepaws from the bar or move both paws sideways on the bar was recorded. Maximum trial times were 300 s. Mice were tested in three consecutive trials unless the maximum cutoff time was achieved in one of the trials. Catalepsy was determined by taking the average of the three trials or 300 s if the maximum was achieved. Haloperidol bromide (Sigma-Aldrich) stock solution was dis-solved in (25l of glacial acetic acid diluted to 1 mg/ml with 0.9% saline and buffered to pH 6.5 with 1NNaOH). Stock solution was then diluted with 0.9% saline to generate a 0.1 mg/ml working solution. Injection vehicle solution was generated in the same manner without the addition of haloperidol.
Imaging.All images were acquired using a model 780 confocal micro-scope with ZEN 2011 software (both Carl Zeiss). For comparative stud-ies, image acquisition settings were maintained across all samples. For dendritic spine analysis, five D1R-MSNs and five D2R-MSNs were ana-lyzed per animal from the dorsal striatum. Labeled MSNs were selected randomly for analysis from a group that showed no dendritic overlap with neighboring GFP-labeled cells. Three secondary or tertiary den-drites were then analyzed per cell. For best resolution, only denden-drites that were located between 5 and 20m from the slice surface and that dis-played minimal variation in the horizontal plane were analyzed. All im-aged dendrites could be traced continuously back to their respective soma. 3D 42.5⫻42.5mz-stack images of dendritic segments were acquired using 0.388m optical sections. After acquisition, images were coded and analysis was conducted by a blinded observer. 3D reconstruc-tion and spine quantificareconstruc-tion were conducted using Neurolucida 10 software (MBF Bioscience). Dendritic spines were traced manually throughout each 3D reconstruction image and quantified automatically by the software program.
Cell quantification.Cell quantification was performed on 637⫻637
m RGB images acquired from anatomically matched slices of dorsal striatum. All image analysis was conducted by an observer blinded to sample genotypes using Photoshop CS3 software (Adobe). The D1tdTomato fluores-cent reporter was used to identify D1R-MSNs (red fluorescence) and D2R-MSNs (no fluorescence). For each image, all CTIP2-positive MSNs were counted. For the assessment of c-FOS- and ARC-expressing cells, individual MSNs were first selected based upon Ctip2 (blue channel) labeling using the “quick selection tool.” Next, each selected cell was then categorized as a D1R-MSN or D2R-MSN based upon whether it ex-pressed D1tdTomato fluorescence (red channel). Last, c-FOS or ARC (green channel) was selected and the integrated pixel intensity and area
for each cell was recorded automatically by the software. The average pixel density (pixel intensity/area) was calculated for each selected cell. A cell was considered positive for c-FOS or ARC expression if the average pixel density was⬎2-fold higher than background. The assessment of ERK2 expression was performed similarly except that ERK2 expression was determined manually by the observer. For analysis of D2GFP-A2aCre;Ai9 experiments, D2GFP, D2GFP-A2aCre;Ai9, and colabeled cells were counted manually using the count tool in Photoshop.
Patch-clamp electrophysiology.For all electrophysiology analyses, the experimenter was blinded to sample genotypes. Mice were anesthetized with pentobarbital and transcardial perfusions were performed using an ice-cold sucrose cutting solution (0 –1°C) containing the following (in mM): 225 sucrose, 119 NaCl, 1.0 NaH2PO4, 4.9 MgCl2, 0.1 CaCl2, 26.2 NaHCO3, and 1.25 glucose, 305–308 mOsm. Brains were then removed and submerged in the cutting solution and 300-m-thick coronal sec-tions were made using a vibrating blade (Leica, VT 1200). Slices were then placed in warm aCSF (32°C) containing the following (in mM): 119 NaCl, 2.5 KCl, 1.0 NaH2PO4, 1.3 MgCl, 2.5 CaCl2, 26.2 NaHCO3, and 15 glucose, 305 mOsm. After at least 1 h of recovery, slices were perfused with warm aCSF (32°C) containing no pharmacology (excitability re-cordings) or with 0.5Mtetrodotoxin [miniature EPSC (mEPSC) and miniature IPSC (mIPSC) recordings; Sigma-Aldrich]. Neurons were vi-sualized using differential interference contrast through an upright 40⫻ water-immersion objective mounted to an upright microscope (Olym-pus BX51WI). Fluorescent imaging using a mercury lamp (Olym(Olym-pus U-RFL-T) was used to identify tdTomato-positive (D1) versus tdTomato -negative (D2) MSNs.
Synaptic connectivity was measured through mEPSC and mIPSC recordings obtained using glass electrodes (3–5⌴⍀) back-filled with cesium methylsulfonate internal solution containing the following (in mM): 117 Cs methanesulfonic acid, 20 HEPES, 2.8 NaCl, 5 TEA, 2 ATP, and 0.2 GTP, pH 7.35, mOsm 280. mEPSCs were obtained by holding neurons at⫺70 mV for 5 min and mIPSCs were obtained by holding neurons at⫹10 mV for 5 min. Data acquisition for mEPSCs and mIPSCs occurred at 1 kHz sampling rate through a MultiClamp 700B amplifier connected to a Digidata 1440A digitizer (Molecular Devices).
Excitability recordings were obtained using glass electrodes (3–5⌴⍀) back-filled with a potassium gluconate internal solution containing the following (in mM): 130 K gluconate, 10 KCl, 10 HEPES, 10 EGTA, 2 MgCl2, 2 ATP, and 0.2 GTP, 280 mOsm. Intrinsic neuronal excitability was evalu-ated by depolarizing each neuron using 800 ms current steps (0 to 500 pA; 50 pA steps). Rheobase was also evaluated by depolarizing each neuron in 50 ms current steps (0 to 1000 pA; 10 pA steps). Data acquisition for excitability recordings occurred at a 10 kHz sampling rate. Excitability data were ana-lyzed using a threshold analysis (Clampfit 10.3).
Statistical analysis.All data were analyzed using Prism version 6.0 soft-ware (GraphPad). Data are presented as mean⫾SEM unless otherwise noted. For direct comparisons, statistical significance was determined using a two-tailedttest with Welch’s correction. For studies requiring ANOVA, methods used forpost hocanalysis to determine statistical sig-nificance are mentioned in the text and figure legends.
Results
Cell-type-specific deletion of ERK in D1R- and D2R-MSNs
ERK signaling has been proposed to be a key integrator of dopa-minergic and glutamatergic input onto MSNs and a critical mod-ulator of neuronal plasticity (Girault et al., 2007; Fasano and Brambilla, 2011). To understand the functional role of ERK sig-naling in the striatum, we generated mutant mice in whichErk1
andErk2genes were deleted in specific populations of MSNs. Both genes require deletion due to functional redundancy between ERK1 and ERK2 (Selcher et al., 2001;Mazzucchelli et al., 2002). To accomplish cell-type-specific deletion, we crossed Erk1⫺/⫺
Erk2loxP/loxPmice (Nekrasova et al., 2005;Samuels et al., 2008) with the well documented D1-Cre and D2-Cre lines (Gong et al., 2007). The resulting Erk1⫺/⫺Erk2loxP/loxP:D1Cre (ERK:D1) and
D2R-MSNs, respectively. Littermate Erk1⫺/⫺Erk2loxP/loxP mice were also germline null for ERK1 and were used as controls for all stud-ies unless otherwise noted. Because both D1 and D2 receptors are expressed in other brain regions (Gong et al., 2007), we cannot fully exclude the possibility of nonstriatal contributions to the strong phe-notypes that we describe below.
To verify that ERK2 was specifically ablated in D1R-MSNs and D2R-MSNs of ERK:D1 and ERK:D2 animals, respectively, we analyzed the cell-type-specific expression of ERK2 at P21 us-ing immunohistochemistry. To distus-inguish between MSN
sub-types, both the ERK:D1 and ERK:D2 lines were crossed with the D1tdTomatoreporter mouse line (Ade et al., 2011). Expression of tdTomato red fluorescent protein ex-clusively in D1R-MSNs allowed us to distinguish between D1R-MSNs (red fluo-rescence) and D2R-MSNs (no fluores-cence). In ERK:D1 animals, only 3% of D1R-MSNs expressed ERK2 compared with control littermates (Welch-corrected
t(2.16)⫽84.77,p⫽0.0001;Fig. 1A). We observed a similar reduction in ERK2 ex-pression in D2R-MSNs of ERK:D2 mu-tant mice (Welch-corrected t(2.95) ⫽ 40.64,p⫽0.0001;Fig. 1B). Our findings demonstrate that ERK activity is ablated in distinct MSN populations of ERK:D1 and ERK:D2 mutant mice.
ERK signaling has been implicated pre-viously in cellular growth and maintenance (Cargnello and Roux, 2011). To assess the integrity of the ERK-deficient MSN axonal projections, we crossed ERK:D1 and ERK:D2 mice with the Ai3 reporter line, which conditionally expresses enhanced yellow fluorescent protein in a Cre-dependent manner (Madisen et al., 2010). D1R-MSN projections to the GPi and SNr appeared intact in ERK:D1 mutant mice compared with littermate controls (Fig. 1C,D, P21). Similarly, D2R-MSN projec-tions to the GPe also appeared unaffected in ERK:D2 animals (Fig. 1E,F, P21). More-over, we assessed MSN subtype survival at P21 by comparing the percentages of D1R-MSN and D2R-D1R-MSN cells in both ERK:D1 and ERK:D2 mice relative to littermate controls. For ERK:D1 mice (n⫽3 mice/ genotypes), we did not observe a signifi-cant difference in the percentage of D1R-MSNs (53.1%⫾1.38 for control vs 52.3⫾ 0.94% for ERK:D1, Welch-corrected
t(3.52) ⫽ 0.51, p ⫽ 0.64) or D2R-MSNs (47.4⫾0.69% for control vs 47.3⫾0.57% for ERK:D1, Welch-correctedt(3.83)⫽0.13,
p ⫽ 0.90) compared with control litter-mates. Similarly, we did not observe any significant changes in the percentage of D1R-MSNs (51.6⫾0.73% for control vs 50.6⫾2.53% for ERK:D2, Welch-corrected
t(2.34) ⫽ 0.37, p ⫽ 0.75) or D2R-MSNs (48.5⫾0.73% for control vs 49.4⫾2.53% for ERK:D2, Welch-correctedt(2.33)⫽0.37,
p⫽0.74) in ERK:D2 mice relative to litter-mate controls (n⫽3 mice/genotype). These results suggest that ERK activity is not necessary for the targeting or maintenance of D1R-MSN or D2R-D1R-MSN projections. However, we cannot exclude mod-est effects on axon branching or synaptogenesis.
Both ERK:D1 and ERK:D2 mice were generated in the appro-priate Mendelian ratios. However, we observed a significant re-duction in weight gain between P7 and P19 in ERK:D1 mutants compared with littermate controls (repeated-measures ANOVA; main genotype effect,F(1,5)⫽91.90,p⫽0.0002; main time effect
F
Control
ERK:D1
Control
ERK:D2
D1tdTomato/ERK2 D1tdTomato/ERK2
C
D
E
A
B
G
H
GPe Control (D2)
GPe ERK:D2
Cont rol
ERK :D1 0
20 40 60 80 100
% o
f D
1
R
-M
S
N
s
ex
p
re
s
s
ing
E
R
K
2
*
Cont rol
ER K:D
2 0
20 40 60 80 100
%o
f D
2
R
-M
S
N
s
e
x
pre
s
s
ing
E
R
K
2
*
7 9 11 13 15 17 19
0 2 4 6 8 10 12
Age (Days)
Bo
d
y
w
e
ig
ht
(
g
)
Control ERK::D1
*
0 20 40 60 80 100
0 20 40 60 80 100
Days elapsed
Pe
rc
e
n
t s
u
rv
iv
a
l
Control ERK:D1 ERK:D2
*
GPi SNr
Control (D1)
GPi SNr
ERK:D1
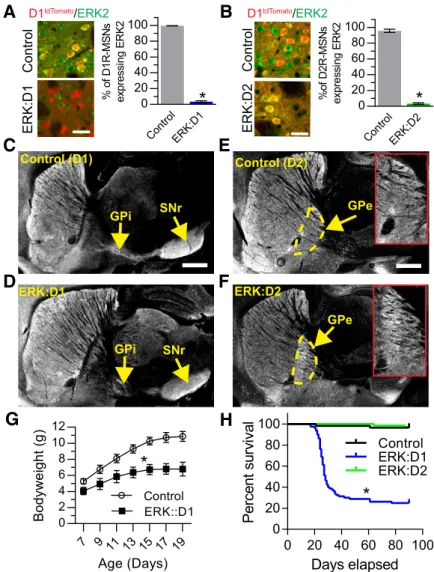
Figure 1. ERK-deficient MSNs show proper targeting of axonal projections.A, Quantification of the relative percentage of ERK2-positive D1R-MSNs in control and ERK:D1 mutant mice at P21. ERK2 (green) is coexpressed with D1tdTomato(red) in D1R-MSNs of littermate control mice, but is lost in virtually all D1R-D1R-MSNs of ERK:D1 mutant mice (*p⬍0.001;n⫽3 mice/genotype, 150 cells/mouse). Scale bar, 50m.B, Quantification of the percentage of ERK2-postive D2R-MSNs in littermate control and ERK:D2 mutant mice at P21. ERK2 (green) is expressed in in both D1tdTomato-positive D1R-MSNs and D1tdTomato-negative D2R-MSNs of littermate control mice, but is lost in virtually all D1tdTomato-negative D2R-MSNs of ERK:D2 mutant mice (*p⬍0.001;n⫽
3 mice/genotype, 150 cells/mouse). Scale bar, 50m.C,D, Control (ERK⫺/⫺;ERK2w/w:D1Cre) and ERK:D1 mutant mice were backcrossed with Cre-dependent fluorescent reporter Ai3 mice to label all D1R-MSN projections with enhanced yellow fluorescent protein (eYFP). Normal D1R axon targeting to the GPi and SNr is observed in control (C) and ERK:D1 mutant (D) mice. Scale bar, 1 mm.E,F, Control (ERK⫺/⫺;ERK2w/w:D2Cre) and ERK:D2 mutant mice were backcrossed with Ai3 mice to label D2R-MSN axonal projections with eYFP. Normal D2R axon targeting to the GPe is observed in control (E) and ERK:D2 mutant (F) mice. Insets show magnified images of GPe. Scale bar, 1 mm.G, Quantification of weight gain during the second and third postnatal weeks in ERK:D1 mutant mice compared with ERK⫺/⫺;ERK2Fl/Fllittermate controls. ERK:D1 animals show significant deficits in weight gain beginning at P7 and continuing through P19 (n⫽6 animals/genotype, main effect for genotypeF(1,10)⫽84.96, *p⬍0.0001,
Bonferronipost hoccomparison).H, Kaplan–Meier survival curve of ERK:D1 (blue line,n⫽80 mice) and ERK:D2 (green line;n⫽
F(6,30)⫽494.1,p⫽0.0001, time⫻genotype interaction:F(6,30)⫽ 59.92,p⫽0.0001;Fig. 1G) and a significant decrease in survival beginning at 3 weeks of age (median age of death⫽28 d; Gehan-Breslow-Wilcoxon survival test:(1)2 ⫽60.72,p⫽0.0001;Fig. 1H). In contrast, ERK:D2 mice survived normally compared with littermate controls (Gehan–Breslow–Wilcoxon survival test:(1)2 ⫽0.065,p⫽0.799;Fig. 1H).
ERK signaling is required for pathway-specific regulation of locomotor behavior
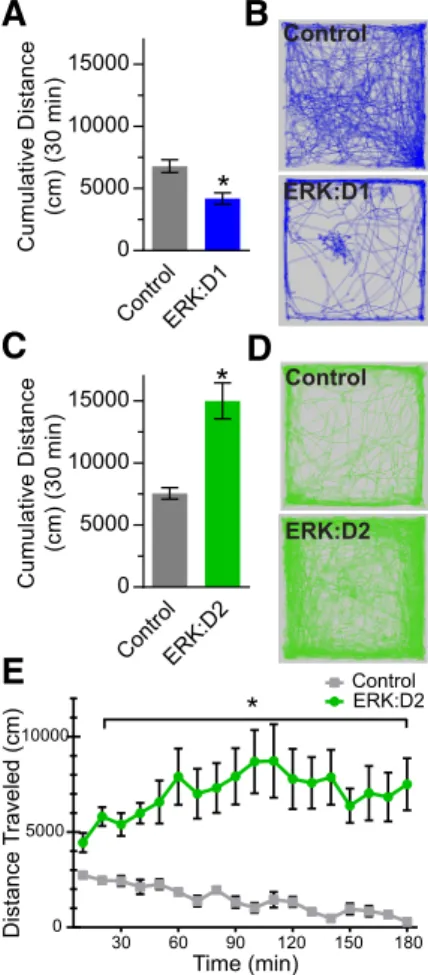
Previous studies using genetic cell ablation or optogenetic ma-nipulation have shown that D1R-MSN loss or inhibition dramat-ically reduces locomotor activity (Drago et al., 1998;Kravitz et al., 2010;Durieux et al., 2012), whereas ablation or optogenetic si-lencing of D2R-MSNs increases locomotion (Durieux et al., 2009;Kravitz et al., 2010). To determine whether ERK signaling is essential for pathway-specific locomotor function, we assessed basal locomotor activity in naive ERK:D1 and ERK:D2 mice using a 30 min open-field assay. Analysis of ERK:D1 mice at P21 showed a significant decrease in activity compared with littermate controls, demonstrating that ERK activity in D1R-MSNs is necessary for fa-cilitating locomotor behavior (Welch-correctedt(10.98)⫽3.80,p⫽ 0.003;Fig. 2A,B). However, the rapid decline in health of ERK:D1 mutant mice precluded us from pursuing more detailed analyses of this line because we could not properly control for potential second-ary health effects on D1R-MSN functions.
In contrast, ERK:D2 mutant mice showed a significant in-crease in total distance traveled compared with littermate con-trols (Welch-correctedt(10.8)⫽4.93,p⫽0.0005;Fig. 2C,D). To assess potential sexual dimorphism, we also compared open-field activity between male and female ERK:D2 mice, but found no significant differences (14.2 m⫾2.08 male vs 15.5 m⫾2.09 female;post hocWelch-correctedt(7.5)⫽0.42,p⫽0.68,n⫽4 male mice, 6 female mice). To investigate whether ERK:D2 mice eventually acclimate to the testing arena and reduce their basal activity, we also analyzed the mice in a 3 h open-field assay. Lo-comotor activity in control animals decreased steadily through-out the trial. In contrast, ERK:D2 mutant mice maintained a high level of activity throughout the 3 h testing period (repeated-measures ANOVA: main genotype effect:F(1,9) ⫽31.70, p⫽ 0.0003; time⫻genotype interaction:F(17,153)⫽4.73,p⫽0.0001; Fig. 2E). These results demonstrate that ERK activity is required for the proper function of D2R-MSNs in suppressing locomotor behavior.
Reduced dendritic spine formation and activity-induced gene expression in ERK-deficient D2R-MSNs
Pharmacological blockade of ERK activity prevents stimulation-induced dendritic spine formation inex vivoslice systems ( Gol-din and Segal, 2003;Alonso et al., 2004). However, it is unclear whether ERK is required for spinogenesis during normal striatal development. To determine whether dendritic spines are altered in ERK-deficient D2R-MSNs, we labeled sparse populations of MSNs by injecting an AAV8-CAG-GFP virus unilaterally into the striatum of ERK:D2 and littermate control P1 neonatal animals. We then killed the mice at P21, a period during which active synaptogenesis is occurring in the striatum (Tepper et al., 1998; Goldin and Segal, 2003;Alonso et al., 2004;Kozorovitskiy et al., 2012). AAV8-CAG-GFP brightly labels the entire MSN, includ-ing dendritic spines, which were then imaged usinclud-ing 3D confocal microscopy. To distinguish between D1R-MSN and D2R-MSNs, we backcrossed the ERK:D2 line with the D1tdTomato (D1tdT)
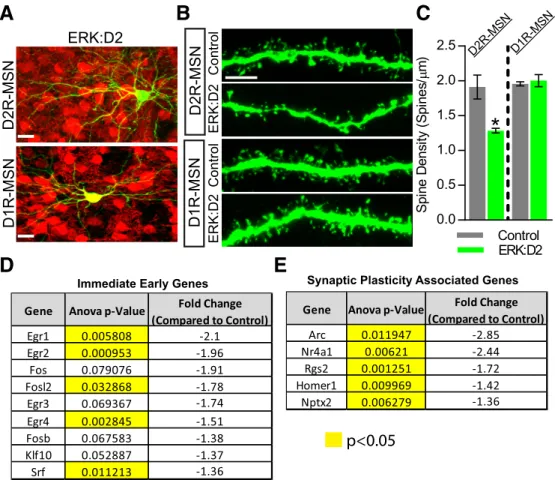
reporter line, which expresses tdTomato red fluorescent protein exclusively in D1R-MSNs (Ade et al., 2011). Therefore, all cells that coexpressed GFP and tdTomato were identified as D1R-MSNs, whereas cells that expressed GFP only were identified as D2R-MSNs (Fig. 3A).
At P21, a significant reduction in the density of spines was observed along dendrites of D2R-MSNs in ERK:D2 mice com-pared with littermate controls (Welch-correctedt(2.148)⫽6.190,
p⫽0.0211;Fig. 3B,C). The effect was more prominent for thinner spines normally associated with plasticity than for thicker, broader spines. Interestingly, we did not observe a significant change in spine density along dendrites of D1R-MSNs in ERK:D2 animals (Welch-correctedt(2.444)⫽0.5122,p⫽0.6511;Fig. 3B,C).
In addition to changes in dendritic spines, we also observed a reduction in soma size in ERK-deficient MSNs. Quantitative analysis demonstrated that D2R-MSNs showed a significant re-duction in somal area in ERK:D2 animals compared with litter-mate control mice (control⫽138.1m2⫾1.855; ERK:D2⫽ 113.6m2⫾2.034; Welch-correctedt
(5.95)⫽8.893,p⫽0.0001; ERK:D1
Control
ERK:D2 Control
A
B
C
D
E
30 60 90 120 150 180 0
5000 10000
Distance T
raveled
(cm)
Control ERK:D2
Time (min)
*
Con
trol
ER
K:D
1
0 5000 10000 15000
Cu
m
u
la
ti
v
e
D
is
ta
n
c
e
(c
m
) (
3
0
m
in
)
*
Cont
rol
ER
K:D
2
0 5000 10000 15000
Cu
m
u
la
ti
v
e
D
is
ta
n
c
e
(c
m
) (
3
0
m
in
)
*
Figure 2. ERK signaling is required for pathway-specific regulation of locomotor behavior.
n⫽4 mice/genotype, 5 cells/mouse). These results are consistent with previous reports of reduced soma diameter in D2R-MSNs of conditional BDNF-TrkB knock-out mice (Li et al., 2012).
Defects in spinogenesis might be expected to lead to reduc-tions in activity-regulated transcripts and in abnormal physiolog-ical function (see below). To investigate the transcriptional changes that occur in ERK-deleted D2R-MSNs during the period of active striatal synaptogenesis, we performed microarray anal-ysis on striatal punches from littermate control and ERK:D2 mice at P17 (Tepper et al., 1998;Goldin and Segal, 2003;Kozorovitskiy et al., 2012). We observed a significant reduction in the expres-sion of a number of critical immediate early genes (IEGs);Egr1,
Egr2,Egr4,Fosl2,and Srflevels were all significantly reduced in ERK:D2 mice (Fig. 3D). These reductions are consistent with the idea that ERK-deficient D2-MSNs are severely impaired in their ability to respond to presynaptic stimuli (Okuno, 2011).
We also identified a number of genes associated with synapse formation and plasticity that show significantly downregulated expression in ERK:D2 mutant mice (Fig. 3E). We observed significantly reduced expression of the postsynaptic genes Arc,
Homer1, andNptx2; the G-protein signaling regulatorRgs2; and the transcriptional activatorNr4a1(West and Greenberg, 2011;Chen et al., 2014). Together, our results related to spinogenesis and activity-regulated gene expression suggest that ERK activity is necessary for proper synaptic function and downstream signaling events.
Reduced synaptic drive and intrinsic excitability in ERK-deleted D2R-MSNs
Our findings that ERK:D2 mice have increased locomotor activ-ity logically raise the question of whether electrophysiological properties of D2R-MSNs may also be affected. To test this, patch-clamp electrophysiological recordings were obtainedex vivoto identify the strength of excitatory and inhibitory synaptic input to D2R-MSNs in ERK:D2 and control littermates (Fig. 4A). Re-cordings of mEPSCs (Fig. 4B,C) revealed a reduction in the fre-quency (t(16)⫽3.32;p⫽0.004), but not amplitude (t(16)⫽1.74;
p⫽0.101), of D2R-MSN mEPSCs in ERK:D2 mutant (black trace) versus control mice (gray trace). Recordings of mIPSCs (Fig. 4D,E) revealed a reduction in both frequency (t(15)⫽3.13;
p⫽0.007) and amplitude (t(15)⫽3.10;p⫽0.007) of D2R-MSN mIPSCs in ERK:D2 mice (black trace) versus control mice (gray trace). Together, these data reveal a reduction in both excitatory and inhibitory synaptic drive onto D2R-MSNs in ERK:D2 mice. Next, we obtainedex vivopatch-clamp electrophysiological recordings to identify the strength of excitatory and inhibitory synaptic input to D1R-MSNs (Fig. 4F) in ERK:D2 mutant and control animals. Recordings of mEPSCs (Fig. 4G,H) revealed no change in the frequency (t(13)⫽1.43;p⫽0.178) or amplitude (t(13) ⫽0.95;p⫽0.359) of D1R-MSN mEPSCs in ERK:D2 mice (black trace) versus control mice (red trace). Similarly, recordings of mIPSCs (Fig. 4I,J) revealed no change in the frequency (t(13)⫽
p<0.05
Gene Anova p-Value Fold Change (Compared to Control)
Arc 0.011947 -2.85 Nr4a1 0.00621 -2.44 Rgs2 0.001251 -1.72 Homer1 0.009969 -1.42 Nptx2 0.006279 -1.36
Synaptic Plasticity Associated Genes
Gene Anova p-Value Fold Change (Compared to Control)
Egr1 0.005808 -2.1 Egr2 0.000953 -1.96
Fos 0.079076 -1.91 Fosl2 0.032868 -1.78 Egr3 0.069367 -1.74 Egr4 0.002845 -1.51 Fosb 0.067583 -1.38 Klf10 0.052887 -1.37 Srf 0.011213 -1.36
Immediate Early Genes
Control
ERK:D2
D
E
A
B
C
Control
ERK:D2
D2R-M SN
D2R-MSN
D1R-MSN
D2R-MSN
D1R-MSN
ERK:D2 0.0
0.5 1.0 1.5 2.0 2.5
Sp
in
e
D
e
n
s
it
y
(
S
p
in
e
s/
µ
m)
Control
*
D1R-M SN ERK:D2
Figure 3. ERK signaling is required for proper spinogenesis and expression of synaptic plasticity genes.A, Representative images of D1R-MSN and D2R-MSNs labeled with AAV8-CAG-GFP virus (green). D1R-MSNs are identified by their expression of the D1tdTomatotransgene (red) and D2R-MSNs are D1tdTomatonegative. GFP-expressing D2R-MSNs appear green, whereas GFP-expressing
1.97; p ⫽ 0.070) or amplitude (t(13) ⫽ 1.18;p⫽0.260) of D1R-MSN mIPSCs in ERK:D2 mice (black trace) versus control mice (red trace). These results suggest that loss of ERK activity in D2R-MSNs does not alter synaptic drive significantly in D1R-MSNs.
In addition to changes in synaptic ac-tivity, alterations in the intrinsic excitabil-ity of neurons can lead to modifications in the activity of neural networks. Therefore, we evaluated the intrinsic excitability of D2R-MSNs in ERK:D2 and control mice. Overall, we found that the intrinsic excit-ability of D2R-MSNs in ERK:D2 mice (black trace) was reduced compared with control mice (gray trace) (Fig. 4K,L). Two-way ANOVA revealed a significant interaction (F(10,170)⫽4.417,p⫽0.0001) and planned comparisons revealed that the maximum number of action poten-tials for any sweep was lower in neurons from ERK:D2 mice versus control mice (Table 1). Furthermore, this reduction in action potential frequency in ERK:D2 mice was likely attributable to a reduced capacity to initiate action potentials be-cause both rheobase and action potential amplitude were reduced (Table 1). Fi-nally, we performed intrinsic excitability recordings in D1R-MSNs from ERK:D2 and control mice. Overall, we found that the intrinsic excitability of D1R-MSNs in ERK:D2 mice (black trace) was slightly reduced compared with that of control mice (red trace) (Fig. 4M,N). Two-way ANOVA revealed a significant interaction (F(10,160) ⫽ 2.93; p ⫽ 0.002), although planned comparisons revealed no differ-ences in the maximum number of action potentials for any sweep, rheobase, or ac-tion potential amplitude (Table 1). These
0 2 4 6 m E P S C F requen cy (H z ) 0 5 10 15 20 25 m E P S C am pl itude ( p A ) 0 2 4 6 mI PS C F re quen c y ( H z) 0 5 10 15 20 25 mI PS C a m p lit ude (pA ) Con trol ERK:D 2 0 2 4 6 m E P S C F requen cy (H z ) Cont rol ERK:D 2 0 5 10 15 20 25 m E P S C am pl itude ( p A ) Con trol ERK:D 2 0 2 4 6 m IPS C F requen c y ( H z ) Cont rol ERK:D 2 0 5 10 15 20 25 m IP S C am pl itude ( p A ) Cont rol ER K:D 2 Con trol ERK:D 2 Cont rol ERK:D 2 Con trol ERK:D 2
*
*
*
A
C
E
B
D
2s 50mV 2s 50mV 1s 25mV 1s 25mVF
H
J
G
I
D1R-MSN D2R-MSN25μm 25μm 25μm 25μm
0 100 200 300 400 500 0 10 20 30 40 50 Control ERK:D2
Somatic input (pA)
Sp
ik
e
s
0 100 200 300 400 500 0 10 20 30 40 50 Control ERK:D2
Somatic input (pA)
Sp ik e s
*
*
L
K
Control ERK:D2 Control ERK:D2
250ms
50mV 50mV250ms
N
M
D2R-MSN D1R-MSN
Figure 4. Markedly reduced excitability of ERK-deleted D2R-MSNs.A, Image of pipette recording from a D2R-MSN negative for D1tdTomato(red).B, Representative mEPSC recordings of D2R-MSNs from control (gray) and ERK:D2 mutant (black) mice. C, Summary of mEPSC frequencies and amplitudes from control (gray;n⫽3 mice,n⫽10 neurons) and ERK:D2 mutant (black;
n⫽3 mice,n⫽8 neurons) D2R-MSNs. mEPSC frequency is significantly reduced in ERK:D2 mutant D2R-MSNs (*p⬍0.01), whereas mEPSC amplitude is unchanged.D, Representative mIPSC recordings of D2R-MSNs from control (gray) and ERK:D2 mutant (black) mice.E, Summary of mIPSC frequencies and amplitudes from control (gray;n⫽3 mice;n⫽10 neurons) and ERK:D2 mutant (black;n⫽3 mice;n⫽7 neurons) D2R-MSNs. Both mIPSC frequency and amplitude are reduced significantly in ERK:D2 mutant D2-MSNs (*p⬍0.01).F, Representative image of recording pipette in a D1tdTomato-positive (red) D1R-MSN.G,
Represen-tative mEPSC recordings of D1R-MSNs from control (red) and ERK:D2 mutant (black) mice.H, Summary of mEPSC frequencies and amplitudes from control (red;n⫽3 mice;n⫽8 neurons) and ERK:D2 mutant (black;n⫽3 mice;n⫽7 neurons) D1R-MSNs. There is no significant change in mEPSC frequency or amplitude in ERK:D2 mutant D1R-MSNs compared with control.I, Represen-tative mIPSC recordings of D1R-MSNs from control (red) and ERK:D2 mutant (black) mice. J, Summary of mIPSC
4
frequencies and amplitudes from control (red;n⫽3 mice;
n⫽8 neurons) and ERK:D2 mutant (black;n⫽3 mice;n⫽7 neurons) D1R-MSNs. There is no significant difference be-tween ERK:D2 mutant D1R-MSNs and control MSNs.
K, Representative traces of whole-cell patch-clamp recordings from D2R-MSNs in control (gray) and ERK:D2 mutant (black) mice.L, Relationship between elicited action potential re-sponses and somatic current injection in D2R-MSNs of control (gray;n⫽3 mice;n⫽9 neurons) and ERK:D2 mutant (black;
data demonstrate that ERK-deficient D2R-MSNs have a signifi-cantly reduced capacity to fire action potentials.
Activity-regulated gene expression is strongly suppressed in ERK-deleted D2R-MSNs
In D2R-MSNs, dopamine binding to D2R/G␣i-coupled receptors represses neuronal excitability (Surmeier et al., 2007), whereas D2R antagonists, including haloperidol, derepress the cell and allow it to respond to excitatory input (Bonito-Oliva et al., 2011). In mice, haloperidol administration has been shown to induce catalepsy (Sanberg, 1980;Farde et al., 1992), an effect associated with increased phosphorylated ERK activity in D2R-MSNs (Bertran-Gonzalez et al., 2008). To determine whether D2R-MSN-specific ERK activity is necessary for cataleptic behavior, we administered haloperidol (1 mg/kg, i.p.) or vehicle to adult ERK:D2 mutants and littermate controls and tested for cataleptic response 1 h after administration using the horizontal bar test (Fig. 5A). Two-way ANOVA revealed a significant difference be-tween genotypes (F(1,24)⫽149.0,p⫽0.0001), treatment (F(1,24)⫽ 118.9, p ⫽ 0.0001), and a genotype ⫻ treatment interaction (F(1,24)⫽114.3,p⫽0.0001). Haloperidol administration led to an extended cataleptic freezing response in control mice com-pared with vehicle-treated controls (vehicle control vs haloperi-dol control Tukey’s post hoc adjusted: p ⫽ 0.0001; Fig. 5B). Strikingly, haloperidol-treated ERK:D2 littermates were insensi-tive to these cataleptic effects (haloperidol control vs haloperidol ERK:D2 Tukey’spost hocadjusted:p⫽0.0001;Fig. 5B). These findings demonstrate that ERK activity in D2R-MSNs is neces-sary for the induction of haloperidol-induced catalepsy in mice.
In addition to cataleptic behavior, haloperidol administration has also been demonstrated to strongly enhance activity-regulated gene expression in the striatum (Robertson et al., 1992). c-FOS is a well documented activity-induced gene and has been shown to be upregulated selectively in D2R-MSNs after acute haloperidol ad-ministration (Bertran-Gonzalez et al., 2008). We therefore ana-lyzed cell-specific c-FOS expression in ERK-deleted and control D2R-MSNs after haloperidol or vehicle administration. To dis-tinguish between D1R-MSN and D2R-MSNs, we again used the D1tdTmouse line to identify D1R-MSNs (see above). We also colabeled with the ubiquitous MSN marker CTIP2 to exclude non-MSN cells from analysis (Arlotta et al., 2008). CTIP2-positive neurons that expressed tdTomato were identified as D1R-MSNs, whereas CTIP2-positive, tdTomato-negative cells were identified as D2R-MSNs. Two-way ANOVA revealed significant differences between genotype (F(1,8)⫽1128.7,p⫽0.0001), treat-ment (F(1,8)⫽1334.9,p⫽0.0001), and a genotype⫻treatment interaction (F(1,8)⫽ 5220.2,p⫽ 0.0001). In control animals, haloperidol treatment increased the percentage of D2R-MSNs expressing c-FOS significantly compared with vehicle treatment (Tukey’s post hocadjusted: p⫽0.0001; Fig. 5C,E).Figure 5C
shows numerous c-FOS-expressing cells in a haloperidol-treated control animal (top inset shows high magnification of all three labels
with yellow arrows indicating D2R-MSNs expressing c-FOS; bottom inset shows c-FOS only). Strikingly, haloperidol administration failed to induce c-FOS expression in D2R-MSNs from ERK:D2 mu-tants because we found virtually no c-FOS labeling in these mice (Tukey’spost hocadjusted:p⫽0.0001;Fig. 5D,E). We did not ob-serve any changes in c-FOS expression in D1R-MSNs in any sample group (Fig. 5F). These findings demonstrate that activity-induced expression of c-FOS is almost completely abolished in ERK-deficient D2R-MSNs.
Our observation that activity-induced c-FOS expression is de-creased in ERK:D2 mice led us to investigate whether activity-regulated synaptic plasticity genes were similarly affected. Therefore, we analyzed expression of the activity-induced synaptic cytoskel-etal protein ARC in response to haloperidol or vehicle admi-nistration in ERK:D2 mice and littermate controls. Two-way ANOVA revealed significant differences between genotype (F(1,8)⫽ 129.8,p⫽0.0001), treatment (F(1,8)⫽84.05,p⫽0.0001), and a genotype⫻treatment interaction (F(1,8)⫽80.89,p⫽0.0001). In control animals, haloperidol treatment greatly increased the per-centage of D2R-MSNs expressing ARC compared with vehicle treatment (Tukey’s post hocadjusted: p ⫽0.0001; Fig. 5G,I). Figure 5G shows numerous ARC-expressing cells in a halo-peridol-treated control animal (top inset shows high magnification of all three labels with yellow arrows indicating D2R-MSNs express-ing ARC; bottom inset shows the ARC label only). In contrast, we observed minimal ARC expression in haloperidol-treated ERK:D2 mice (Tukey’spost hoc adjusted: haloperidol-treated ERK:D2 vs control,p⫽0.0001;Fig. 5H,I, arrows in the top and bottom insets show ARC-deficient D2R-MSNs; green cells in the bottom inset are D1R-MSNs expressing ARC).
Interestingly, we found that there is significantly increased expression of ARC in D1R-MSNs of ERK:D2 mice in both haloperidol- and vehicle-treated mutants compared with litter-mate controls receiving the same treatment (Fig. 5J). Two-way ANOVA revealed significant differences between genotype (F(1,8)⫽ 129.8,p⫽0.0001), treatment (F(1,8)⫽84.05,p⫽0.0001), and a genotype⫻treatment interaction (F(1,8)⫽80.89,p⫽0.0001). Although D1R-MSNs did not show hyperexcitability in acute slices from ERK:D2 mice, it remains plausible that the network-level ho-meostatic changes in D1R-MSN activity might account for this result.
Discordant effects of ERK deletion between the D2-Cre and Adora2-Cre line
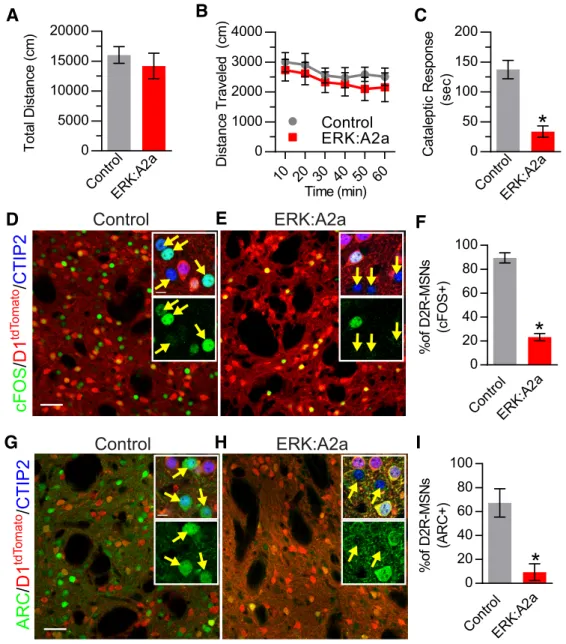
In the D2-Cre line, Cre is expressed in a population of striatal cholinergic interneurons in addition to D2R-MSNs (Kravitz et al., 2010;Durieux et al., 2011). Therefore, we performed similar ex-periments in the Adora2a-Cre line (A2a-Cre), which targets D2R-MSNs but not cholinergic interneurons (Durieux et al., 2009). Surprisingly, we found that ERK:A2a mutant mice did not recapitulate the open-field hyperlocomotor phenotype observed in ERK:D2 mice. Total basal locomotor activity was unchanged Table 1. Membrane and action potential properties of ERK:D2 MSNs
Group IR (M⍀) RMP (mV) Rheo (pA) Thresh (mV) Amp (mV) H.W. (ms) MaxAPs
D2R Control 126⫾19 ⫺79.6⫾2.7 161⫾20 ⫺38.8⫾1.3 72.0⫾3.2 0.87⫾0.07 45.1⫾3.3 D2R Erk:D2 115⫾15 ⫺76.2⫾4.7 315⫾68* ⫺29.4⫾4.5 52.8⫾7.7* 0.87⫾0.10 25.6⫾7.8* D1R Control 87⫾12 ⫺85.6⫾2.0 204⫾16 ⫺38.5⫾2.2 73.1⫾4.6 0.87⫾0.06 37.7⫾2.9 D1R Erk:D2 73⫾6 ⫺76.9⫾4.6 252⫾18 ⫺33.9⫾2.1 68.3⫾4.4 0.87⫾0.05 36.7⫾2.4
Basic membrane properties and action potential properties in D2R-MSNs and D1R-MSNs recorded during intrinsic excitability experiments.
between ERK:A2a and littermate control mice (Welch-corrected
t(10.24)⫽0.717,p⫽0.489;Fig. 6A). Likewise, the total locomotor activity profile over the entire 1 h test session did not differ sig-nificantly between ERK:A2a and control animals (repeated-measures ANOVA; no main genotype effect,F(1,6)⫽1.137,p⫽ 0.327; no time⫻genotype interaction:F(5,30)⫽0.127,p⫽0.985; Fig. 6B).
We next investigated whether ERK:A2a mutant mice also dif-fered in their response to haloperidol. We first tested these ani-mals for haloperidol-induced catalepsy. Interestingly, ERK:A2a mutants responded similarly to ERK:D2 mutant mice, showing a significantly decreased cataleptic response to haloperidol admin-istration compared with haloperidol-treated controls (Welch-correctedt(6.86)⫽5.73,p⫽0.0008;Fig. 6C). Next, we sought to determine whether haloperidol-induced changes in the expres-sion of activity induced genes c-FOS and ARC in ERK:A2a mu-tants. Consistent with our findings in ERK:D2 mutants, there is a significant reduction in c-FOS-expressing D2R-MSNs in ERK: A2a mutant mice in response to haloperidol (Welch-corrected
t(3.61)⫽12.65,p⫽0.0004;Fig. 6D–F). Similarly, ARC expression in D2R-MSNs is almost abolished in ERK:A2a mutant mice after haloperidol administration (Welch-correctedt(3.24)⫽4.21,p⫽ 0.021; Fig. 6G–I). Therefore, evidence from two independent lines demonstrates that ERK is essential to the regulation of activity-induced gene expression in D2R-MSNs.
Temporal delay in A2a-Cre mediated ERK deletion
To determine why ERK:D2 and ERK:A2a may differ in their basal locomotor activities, we first verified that ERK2 expression was ablated in D2R-MSNs of ERK:A2a mice. Unexpectedly, we found that a large proportion of D2R-MSNs expressed ERK2 protein at P21 (Fig. 7A). At this stage, ⬎40% of D2R-MSNs (45.16⫾ 3.34%) maintained ERK2 expression (Fig. 7B). We repeated the analysis at P28 and observed a decrease in ERK2-positive D2R-MSNs; however,⬃20% (16.89⫾3.91%) of D2R-MSNs still ex-pressed ERK2 protein at this age (Fig. 7B). In contrast, ERK2 expression was effectively lost at P21 in ERK:D2 D2R-MSNs (Fig. 1D). These findings suggest that the A2a-Cre mouse line shows temporally delayed elimination of ERK activity in D2R-MSNs compared with the D2-Cre mouse line.
The discrepancy between our ERK:D2 and ERK:A2a findings suggests a potential spatiotemporal incongruity in Cre expression between the A2a-BAC and Drd2-BAC lines. To determine whether the Cre transgene is expressed effectively in all D2R-MSNs in the A2a line, we first backcrossed these mice with Ai9 Cdependent
re-H
G
I
J
D2R-MSNs D1R-MSNs D1R-MSNs Con trolERK :D2
Con trol
ERK :D2 0 20 40 60 80 100 P e rc e n ta g e o f D 2 R -M S N s E x pr es s ing c F O S Haloperidol Vehicle
*
*
*
Con trolERK :D2 Con trol ERK :D2 0 20 40 60 80 100 Pe rc e n ta g e o f D 1 R -M S N s Ex p re s s in g c F O S Haloperidol Vehicle Contr ol ER K:D 2 Con trol ERK :D2 0 50 100 150 Ca ta le p ti c R e s p o n s e (s e c ) Haloperidol Vehicle
*
*
Con trol ERK :D2 Cont rol ERK :D2 0 20 40 60 80 100 Pe rc e n ta g e o f D 1 R -M S N s E x p res s ing A R C Vehicle Haloperidol*
#*
Con trolERK :D2 Contr ol ERK :D2 0 20 40 60 80 100 Pe rc e n ta g e o f D 2 R -M S N s Exp re s s in g AR C Vehicle Haloperidol
*
*
cFOS / D1 tdT o mato / CTIP2 ARC / D1 tdT o mato / CTIP2A
B
D
E
C
F
D2R-MSNsFigure 5. Activity-regulated gene expression is strongly suppressed in ERK-deleted D2R-MSNs.A, Representative image of cataleptic response to haloperidol using horizontal bar test.
B, Quantification of cataleptic response (freezing) to haloperidol (1 mg/kg) or vehicle in litter-mate control and ERK:D2 mutant mice. Control mice exhibit a robust cataleptic response to haloperidol compared with vehicle-treated controls (*p⫽0.001,n⫽7 mice/genotype/con-dition). The cataleptic response is effectively abolished in the mutant mice (*p⫽0.001, haloperidol-treated ERK:D2 vs haloperidol treated control;n⫽7 mice/condition). Vehicle-treated mice show no cataleptic response (n⫽7 mice per genotype per treatment).
4
C,D, c-FOS (green) expression in control and ERK:D2 mutant striatum 1 h after haloperidol administration. CTIP2 (blue) identifies all MSNs; D1tdTomato(red) identifies the D1R-MSN
sub-population. All D2R-MSNs are CTIP2(⫹);tdTomato(⫺). Insets are magnified images showing all three labels (top) and c-FOS only (bottom) demonstrating that c-FOS is strongly upregulated in D2R-MSNs (yellow arrows) in control (C) but not ERK:D2 animals (D).E, Quantification of MSN-specific c-FOS expression after haloperidol (1 mg/kg) or vehicle administration (*p⬍
0.001;n⫽3 mice/genotype; 200 –250 cells/mouse).F, No changes in c-FOS expression are observed in D1R-MSNs in either control or ERK:D2 mutant animals. (n⫽3 animals/genotype, 200 –250 cells/animal).G,H, ARC (green) expression in control and ERK:D2 mutant striatum 1 h after haloperidol administration. CTIP2 (blue) identifies all MSNs; D1tdTomato(red) identifies the
porter mice, which label all Cre-expressing cells with tdTomato fluorescent protein (Madisen et al., 2010). We then crossed these A2a-Cre; Ai9 mice with D2-GFP BAC-transgenic mice, which express GFP in all D2R-expressing cells (Gong et al., 2007) (Fig. 7C). The proportion of cells that expressed D2R-only (green), A2a-only (red), or coexpressed both (A2a/D2; yellow) were then quantified at multiple postnatal stages (Fig. 7D). At P14, approx-imately one-third of labeled cells were D2 only (32.02⫾7.61%), one-third were A2a only (34.51⫾3.55%), and the remaining one-third coexpressed A2a and D2 (33.47⫾6.52%;Fig. 7D). At P21, we observed an increase in A2a/D2 coexpression, however nearly 25% of cells still did not show A2a recombination (D2 only: 26.33 ⫾ 4.88%; A2a only: 12.62 ⫾ 1.21%; A2a ⫹ D2:
61.05⫾3.74%;Fig. 7D). By P28, 15% of D2R-expressing cells still had not undergone A2a-Cre-mediated recombination (D2 only: 14.45⫾5.06%; A2a only: 7.58⫾1.08%; A2a⫹D2: 77.97⫾6.13%; Fig. 7D). This result demonstrates that the A2a-Cre mouse line is delayed in inducing genetic recombination in D2R-MSNs during striatal development.
Discussion
ERK signaling is essential for MSN-pathway-specific motor functions
The functions of ERK signaling in the striatum have been the focus of numerous investigations due to the hypothesized impor-tance of the pathway in normal striatal functions and in disease
A
B
C
D
E
F
I
G
H
ARC
/
D1
tdT
o
mato
/
CTIP2
Control
ERK:A2a
Cont rol
ERK :A2a
0 5000 10000 15000 20000
To
ta
l D
is
ta
n
c
e
(
c
m
)
10 20 30 40 50 60
0 1000 2000 3000 4000
Time (min)
D
is
ta
n
c
e
T
ra
v
e
led
(
c
m
)
Control ERK:A2a
Cont rol
ERK :A2a
0 50 100 150 200
Ca
ta
le
p
ti
c
R
e
s
p
o
n
se
(s
e
c
)
*
Contr ol
ERK :A2a
0 20 40 60 80 100
%o
f D
2
R
-M
S
N
s
(c
F
O
S
+
)
*
Con trol
ERK :A2
a
0 20 40 60 80 100
%o
f D
2
R
-M
S
N
s
(A
R
C
+
)
*
cFOS
/
D1
tdT
o
mato
/
CTIP2
Control
ERK:A2a
Figure 6. Basal and haloperidol-induced behavioral and gene expression changes in ERK:A2a mice.A,B, Open-field locomotor testing of ERK:A2a and control mice (n⫽7 animals/genotype).
states (Fasano and Brambilla, 2011;Cerovic et al., 2013). Here, we present the first genetic evidence that cell-type-specific elimina-tion of ERK activity markedly impairs striatal pathway specific motor functions. The severity of these phenotypes presumably reflects the fact that multiple external stimuli (including neu-rotransmitters and growth factors) and intrinsic neural activity act via ERK to regulate MSN functions.
Deletion of both ERK1 and ERK2 in D2R-MSNs results in a pronounced and long-lasting hyperlocomotor phenotype. The intensity of this phenotype was unexpected given that germline ERK1-KO mice show molecular and behavioral phenotypes in-dicative of increased neuronal activity and ERK2-hypomorphic mice fail to show locomotor defects (Selcher et al., 2001; Mazzuc-chelli et al., 2002;Ferguson et al., 2006;Satoh et al., 2007;Engel et al., 2009). However, our results are entirely consistent with stud-ies showing that specific ablation of D2R-MSNs leads to marked hyperlocomotor activity (Saito et al., 2001;Sano et al., 2003; Du-rieux et al., 2009). ERK:D2 mice are also insensitive to the cata-leptic effects of haloperidol, a response mediated by D2R-MSNs (Sanberg, 1980;Farde et al., 1992). This insensitivity to haloper-idol is also consistent with results obtained using genetic ablation of D2R-MSNs (Durieux et al., 2012).
Given that ERK:D2 mice show no evidence of cell death in the striatum and that D2R-MSN axonal projections are appropri-ately targeted and maintained, our data suggest that the behav-ioral phenotypes observed are a result of dramatically reduced functionality of D2R-MSNs. The hypolocomotive phenotype in ERK:D1 mice also recapitulates D1R-MSN ablation, suggesting that ERK activity is necessary for the proper function of both MSN populations (Drago et al., 1998;Durieux et al., 2012;Re´vy et al., 2014).
The dramatic decline in health and early lethality of ERK:D1 mice precluded a full analysis of this line. The changes in body-weight and movement after the first postnatal week are consistent with previous findings in both dopamine-deficient mice and knock-out models using D1-Cre (Zhou and Palmiter, 1995; Ko-zorovitskiy et al., 2012). Presumably, ERK:D1 pups cannot ac-quire nourishment during and after weaning.
ERK activity is required for D2R-MSN excitability
ERK:D2 mice exhibit a significantly reduced density of dendritic spines on D2R-MSNs. Previous studies using genetic ERK mod-els did not observe spine alterations (Satoh et al., 2007). Further, D2R-specific knock-outs of BDNF-TrkB, an upstream activator of ERK, failed to induce spine changes (Lobo et al., 2010;Besusso et al., 2013). Coincidently, these BDNF-TrkB models also fail to show locomotor changes until at least 1 year of age (Besusso et al., 2013). Therefore, loss of ERK in D2R-MSNs leads to more strik-ing defects in spinogenesis, as well as more dramatic changes in locomotion, than does loss of BDNF/TrkB.
Changes in dendritic spine density are known to be associated with changes in mEPSCs (Segal, 2005). Consistent with this idea, D2R-MSNs from ERK:D2 mice exhibited a marked reduction in the frequency of mEPSCs. These data suggest reduced excitatory synaptic connectivity in D2R-MSNs. However, we cannot ex-clude that changes in presynaptic release are also involved. This striking change in synaptic efficacy has the potential to disrupt patterned activity derived from cortical and thalamic excitatory input onto D2R striatal neurons. The observed reduction in fre-quency and amplitude of mIPSCs would have the potential to further disrupt D2R-MSN circuit functions.
In addition to reduced synaptic strength, we observed a dra-matic reduction in the intrinsic excitability of ERK-deficient D2R-MSNs. Mechanisms that might explain this phenotype in-clude loss of ERK-mediated phosphorylation of metabotropic or ionotropic receptors or voltage gated ion channels (Sweatt, 2004). For example, ERK phosphorylation regulates dendritic localiza-tion of the voltage-gated potassium channel Kv4.2, which is expressed abundantly in D2R-MSNs and serves to dampen neu-ronal excitability (Adams et al., 2000;Yuan et al., 2002;Day et al., 2008). Loss of ERK might lead to increased surface expression of Kv4.2 and decreased neuronal excitability. Interestingly, in a re-cent study of P14 excitatory cortical pyramidal neurons, condi-tional ERK deletion resulted in hyperexcitability (Xing et al., 2016). Whether these distinct effects on excitability represent dif-ferences in ERK regulation in excitatory versus inhibitory neu-rons or differences in the developmental stages studied is unclear at present.
Regardless of mechanisms, the reductions of synaptic efficacy and neuronal excitability observed in D2R-MSNs would likely impair the functioning of D2R-MSNs in governing motor behav-ior. These effects on excitability may well explain the marked hyperlocomotor activity that we observed in ERK:D2 mice. Further-more these changes are potentially relevant to a number of patho-logical states. For example, if similar ERK regulation of excitability
ERK2/D1tdTomato/CTIP2
A
B
C
D
A2a/D2 colabeled A2a only D2 onlyP14 P21 P28
A2aCre;Ai9 D2GFP Merge
P21 P28
0 10 20 30 40 50 60
% o
f
D
2
R
-M
S
N
s
Ex
p
re
s
s
in
g
ER
K
2
*
*
*
*
*
*
*
occurs in D1R-MSNs, it would be relevant to L-Dopa-induced dys-kinesia, which is known to be associated with striking increases in ERK activity (Gerfen et al., 2002;Feyder et al., 2011). We note that that there may be differences in ERK regulation between D1R-MSN and D2R-MSNs. Indeed, it has been shown that the PKA-dependent phosphorylation of histone H3 in response to cell stimulation is ERK dependent in D1R-MSNs but ERK independent in D2R-MSNs (Bertran-Gonzalez et al., 2009).
Expression of activity-regulated genes
Previous pharmacological and genetic studies investigating ERK involvement in striatal activity-induced gene expression pro-duced conflicting results. For instance, pan-striatal pharmaco-logical blockade of ERK activity reduced activity-induced gene expression in the striatum (Sgambato et al., 1998;Vanhoutte et al., 1999;Zanassi et al., 2001), whereas germline ERK1 knock-out mice showed increased IEG expression in the striatum ( Mazzuc-chelli et al., 2002;Ferguson et al., 2006). Our cell-type-specific ablation of ERK activity in D2R-MSNs clearly demonstrate a strong reduction of activity-regulated gene expression in D2R-MSNs. Gene expression profiling at P17 showed markedly re-duced expression of IEGs and synaptic plasticity genes in ERK:D2 mutant mice. We extended these observations using haloperidol administration, which normally elicits strong activity-induced expression of these genes (Bertran-Gonzalez et al., 2008). Even upon stimulation with haloperidol, IEG gene expression was largely abrogated in D2R-MSNs. Therefore, our data demon-strate that ERK is critical for activity-induced gene expression in MSNsin vivo, a process that is essential for driving neuronal synaptic plasticity and adaptations in basal ganglia circuits ( Fla-vell and Greenberg, 2008;West and Greenberg, 2011).
ERK is thought to control activity-mediated gene expression via activation of a number of critical transcription factors ( Gi-rault et al., 2007). However, in ERK-deficient D2R MSNs, it re-mains unclear whether the reduction in activity-induced gene expression is a direct effect of ERK pathway transcriptional reg-ulation or if the reduced neuronal excitability in the ERK-deleted MSNs also plays a role. ERK deficiency may also impair transla-tion of local mRNA stores in response to stimuli (O’Donnell et al., 2012). Finally, effects of ERK deficiency could be due to reg-ulation of developmental events (see below). Future studies that ablate ERK activity inducibly will be important in further defin-ing ERK-dependent mechanisms in adult MSNs.
Differences in phenotypes between Adora2a- and D2-Cre ERK-deficient mice
Our studies show a concordance of phenotypes between ERK:D2 mice and ERK:A2a mice in regard to their resistance to haloperidol-induced catalepsy and loss of activity-haloperidol-induced gene expression. A surprising result is that ERK:A2a mice do not exhibit the hyper-locomotor phenotype seen in the ERK:D2 mouse line. A possible explanation is related to different patterns of recombination between the D2-Cre and A2a-Cre mouse lines. Although D2-Cre mice target a small population of cholinergic interneurons in the striatum, A2a-Cre-transgenic mice reportedly do not target the cholinergic population (Durieux et al., 2009;Kozorovitskiy et al., 2012;Kharkwal et al., 2016). However, preservation of ERK in cholinergic neurons in the A2a line is unlikely to account for the behavioral difference because cholinergic interneurons ulti-mately act on the MSN population. For example, a recent study showed that haloperidol-induced changes in cholinergic neuron activity were relayed directly to D2R-MSNs to mediate cataleptic effects (Kharkwal et al., 2016).
A more likely explanation for the different observed behaviors is the temporal delay in Cre-mediated ERK2 deletion in the ERK: A2a mice. At P21, nearly 45% of D2R-MSNs continue to express ERK2 in ERK:A2a mice compared with only 3% in ERK:D2 mu-tants. Even at P28, almost 20% of D2R-MSNs still express ERK in A2a-Cre mice. These findings argue that the loss of ERK activity specifically in D2R-MSNs before or during the “critical period” of network formation (Tepper et al., 1998;Kozorovitskiy et al., 2012) results in hyperlocomotor behavior, whereas loss after the critical period results in a milder phenotype. Therefore, reduc-tions in ERK/MAP activity before or during the critical period may lead to long-lasting modifications of circuit function and behavioral abnormalities. This concept may be pertinent to the etiology of developmental hyperkinetic disorders such as attention deficit hyperactivity disorder (Faraone et al., 2015;Rosenberg et al., 2016). The observation that ERK:A2a mice, which exhibit delayed recombination, show impaired expression of activity-regulated genes in response to haloperidol in adulthood underscores the im-portance of ERK functions in neural plasticity even beyond the crit-ical period.
References
Adams JP, Anderson AE, Varga AW, Dineley KT, Cook RG, Pfaffinger PJ, Sweatt JD (2000) The A-type potassium channel Kv4.2 is a substrate for the mitogen-activated protein kinase ERK. J Neurochem 75:2277–2287.
Medline
Ade KK, Wan Y, Chen M, Gloss B, Calakos N (2011) An improved BAC transgenic fluorescent reporter line for sensitive and specific identifica-tion of striatonigral medium spiny neurons. Front Syst Neurosci 5:32.
CrossRef Medline
Alonso M, Medina JH, Pozzo-Miller L (2004) ERK1/2 activation is neces-sary for BDNF to increase dendritic spine density in hippocampal CA1 pyramidal neurons. Learn Mem 11:172–178.CrossRef Medline
Arlotta P, Molyneaux BJ, Jabaudon D, Yoshida Y, Macklis JD (2008) Ctip2 controls the differentiation of medium spiny neurons and the establish-ment of the cellular architecture of the striatum. J Neurosci 28:622– 632.
CrossRef Medline
Bertran-Gonzalez J, Bosch C, Maroteaux M, Matamales M, Herve´ D, Valjent E, Girault JA (2008) Opposing patterns of signaling activation in dopa-mine D1 and D2 receptor-expressing striatal neurons in response to co-caine and haloperidol. J Neurosci 28:5671–5685.CrossRef Medline
Bertran-Gonzalez J, Håkansson K, Borgkvist A, Irinopoulou T, Brami-Cherrier K, Usiello A, Greengard P, Herve´ D, Girault JA, Valjent E, Fisone G (2009) Histone H3 phosphorylation is under the opposite tonic con-trol of dopamine D2 and adenosine A2A receptors in striatopallidal neu-rons. Neuropsychopharmacology 34:1710 –1720.CrossRef Medline
Besusso D, Geibel M, Kramer D, Schneider T, Pendolino V, Picconi B, Cala-bresi P, Bannerman DM, Minichiello L (2013) BDNF-TrkB signaling in striatopallidal neurons controls inhibition of locomotor behavior. Nat Commun 4:2031.CrossRef Medline
Bonito-Oliva A, Feyder M, Fisone G (2011) Deciphering the actions of an-tiparkinsonian and antipsychotic drugs on cAMP/DARPP-32 signaling. Front Neuroanat 5:38.CrossRef Medline
Bureau G, Carrier M, Lebel M, Cyr M (2010) Intrastriatal inhibition of extra-cellular signal-regulated kinases impaired the consolidation phase of motor skill learning. Neurobiol Learn Mem 94:107–115.CrossRef Medline
Calabresi P, Picconi B, Tozzi A, Ghiglieri V, Di Filippo M (2014) Direct and indirect pathways of basal ganglia: a critical reappraisal. Nat Neurosci 17:1022–1030.CrossRef Medline
Cargnello M, Roux PP (2011) Activation and function of the MAPKs and their substrates, the MAPK-activated protein kinases. Microbiol Mol Biol Rev 75:50 – 83.CrossRef Medline
Cerovic M, d’Isa R, Tonini R, Brambilla R (2013) Molecular and cellular mechanisms of dopamine-mediated behavioral plasticity in the striatum. Neurobiol Learn Mem 105:63– 80.CrossRef Medline
Chen Y, Wang Y, Ertu¨rk A, Kallop D, Jiang Z, Weimer RM, Kaminker J, Sheng M (2014) Activity-induced Nr4a1 regulates spine density and distribu-tion pattern of excitatory synapses in pyramidal neurons. Neuron 83:431–