E s ti m a ti o n of m u s cl e a c tiv a tio n
d u r i n g d iff e r e n t w a l ki n g s p e e d s
wi t h t w o m a t h e m a ti c al
a p p r o a c h e s c o m p a r e d t o s u rf a c e
E M G
T ri nl er, U, L e b o e uf, FY, H oll a n d s , K, Jo n e s , R a n d B a k er, R
h t t p :// dx. d oi.o r g / 1 0 . 1 0 1 6 /j. g ai t p o s t . 2 0 1 8 . 0 6 . 1 1 5
T i t l e E s ti m a ti o n of m u s cl e a c tiv a tio n d u r i n g d iff e r e n t w al ki n g s p e e d s w i t h t w o m a t h e m a t i c al a p p r o a c h e s c o m p a r e d t o s u r f a c e E M G
A u t h o r s T ri nl er, U, L e b o e uf, FY, H oll a n d s , K, Jo n e s , R a n d B a k er, R
Typ e Ar ticl e
U RL T hi s v e r si o n is a v ail a bl e a t :
h t t p :// u sir. s alfo r d . a c . u k /i d/ e p ri n t/ 4 7 8 4 6 / P u b l i s h e d D a t e 2 0 1 8
U S IR is a d i gi t al c oll e c ti o n of t h e r e s e a r c h o u t p u t of t h e U n iv e r si ty of S alfo r d . W h e r e c o p y ri g h t p e r m i t s , f ull t e x t m a t e r i al h el d i n t h e r e p o si t o r y is m a d e f r e ely a v ail a bl e o nli n e a n d c a n b e r e a d , d o w nl o a d e d a n d c o pi e d fo r n o
n-c o m m e r n-ci al p r iv a t e s t u d y o r r e s e a r n-c h p u r p o s e s . Pl e a s e n-c h e n-c k t h e m a n u s n-c ri p t fo r a n y f u r t h e r c o p y ri g h t r e s t r i c ti o n s .
Accepted Manuscript
Title: Estimation of muscle activation during different walking speeds with two mathematical approaches compared to
surface EMG
Authors: Ursula Trinler, Fabien Leboeuf, Kristen Hollands, Richard Jones, Richard Baker
PII: S0966-6362(18)30285-6
DOI: https://doi.org/10.1016/j.gaitpost.2018.06.115 Reference: GAIPOS 6232
To appear in: Gait & Posture
Received date: 27-3-2018 Revised date: 22-5-2018 Accepted date: 17-6-2018
Please cite this article as: Trinler U, Leboeuf F, Hollands K, Jones R, Baker R, Estimation of muscle activation during different walking speeds with two mathematical approaches compared to surface EMG, Gait and Posture (2018), https://doi.org/10.1016/j.gaitpost.2018.06.115
1
Estimation of muscle activation during different walking speeds with two
mathematical approaches compared to surface EMG.
Ursula Trinlera,b, Fabien Leboeufa, Kristen Hollandsa, Richard Jonesa, Richard Bakera
aUniversity of Salford, School of Health Science, Allerton Building, Frederick Road Campus, Salford, M6 6PU, United Kingdom
bBG Unfallklinik Ludwigshafen, Zentrum für Bewegungsanalytik, Forschung und Lehre, Ludwig-Guttmann Straße 13, 67071 Ludwigshafen, Germany
Corresponding author:
Ursula Trinler
Forschung und Lehre
BG Unfallklinik Ludwigshafen
Ludwig-Guttmann Str. 13
67071 Ludwigshafen
Germany
[email protected], 0049-621 6810 8498
HIGHLIGHTS
Results show high deviations between modelling approaches and EMG.
Slower speeds resulted in smaller deviations than faster speeds.
Neither modelling approach (SO, CMC) had an overall better agreement with EMG.
Muscle estimation needs further improvements before it can be implemented in CGA.Abstract
2 Background: Muscle force estimation could improve clinical gait analysis by enhancing
insight into causes of impairments and informing targeted treatments. However, it is not
currently standard practice to use muscle force models to augment clinical gait analysis,
partly, because robust validations of estimated muscle activations, underpinning force
modelling processes, against recorded electromyography (EMG) are lacking.
Research Question: Therefore, in order to facilitate future clinical use, this study sought to
validate estimated lower limb muscle activation using two mathematical models (static
optimisation SO, computed muscle control CMC) against recorded muscle activations of ten
healthy participants.
Methods: Participants walked at five speeds . Visual agreement in activation onset and offset
as well as linear correlation (r) and mean absolute error (MAE) between models and EMG
were evaluated.
Results: MAE between measured and recorded activations were variable across speeds (SO vs
EMG 15-68%, CMC vs EMG 13-69%). Slower speeds resulted in smaller deviations (mean
MAE < 30%) than faster speeds. Correlation was high (r > 0.5) for only 11/40 (CMC) and
6/40 (SO) conditions (muscles X speeds) compared to EMG.
Significance: Modelling approaches do not yet show sufficient consistency of agreement
between estimated and recorded muscle activation to support recommending immediate
clinical adoption of muscle force modelling. This may be because assumptions underlying
muscle activation estimations (e.g. muscles’ anatomy and maximum voluntary contraction )
are not yet sufficiently individualizable. Future research needs to find timely and cost efficient
ways to scale musculoskeletal models for better individualisation to facilitate future clinical
implementation.
Keywords: Muscle activation, modelling, surface EMG, walking
3
Introduction
Neuro-musculoskeletal impairments occurring as a consequence of disease, injury or aging
are a substantial burden on our health care system [1]. Clinical gait analysis aids in identifying
and understanding the causes of these impairments by measuring the movement and torque of
the joints [2]. Knowing the activation and force profiles of individual muscles during various
movements can help to gain further insight into the causes of impairments and inform targeted
treatments. Yet, a range of muscle activation and force modelling approaches have been
applied in research studies of sport performance or clinical interventions [3-7] but use of
modelling has not yet become established as a part of routine clinical gait analysis [8].
One reason muscle force modelling has not yet been used to its full advantage in clinical
practice is that there is a huge variety of approaches producing different results [8]. The
influence of different modelling assumptions and approaches on model outputs are still not
fully understood. Each approach incorporates different aspects of musculoskeletal
morphology, kinematics and kinetics and muscle function using a range of different
assumptions [5, 9, 10]. Estimation techniques range from solving a static optimisation (SO) to
complex optimal control problems [10]. Other techniques, for example computed muscle
control (CMC), combine inverse and forward dynamics [11-13] to track recorded kinematics
while improving computational time. Whilst faster than CMC, SO does not incorporate the
excitation-contraction dynamics of the muscle [13], which might be crucial for patients with
an impaired neuromuscular physiology [14].
Another reason for lack of application of force modelling in clinical gait analyses maybe
related to the difficulty in validating estimated muscle forces [15]. This, in turn, inhibits
4
selection of the approach which may best model the neuro-muscular impairments in the
patients it is applied to. Validation of muscle activation is important to underpin valid force
outcomes [16] because direct validation of estimated muscle force is only possible with
in-vivo force transducers. Studies have validated force estimations indirectly against EMG [9,
10, 14, 17]. However, this approach is limited by the fact that there is no simple relationship
between activation and force [18]. Arguably, a more robust phased approach to validation of
force modelling is to first validate its estimated muscle activations against recorded EMG in a
range of walking speeds and patient groups. A few studies [9, 19, 20] have made some
attempts to validate estimated muscle activation methods against EMG, however, were
limited in either how EMG as a validation tool was used (e.g. only visual inspection or using
input EMG to validate outputs) or in their modelling protocol (e.g. use of different simulation
environments to compare different modelling approaches).
Additionally, an examination of estimated muscle activations at a range of walking speeds is
lacking in the literature. To ensure force modelling is appropriate for clinical use it is
particularly important to know whether the estimated activations respond in the same way as
experimental EMG at different gait speeds. A prevalent gait impairment of neurological and
musculoskeletal conditions is reduced walking speed [21]. Differences in walking speed result
in changes in joint angles [22], ground reaction forces (GRF) [23] and EMG [22]. The change
in joint kinematics can lead to differences in the contractile state (fibre length, velocity) [24]
of each muscle and, therefore, lead to differences in the generation of muscle forces [19].
Therefore, this study seeks to expand the current literature and robustly validate estimated
muscle activations underpinning muscle force models by comparing estimated lower limb
muscle activation using SO and CMC with recorded EMG of ten healthy participants while
5
its future clinical use. It was hypothesised that muscle activations will generally increase with
walking speed, while there will be a good agreement between mathematical models and
surface EMG. Furthermore, CMC will result in better agreement with EMG due to the
forward dynamic approach compared to SO.
Methods
Ethical approval was granted by the College of Health and Social Care Ethics Panel. Ten healthy
adults (5F/5M, mean±SD of age 28±5 years, height 1.72±0.08m, mass 69±12kg) were
recruited from amongst University students and staff. All participants provided written
informed consent.
Experimental setup
A ten-camera motion capture system (Vicon Nexus 1.8.5, 100Hz) was used with four force
plates embedded into the walkway (Kistler, 1000Hz). Before starting the measurement,
cameras were ensured to be coexistent with the force plates by using the Caltester approach
[25] (< 1° force orientation error, < 3mm CoP displacement error). Surface EMG was
collected in parallel with a wireless 16 channel Noraxon system using an in-built low pass
filter of 500Hz (DTS receiver, 1000Hz). The SENIAM [22] guidelines were adopted and
following preparation of the skin, electrodes were placed on the following muscles : rectus
femoris, vastus medialis and lateralis, semitendinosus, tibialis anterior, soleus, and
gastrocnemius medialis and lateralis.
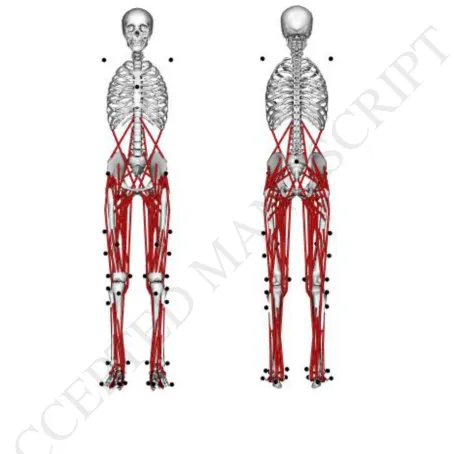
Reflective markers were placed on following anatomical landmarks similar to a CAST model
[26] and adapted from the proposed model gait2392 in OpenSim [27]: acromion, anterior
superior iliac spine, midpoint of both posterior superior iliac spines, three markers on the
6
midfoot lateral, toe lateral and medial (1st and 5th metatarsal), and tip of the first toe (Figure
1).
Data collection
Following a static standing trial, the participant walked at his/her self-selected speed over the
force plates on a ten-meter walkway, while five valid (individual foot fall entirely on a single
force plate) gait cycles for each leg were recorded. This procedure was repeated for 20% and
40% slower and faster walking speeds in following order: self-selected, 20% slow, 40% slow,
20% fast, 40% fast. Speed was monitored with timing gates placed five meters apart the start
and end of the walkway. Participants were given feedback on their speed to guide them to
walk at the prescribed speed to achieving the target speed within 1%.
Data processing
The raw marker trajectories were pre-processed in Vicon by a customised pipeline to calculate
several virtual landmarks and joint centres for static scaling [28]. Gait events were defined via
automatic force plate detection and visually verified. The GRFs were filtered in MATLAB
(2012b, Mathworks, Matick NA), the kinematics in OpenSim (Release 3.3) [12], both with a
6Hz low-pass 2nd order Butterworth filter. EMG signals were offset corrected, rectified, and
filtered with a high-pass 20Hz Fast Fourier transform filter and, to create a linear envelope,
with a 6Hz low-pass 2nd order Butterworth filter.
Musculoskeletal model
We used the generic musculoskeletal model gait2392 of OpenSim [29, 30], which describes a
male subject with a body height of 1.80m and a body mass of 75.16kg. It consists of 12
rigid-body segments (torso, pelvis, thigh, shank, talus, foot, toes) which are surrounded by 92
7
musculo-tendon actuators summing up to 72 muscles (Figure 1) while providing in total 21
degree of freedoms (3 DoF of the upper body, 6 DoF of the pelvis, 3 DoF of the hip, 2
DoF-driven knee, 1 DoF of the ankle). A detailed description of the model can be found elsewhere
[29, 30].
Estimation of muscle activation
Processed marker trajectories and experimental GRFs were imported into OpenSim 3.3 using
tools from Lee-Son’s Toolbox [31]. The SimTrack pipeline [12] within OpenSim was used
for further calculations. After scaling the model [28], dynamic segment poses were tracked
using inverse kinematics. Calculated joint angles and experimental GRFs are further used to
estimate muscle excitations with two modelling approaches: i) SO and ii) CMC. These
estimation techniques have been chosen due to their frequent use in the literature ( SO), its
novel approach (CMC), and its independence to EMG, which allows an unbiased comparison
with EMG. To ensure essential dynamical consistency for CMC between joint kinematics
and GRFs, Residual Reduction Algorithm (RRA) was used [10] to adjust mass properties of
the model (i.e. centre of mass of the torso, mass of the body segments) using nonphysical
compensatory forces and moments called residuals.
SO (inverse dynamics) resolves the net joint moments into individual muscle forces [10]
using force-length velocity relation while minimising squared muscle activations as objective
function. The same criteria were implemented in CMC, which are the standard setting in
OpenSim for both SO and CMC. While SO is a time independent process, CMC loops the
process at time step t forward to the next time step t+T. Therefore, the process is
time-dependent, however, represents only a limited forward dynamics process due to its
8
independency to all other time steps [13]. This allows the model to stay efficient in
computational time which is an important factor for routine processing.
Data analysis
All data were normalised to 100% of the gait cycle after which estimated muscle activation
profiles were compared qualitatively via visual inspection to the profiles of recorded muscle
activations. One representative trial of the dominant leg of each participant and walking speed
was chosen by an experienced researcher according to a clean EMG signal to be able to
directly compare individual observed activation with the directly related estimated muscle
activation. Recorded and estimated muscle activation were normalised to the maximum
activation of the self-selected walking trial . Data were further analysed to calculate the
mean absolute error (MAE) between SO and CMC, SO and EMG, as well as CMC and EMG
of each of the 101 data points (n) [32] to analyse the mean deviation between techniques:
𝑀𝐴𝐸 = ( 𝑛1∑𝑛𝑖=1|𝐴1𝑖 − 𝐴2𝑖|) (1)
A1i represents the muscle activation at the ith time step of the gait cycle of one of the three
conditions ( SO, CMC, EMG), A2 i the muscle activation at the same time step of one of the
other conditions [33]. MAE was then multiplied by 100 to represent the percentage of MAE
dependent to 100% activity.
Furthermore,, the linear correlation of the 101 data points was analysed using the Spearman
correlation coefficient r (non-normal distribution) for each participant and walking speed
between SO and CMC, SO and EMG, as well as between CMC and EMG was calculated.
The classification of Cohen [34] was used (0.1 < | r | < 0.3 weak correlation, 0.3 < | r | < 0.5
moderate correlation, 0.5 < | r | strong correlation). To be able to analyse speed-related
changes in more detail, a descriptive trend-analysis of mean muscle activation, (taken
9 throughout the, normalised, gait cycle, of fast and slow walking speed, relative to mean
muscle activation at self-selected speed) was undertaken.
Results
Muscle peak activation is generally increasing with higher walking speeds for estimated and
observed muscle activation (Figure 2, muscle activation profiles normalised to a gait cycle).
Only tibialis anterior shows visually low speed-dependence for SO and EMG and nearly
none with CMC. Vastus lateralis presents similar changes for different approaches in stance
but not in swing, where SO shows nearly no activation for all speeds compared to CMC and
EMG. Qualitative inspection shows peak values to be comparable between modelling
approaches and compared to surface EMG, except for rectus femoris and semitendinosus,
especially for the fast walking speeds. Trend analysis (Figure 3) shows average higher
activations at faster speeds than slower speeds for both CMC and SO. Mean of slow (SO,
CMC) and very slow (SO, EMG) walking for tibialis anterior as well as slow (CMC) for
gastrocnemius lateralis, slow (SO, CMC, EMG) for gastrocnemius medialis, and slow (EMG)
and very slow (EMG) for semitendinosus are around 0% and have partial standard deviations
above zero.
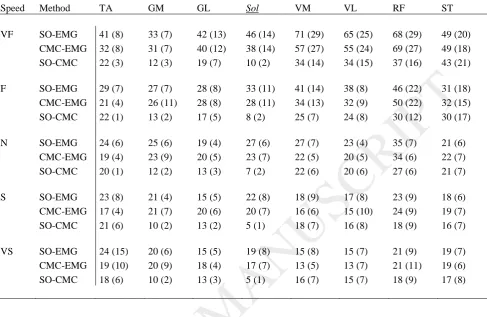
MAE percentage to 100% muscle activity between modelling approaches and EMG were
widely spread across walking speeds (SO vs EMG: 15-68%, CMC vs EMG: 13-69%), while
only 26 of 40 and 27 of 40 conditions (muscles X speeds) for SO and CMC, respectively,
stayed under 30% (Table 1). Smaller MAE are generally shown for slower walking speeds
where self-selected (except muscle rectus femoris) slow and very slow stayed under 30% for
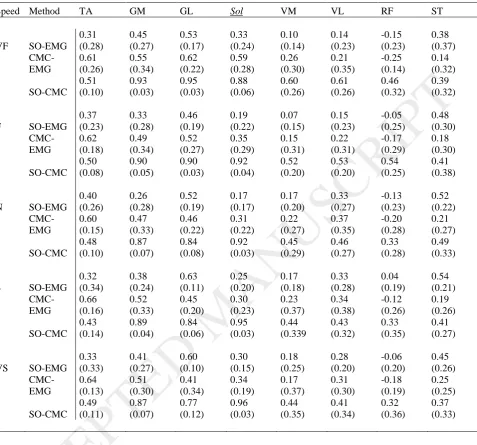
all muscles. High linear correlation (r > 0.5 [34]) were only found for 11 of 40 (CMC) and 6
10
resulted in better correlation (r > 0.5, 15 of 40 conditions) than thigh muscles (r > 0.5, 2 of 40
conditions). Rectus femoris shows negative or zero correlation between estimated and
recorded muscle activation.
Both, MAE and linear correlation showed better results when comparing modelling
approaches than when compared them to EMG.
Discussion
This study aimed to compare estimated muscle activations of SO and CMC modelling
approaches to recorded EMG of lower limb muscles in ten healthy participants walking at five
different speeds. Such robust validation of estimated muscle activation patterns has been
lacking in the literature and is necessary to underpin valid force outcomes and facilitate future
use of force modelling to augment clinical gait analyses. Our results show high deviations
between modelling approaches and EMG; neither modelling approach had an overall better
agreement with EMG. The strongest agreement with EMG, for both modelling approaches,
occurred at slower speeds but only for some of the muscles (especially those on the shank).
We further considered the response of estimated muscle activations to speed and agreement to
EMG of particular muscles to identify how muscle activation estimation can be improved.
As hypothesised, magnitude of both estimated and recorded muscle activations increase with
faster walking speeds in all muscles, except for some of tibialis anterior peakmuscle
activation (Figure 2). This muscle reacted differently to speed as slower walking resulted in
partially higher estimated and recorded activation levels than faster walking, especially for
CMC and SO after loading response. Also, slower walking speeds showed similar averaged
11
activation of tibialis anterior at slowest walking speeds has also been reported previously [19,
20]. The higher activation for tibialis anterior while walking slower might be caused by a
deviation from the natural walking pattern of the participant (i.e. higher energy costs [35]).
This might increase or change the demand on the activation of tibialis anterior. Overall, these
results show similar changes dependent on walking speed for both estimated and recorded
muscle activity.
Slower walking resulted in smaller absolute mean error between estimated and recorded
muscle activation for both modelling approaches. This may be because joint moments are
sensitive to accelerations [36], which increase with speed and thus amplify the residual
between measured and model-calculated GRF. As suggested by Thelen and colleagues [11]
we attempted to overcome this problem by introducing a residual reduction algorithm (RRA)
before applying CMC which reduces dynamic inconsistency between experimental GRF and
kinematic data. While CMC showed stronger correlations for shank muscles, it did not show
better overall agreement with recorded EMG compared to SO, as might be expected applying
RRA before CMC. Therefore, although CMC has the advantage over SO to include a limited
time-dependent algorithm, CMC cannot be favoured over SO according to our results.
Our findings of a general better agreement between modelling approaches and EMG in the
shank than thigh muscles is, mostly, in agreement with previous findings of Zuk et al. [17].
This study reported high correlations between modelling approaches and EMG for
gastrocnemius or soleus but weaker agreement for biceps femoris, rectus femoris and tibialis
anterior. Better agreement between estimated and recorded muscle activation at the shank
may be due to better assumptions about individual muscle characteristics in the shank
12
more dependent on particular characteristics of individual muscles (i.e., lever arm, cross
sectional area) rather than estimation technique. Zuk et al. [17], therefore, concluded that
further research needs to focus on the force-sharing problem (which muscle is favoured above
the other) and the development of cost functions describing motor control strategies
(perception of the environment and consequential motor variability) more closely, which
means that more effort needs to be undertaken to improve subject-specific musculoskeletal
models.
At the level of the thigh, a negative correlation was seen between estimated activation and
EMG for rectus femoris. This is due to anticyclic activation pattern between estimated and
recorded activation. Previous literature has shown, that rectus femoris might be only active
around transition from stance to swing, with recorded activations at the start and end of a gait
cycle being attributed to crosstalk from the vastii muscles [37]. This indicates a potential
limitation of using surface EMG as a validation tool for estimating muscle activation; as
crosstalk from other muscles may confound the validation process [32]. Further, this
highlights the importance of good quality EMG collections in order to confirm estimated
activations.
Summarised, some other limitations of the present study are related to the limited ability to
adjust the musculoskeletal model. Only segment length, mass and inertia were adjusted to
match participants. Muscle specific characteristics, like the individual maximum muscle
force-length relationships of muscle and tendon, and their origins and insertions have been
kept according to the generic model. This may have made for less accurate muscle activation
estimations. Furthermore, SO is based on a rigid tendon assumption, while CMC is not.
13
neither model agreed with recorded EMG more closely or consistently than the other so this is
not thought to be a major limitation for a healthy population [10]. Finally, when considering
clinical use of modelling approaches, use of optimisation criterion (minimisation of the
squared sum of all muscle activation ), which do not take co-contraction into consideration,
may limit validity in application to patients with higher activation of agonistic and
antagonistic muscles [39].
Conclusion
The presented difference between estimated and recorded muscle activation and non-linear
correlation for some of the muscles indicates that estimation of muscle activations, and,
therefore, estimation of muscle forces, need further improvements before they can be
implemented in a routine clinical setting. Neither SO nor CMC resulted in better agreement
to EMG, and can be favoured above the other. More research on patients is needed to
understand relevant advantages of different mathematical estimation techniques. For this,
future research needs to find timely and cost efficient ways to scale musculoskeletal models
for a better individualisation to facilitate future clinical implementation. Specifically, further
development in subject specific muscle modelling and the force-sharing problem are crucial
that estimation errors can be minimised.
Conflict of interest statement
All authors had no financial and personal relationships with other people or organisations that
could inappropriately influence (bias) this work.
14
References
[1] Woolf AD, Erwin J, March L. The need to address the burden of musculoskeletal conditions. Best Pract Res Clin Rheumatol. 2012;26:183-224.
[2] Davis RB. Reflections on clinical gait analysis. Journal of electromyography and
kinesiology : official journal of the International Society of Electrophysiological Kinesiology. 1997;7:251-7.
[3] Buchanan TS, Lloyd DG, Manal K, Besier TF. Estimation of Muscle Forces and Joint Moments Using a Forward-Inverse Dynamics Model. Medicine & Science in Sports & Exercise. 2005;37:1911-6.
[4] Arnold AS, Anderson FC, Pandy MG, Delp SL. Muscular contributions to hip and knee extension during the single limb stance phase of normal gait: a framework for investigating the causes of crouch gait. Journal of biomechanics. 2005;38:2181-9.
[5] Anderson FC, Pandy MG. A dynamic optimization solution for vertical jumping in three dimensions. Comput Meth Biomech Biomed Eng. 1999;2:201-31.
[6] Hatze H. A comprehensive model for human motion sumulation and its application to the take-off phase of the long jump. Journal of biomechanics. 1981;14:135-42.
[7] Alexander N, Schwameder H. Effect of sloped walking on lower limb muscle forces. Gait & posture. 2016;47:62-7.
[8] Trinler U, Hollands K, Jones R, Baker R. A systematic review of approaches to modelling lower limb muscle forces during gait: Applicability to clinical gait analyses. Gait & posture. 2018;61:353-61.
[9] Lin YC, Dorn TW, Schache AG, Pandy MG. Comparison of different methods for estimating muscle forces in human movement. Proceedings of the Institution of Mechanical Engineers Part H - Journal of Engineering in Medicine. 2012;226:103-12.
[10] Anderson FC, Pandy MG. Static and dynamic optimization solutions for gait are practically equivalent. Journal of biomechanics. 2001;34:153-61.
[11] Thelen DG, Anderson FC. Using computed muscle control to generate forward dynamic simulations of human walking from experimental data. Journal of biomechanics.
2006;39:1107-15.
[12] Delp SL, Anderson FC, Arnold AS, Loen P, Habib A, John CT, et al. OpenSim: Open-Source Software to Create and Analyze Dynamic Simulations of Movement. IEEE
transactions on bio-medical engineering. 2007;54:1940-50.
[13] Thelen DG, Anderson AE, Delp SL. Gererating dynamic simulations of movement using computed muscle control. Journal of biomechanics. 2003;36:321-8.
[14] De Groote F, Pipeleers G, Jonkers I, Demeulenaere B, Patten C, Swevers J, et al. A physiology based inverse dynamic analysis of human gait: potential and perspectives. Computer Methods in Biomechanics & Biomedical Engineering. 2009;12:563-74.
[15] Lund ME, de Zee M, Andersen MS, Rasmussen J. On validation of multibody musculoskeletal models. Proceedings of the Institution of Mechanical Engineers Part H, Journal of engineering in medicine. 2012;226:82-94.
15
[16] Hicks J, Uchida TK, Seth A, Rajagopal A, Delp SL. Is my model good enough? Best practices for verification and validation of musculoskeletal models and simulations of movement. Journal of biomechanical engineering. 2015;137:020905.
[17] Żuk M, Syczewska M, Pezowicz C. Use of the surface electromyography for a quantitative trend validation of estimated muscle forces. Biocybernetics and Biomedical Engineering. 2018.
[18] Erdemir A, McLean S, Herzog W, van den Bogert AJ. Model-based estimation of muscle forces exerted during movements. Clinical Biomechanics. 2007;22:131-54.
[19] Neptune RR, Sasaki K, Kautz SA. The effect of walking speed on muscle function and mechanical erergetics. Gait & posture. 2008;28:135-43.
[20] Liu MQ, Anderson FC, Schwartz MH, Delp SL. Muscle contributions to support and progression over a range of walking speeds. Journal of biomechanics. 2008;41:3243-52.
[21] Dickstein R. Rehabilitation of gait speed after stroke: a critical review of intervention approaches. Neurorehabilitation and neural repair. 2008;22:649-60.
[22] Schwartz MH, Rozumalski A, Trost JP. The effect of walking speed on the gait of typically developing children. Journal of biomechanics. 2008;41:1639-50.
[23] Lelas JL, Merriman GJ, Riley PO, Kerrigan DC. Predicting peak kinematic and kinetic parameters from gait speed. Gait & posture. 2003;17:106-12.
[24] Arnold EM, Hamner SR, Seth A, Millard M, Delp SL. How muscle fiber lengths and velocities affect muscle force generation as humans walk and run at different speeds. J Exp Biol. 2013;216:2150-60.
[25] Holden J, Selbie W, Stanhope S. A proposed test to support the clinical movement analysis laboratory accreditation process. Gait & posture. 2003;17:205-13.
[26] Leardini A, Sawacha Z, Paolini G, Ingrosso S, Nativo R, Benedetti MG. A new anatomically based protocol for gait analysis in children. Gait & posture. 2007;26:560-71.
[27] Chand J, Hammer S, Hicks J. Collecting Experiemntal Data. OpenSim Documentation2012.
[28] Trinler U, Baker R. Estimated landmark calibration of biomechanical models for inverse kinematics. Medical engineering & physics. 2017.
[29] Delp SL. Surgery Simulation: A Computer Graphics System to Analyse and Design Musculoskeletal Reconstructions of the Lower Limb [Ph.D.]. Stanford, CA: Standford University; 1990.
[30] Delp SL, Loan P, Hoy MG, Zajac FE, Topp EL, Rosen JM. An interactive graphics-based model of the lower extremtiy to study orhtopaedics surgical procedures. IEEE transactions on bio-medical engineering. 1990;37:757-67.
[31] Lee S, Son J. Lee-Son's Toolbox: a Toolbox that Converts VICON Mocap Data into OpenSim Inputs. 2010.
[32] Alexander N, Schwameder H. Comparison of Estimated and Measured Muscle Activity During Inclined Walking. Journal of applied biomechanics. 2016;32:150-9.
16
[33] de Zee M, Dalstra M, Cattaneo PM, Rasmussen J, Svensson P, Melsen B. Validation of a musculo-skeletal model of the mandible and its application to mandibular distraction
osteogenesis. Journal of biomechanics. 2007;40:1192-201.
[34] Cohen J. A Power Primer. Psychological Bulletin. 1992;112:155-9.
[35] Waters R, Lunsford B, Perry J, Byrd R. Energy - Speed Relationship of Walking: Standard Tables. Journal of Orthopaedic Research. 1988;6:215-22.
[36] Cahouet V, Luc M, David A. Static optimal estimation of joint acceleration for inverse dynamics problem solution. Journal of biomechanics. 2002;35:1507-13.
[37] Nene A, Byrne C, Hermens H. Is rectus femoris really a part of quadriceps?: Assessment of rectus femoris function during gait in able-bodied adults. Gait & Posture. 2004;20:1-13.
[38] De Groote F, Kinney AL, Rao AV, Fregly BJ. Evaluation of Direct Collocation Optimal Control Problem Formulations for Solving the Muscle Redundancy Problem. Annals of biomedical engineering. 2016;44:2922-36.
[39] Heiden TL, Lloyd DG, Ackland TR. Knee joint kinematics, kinetics and muscle co-contraction in knee osteoarthritis patient gait. Clinical Biomechanics. 2009;24:833-41.
17
[image:19.595.80.535.172.627.2]Figure legends
FIGURE 1. Musculoskeletal model gait2392 with applied marker model.
FIGURE 2a. Mean estimated muscle activation of the shank of 10 participants using static
optimisation (SO) and computed muscle control (CMC) compared to surface EMG for all five
walking speeds. Speeds are indicated from light grey (very slow) to black (very fast). Time
(x-axis) is normalised to 100% of a gait cycle, muscle activation (y-axis) is normalised to
peak activation of a typical self-selected walking trial.
18
FIGURE 2b. Mean estimated muscle activation of the thigh of 10 participants using static
optimisation (SO) and computed muscle control (CMC) compared to surface EMG for all five
walking speeds. Speeds are indicated from light grey (very slow) to black (very fast). Time
(x-axis) is normalised to 100% of a gait cycle, muscle activation (y-axis) is normalised to
peak activation of a typical self-selected walking trial.
19 FIGURE 3. Trend-analysis of mean muscle activation averaged over ten participants, taken
throughout the normalised gait cycle, of fast and slow walking speed, relative to mean muscle
activation at self-selected speed in percentage.
20
21
TABLE 1. Mean absolute error and its SD (activation level in %) between static optimisation
(SO) and computed muscle control (CMC), SO and EMG, and CMC and EMG.
Speed Method TA GM GL Sol VM VL RF ST
VF SO-EMG 41 (8) 33 (7) 42 (13) 46 (14) 71 (29) 65 (25) 68 (29) 49 (20) CMC-EMG 32 (8) 31 (7) 40 (12) 38 (14) 57 (27) 55 (24) 69 (27) 49 (18) SO-CMC 22 (3) 12 (3) 19 (7) 10 (2) 34 (14) 34 (15) 37 (16) 43 (21)
F SO-EMG 29 (7) 27 (7) 28 (8) 33 (11) 41 (14) 38 (8) 46 (22) 31 (18) CMC-EMG 21 (4) 26 (11) 28 (8) 28 (11) 34 (13) 32 (9) 50 (22) 32 (15) SO-CMC 22 (1) 13 (2) 17 (5) 8 (2) 25 (7) 24 (8) 30 (12) 30 (17)
N SO-EMG 24 (6) 25 (6) 19 (4) 27 (6) 27 (7) 23 (4) 35 (7) 21 (6)
CMC-EMG 19 (4) 23 (9) 20 (5) 23 (7) 22 (5) 20 (5) 34 (6) 22 (7) SO-CMC 20 (1) 12 (2) 13 (3) 7 (2) 22 (6) 20 (6) 27 (6) 21 (7)
S SO-EMG 23 (8) 21 (4) 15 (5) 22 (8) 18 (9) 17 (8) 23 (9) 18 (6)
CMC-EMG 17 (4) 21 (7) 20 (6) 20 (7) 16 (6) 15 (10) 24 (9) 19 (7) SO-CMC 21 (6) 10 (2) 13 (2) 5 (1) 18 (7) 16 (8) 18 (9) 16 (7)
VS SO-EMG 24 (15) 20 (6) 15 (5) 19 (8) 15 (8) 15 (7) 21 (9) 19 (7)
CMC-EMG 19 (10) 20 (9) 18 (4) 17 (7) 13 (5) 13 (7) 21 (11) 19 (6) SO-CMC 18 (6) 10 (2) 13 (3) 5 (1) 16 (7) 15 (7) 18 (9) 17 (8)
VF= very fast, F= fast, N= self-selected, S= slow, VS= very slow; SO= static optimisation, CMC= computed
muscle control, TA = tibialis anterior, GM = gastrocnemius medialis, GL= gastrocnemius lateralis, Sol = soleus,
VM = vastus medialis, VL= vastus lateralis, RF= rectus femoris, ST = semitendinosus.
22
TABLE 2. Mean correlation coefficient and SD between muscle activation of static
optimisation (SO) and computed muscle control (CMC), SO and EMG, and CMC and EMG.
Speed Method TA GM GL Sol VM VL RF ST
VF SO-EMG
0.31 (0.28) 0.45 (0.27) 0.53 (0.17) 0.33 (0.24) 0.10 (0.14) 0.14 (0.23) -0.15 (0.23) 0.38 (0.37) CMC-EMG 0.61 (0.26) 0.55 (0.34) 0.62 (0.22) 0.59 (0.28) 0.26 (0.30) 0.21 (0.35) -0.25 (0.14) 0.14 (0.32) SO-CMC 0.51 (0.10) 0.93 (0.03) 0.95 (0.03) 0.88 (0.06) 0.60 (0.26) 0.61 (0.26) 0.46 (0.32) 0.39 (0.32)
F SO-EMG
0.37 (0.23) 0.33 (0.28) 0.46 (0.19) 0.19 (0.22) 0.07 (0.15) 0.15 (0.23) -0.05 (0.25) 0.48 (0.30) CMC-EMG 0.62 (0.18) 0.49 (0.34) 0.52 (0.27) 0.35 (0.29) 0.15 (0.31) 0.22 (0.31) -0.17 (0.29) 0.18 (0.30) SO-CMC 0.50 (0.08) 0.90 (0.05) 0.90 (0.03) 0.92 (0.04) 0.52 (0.20) 0.53 (0.20) 0.54 (0.25) 0.41 (0.38)
N SO-EMG
0.40 (0.26) 0.26 (0.28) 0.52 (0.19) 0.17 (0.17) 0.17 (0.20) 0.33 (0.27) -0.13 (0.23) 0.52 (0.22) CMC-EMG 0.60 (0.15) 0.47 (0.33) 0.46 (0.22) 0.31 (0.22) 0.22 (0.27) 0.37 (0.35) -0.20 (0.28) 0.21 (0.27) SO-CMC 0.48 (0.10) 0.87 (0.07) 0.84 (0.08) 0.92 (0.03) 0.45 (0.29) 0.46 (0.27) 0.33 (0.28) 0.49 (0.33)
S SO-EMG
0.32 (0.34) 0.38 (0.24) 0.63 (0.11) 0.25 (0.20) 0.17 (0.18) 0.33 (0.28) 0.04 (0.19) 0.54 (0.21) CMC-EMG 0.66 (0.16) 0.52 (0.33) 0.45 (0.20) 0.30 (0.23) 0.23 (0.37) 0.34 (0.38) -0.12 (0.26) 0.19 (0.26) SO-CMC 0.43 (0.14) 0.89 (0.04) 0.84 (0.06) 0.95 (0.03) 0.44 (0.339 0.43 (0.32) 0.33 (0.35) 0.41 (0.27)
VS SO-EMG
0.33 (0.33) 0.41 (0.27) 0.60 (0.10) 0.30 (0.15) 0.18 (0.25) 0.28 (0.20) -0.06 (0.20) 0.45 (0.26) CMC-EMG 0.64 (0.13) 0.51 (0.30) 0.41 (0.34) 0.34 (0.19) 0.17 (0.37) 0.31 (0.30) -0.18 (0.19) 0.25 (0.25) SO-CMC 0.49 (0.11) 0.87 (0.07) 0.77 (0.12) 0.96 (0.03) 0.44 (0.35) 0.41 (0.34) 0.32 (0.36) 0.37 (0.33)
VF= very fast, F= fast, N= self-selected, S= slow, VS= very slow; SO= static optimisation, CMC= computed
muscle control, TA = tibialis anterior, GM = gastrocnemius medialis, GL= gastrocnemius lateralis, Sol = soleus,
VM = vastus medialis, VL= vastus lateralis, RF= rectus femoris, ST = semitendinosus.