THE COST-EFFFECTIVENESS OF IMPROVED COMMUNICATION OF PREGNANCY RISK AND CONTRACEPTIVE INFORMATION
Seri Anderson
A dissertation submitted to the faculty at the University of North Carolina at Chapel Hill in partial fulfillment of the requirements for the degree of Doctor of Philosophy in the Department
of Health Policy and Management in the Gillings School of Global Public Health.
Chapel Hill 2018
Approved by:
Kristen Hassmiller Lich
Carolyn Tucker Halpern
Stephanie Wheeler
Leah Frerichs
ABSTRACT
Seri Anderson: The Cost-Efffectiveness of Improved Communication of Pregnancy Risk and Contraceptive Information
(Under the direction of Kristen Hassmiller Lich)
To prevent unplanned pregnancies, the Centers for Disease Control and Prevention
(CDC) recommends that women receive contraceptive counseling and suggests a contraceptive
poster that it designed as one tool to accomplish this goal. However, the CDC poster has not
been evaluated to determine whether it improves contraceptive knowledge or intentions.
Furthermore, it was not developed with the input of patients. This project’s overall objective was
to fill these gaps in the literature by creating and evaluating a patient-centered poster designed to
better communicate information about pregnancy risk and contraceptive effectiveness. My
central hypothesis was that the patient-centered poster would be a more cost-effective and
acceptable method of preventing unplanned pregnancies among women of reproductive age than
the CDC poster. This project is innovative because it draws on women’s insights to develop the
poster.
This project’s first aim compared the comprehension, relevance, and acceptability of the
two posters through cognitive interviews with N=26 women. The second aim compared how effectively the two posters changed: women’s contraceptive knowledge, the accuracy of
women’s perceived pregnancy risk, and the effectiveness of the contraceptive methods women
were most likely to use in the following year. We did this by conducting a randomized control
compared the cost-effectiveness of the two posters in comparison to the status quo. To do this,
we created two Markov models using a private payer perspective.
In the first aim, we found that the final version of the patient-centered poster was
preferred overall and in terms of comprehension and relevance by the majority of women. It
generated few remaining acceptability issues. In the second aim, we found that the
patient-centered poster improved contraceptive knowledge significantly more than the CDC poster, and both posters significantly improved the effectiveness of women’s most likely contraceptive
method. In the third aim, we found that both the patient-centered and the CDC poster reduced
costs and improved health outcomes relative to the status quo. This project helps advance the
CDC counseling recommendation and the Healthy People 2020 goal of reducing unplanned
ACKNOWLEDGEMENTS
I would first like to acknowledge my advisor, Kristen Hassmiller Lich, who began
mentoring me when I was still a Masters student. Her optimism and warmth are infectious. I
would also like to acknowledge my dissertation committee members: Carolyn Tucker Halpern,
Stephanie Wheeler, Alexander Kaysin, and Leah Frerichs. All of them were kind and generous
with their time and expertise from the moments when I met each of them.
I would also like to thank my husband, Sam Anderson, from the bottom of my heart.
After making his way through his own PhD, he took on being my unofficial sixth committee
member. Without his patience, love, and intelligence I really could not have finished this.
Having friends who were going through the same process meant that I could always talk
to someone who empathized, and often had some good advice to go along with the empathy. In
particular, Greg Woss, Ruchir Karmali, Andra Wilkinson, Nicole Kahn, and Megan Barry were
incredible cheerleaders. They made me feel like I was doing important work and would finish
someday, maybe even someday soon.
My family, including the new family that I joined along the way, always reminded me
that there is way more to life than research. I would like to thank them for making sure that my
TABLE OF CONTENTS
LIST OF TABLES ... x
LIST OF FIGURES ... xi
LIST OF ABBREVIATIONS ... xii
CHAPTER 1: INTRODUCTION AND OVERVIEW ... 1
Specific Aims ... 1
Significance... 2
Innovation ... 4
Conceptual Model ... 5
Approach ... 6
Aim 1 ... 6
Aim 2 ... 7
Aim 3 ... 11
Summary of Contributions ... 12
CHAPTER 2: LITERATURE REVIEW ... 13
Overview ... 13
Prevalence of Pregnancy Risk Misconceptions ... 13
Prevalence of Contraceptive Effectiveness Misconceptions ... 14
Sources of Misconceptions ... 15
Consequences of Misconceptions ... 17
Contraceptive Effectiveness Posters ... 18
CHAPTER 3: COGNITIVE INTERVIEWS TO IMPROVE A
PATIENT-CENTERED CONTRACEPTIVE EFFECTIVENESS POSTER ... 23
Overview ... 23
Introduction ... 24
Material and Methods ... 25
Results ... 28
Discussion ... 38
CHAPTER 4: A RANDOMIZED CONTROL TRIAL OF TWO CONTRACEPTIVE EFFECTIVENESS POSTERS ... 41
Overview ... 41
Introduction ... 42
Materials and Methods ... 43
Results ... 49
Discussion ... 56
CHAPTER 5: A COST-EFFECTIVENESS ANALYSIS OF CONTRACEPTIVE EDUCATION USING THE CDC OR PATIENT-CENTERED POSTERS ... 58
Introduction ... 59
Methods... 60
Analyses ... 73
Results ... 75
Discussion ... 79
CHAPTER 6: POLICY IMPLICATIONS, LIMITATIONS, AND CONCLUSIONS... 83
Summary of Findings, Policy Implications, and Limitations ... 83
Future Research Agenda ... 87
Conclusions ... 88
Additional Material for Models Using Categories of Effectiveness ... 90
Material Describing Models Using Individual Contraceptive Methods ... 93
Analyses ... 109
Results for Models Using Individual Contraceptive Methods ... 111
LIST OF TABLES
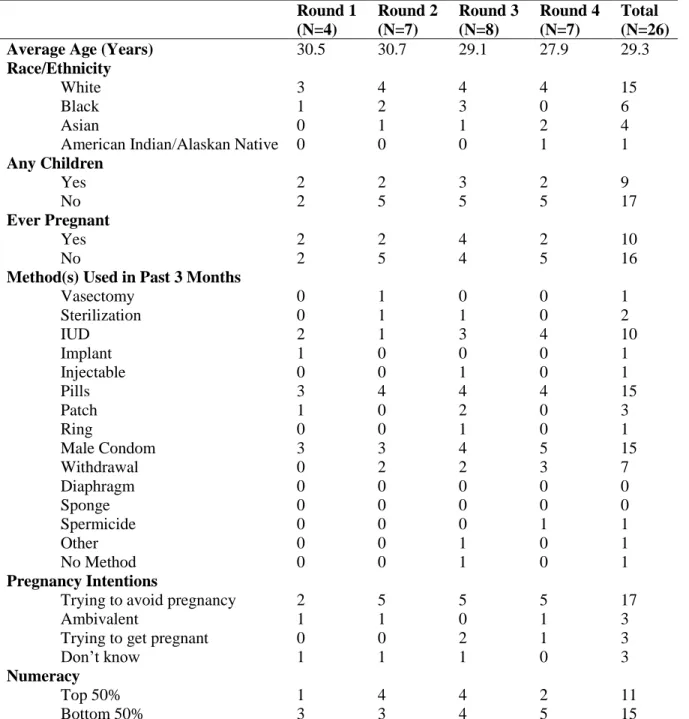
Table 3.1 Characteristics of Interviewed Women by Interview Round ... 29
Table 3.2 Abbreviated Overview Report for the CDC Poster by Domain ... 31
Table 3.3 Abbreviated Overview Report for Patient-Centered Poster by Domain ... 32
Table 3.4 Women’s Choice of Preferred Poster by Round for Each Domain ... 38
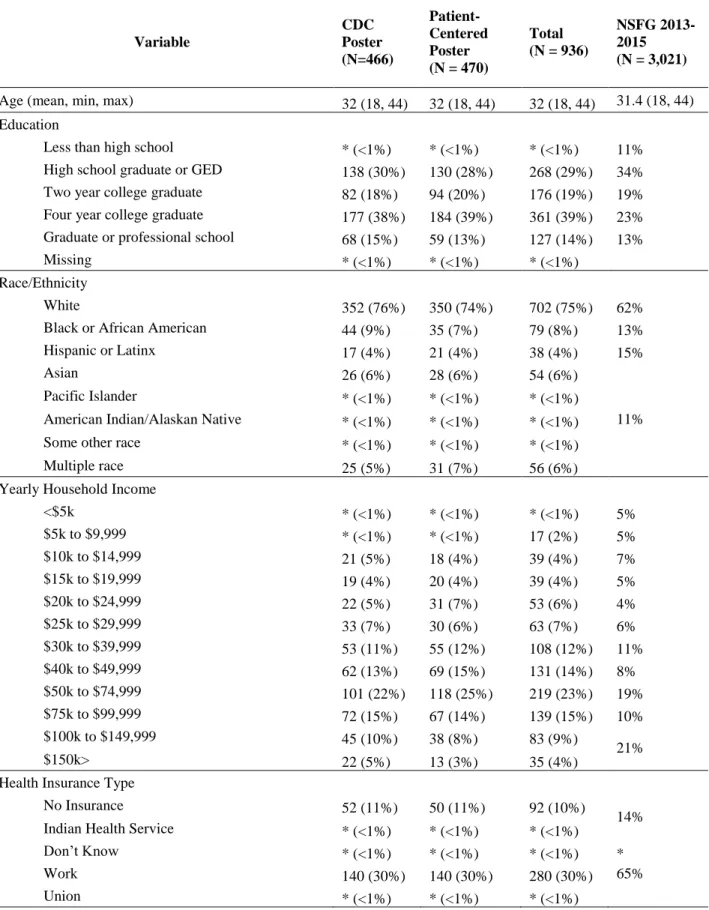
Table 4.1 Descriptive Statistics for Full Sample, Randomized Poster Assignment Groups, and a Nationally Representative Survey ... 50
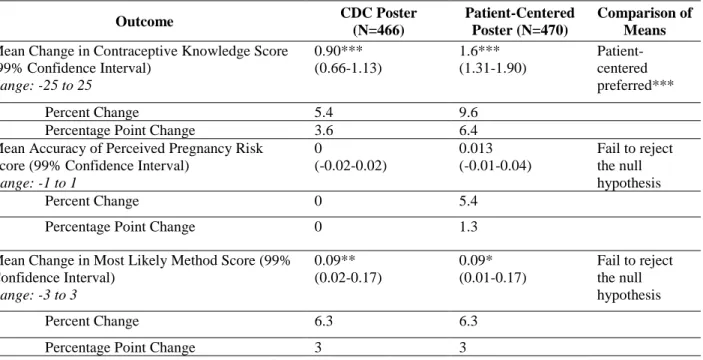
Table 4.2 Pre- and Post-Exposure Results for Outcomes ... 53
Table 4.3 Underestimating and Overestimating Pregnancy Risk in Study Population at Baseline... 54
Table 4.4 Results of T-Tests ... 54
Table 4.5 Results of T-tests on Analysis of Contraceptive Knowledge Score Separated by Whether Posters Addressed the Questions ... 55
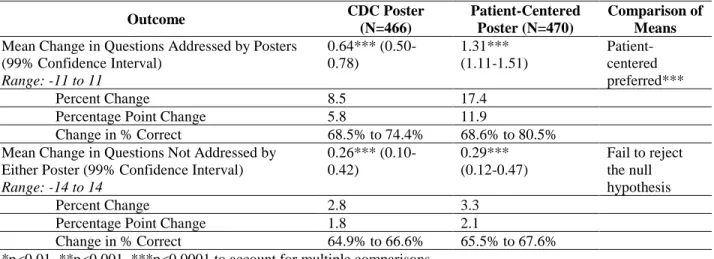
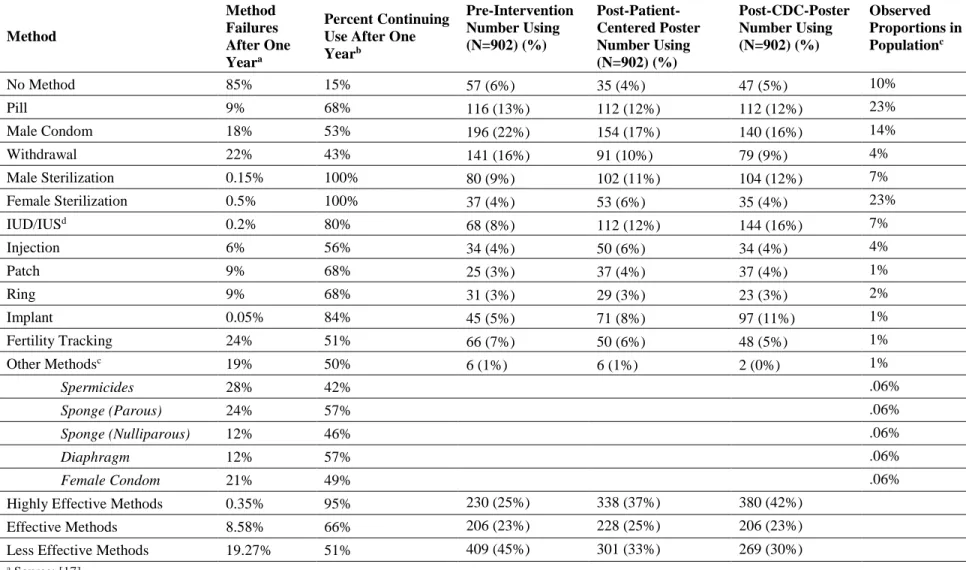
Table 5.1 Input Probabilities for Contraceptive Methods ... 65
Table 5.2 Input Probabilities for Method Failures and Adverse Events [1] ... 66
Table 5.3 Cost Inputs for the Models... 69
Table 5.4 Utilities for Switching and No-Switching Models ... 71
Table A.1 Input Probabilities for Contraceptive Methods ... 98
Table A.2 Input Probabilities for Method Failures and Adverse Events [1] ... 99
Table A.3 Cost Inputs for the Models ... 101
Table A.4 Utilities for Switching and No-Switching Models ... 106
Table A.5 Results of No-Switching and Switching Models ... 111
LIST OF FIGURES
Figure 1.1 Contraceptive Health Belief Model ... 5
Figure 1.2 CDC and Initial Version of Patient-Centered Posters ... 8
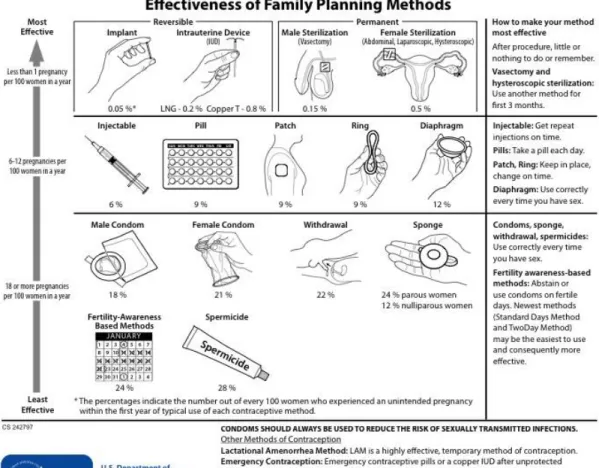
Figure 3.1 CDC-adapted Contraceptive Effectiveness Poster ... 25
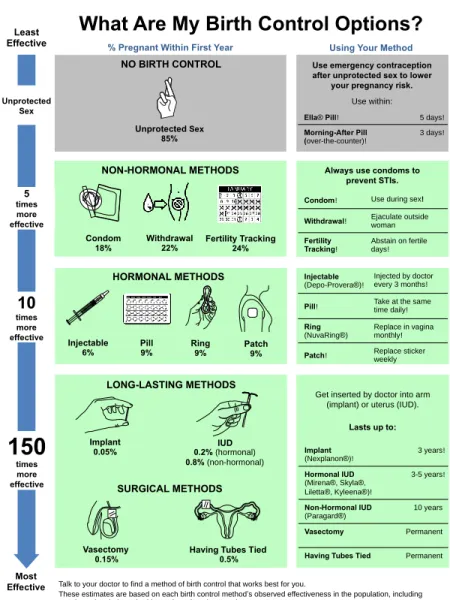
Figure 3.2 Final Iteration of the Patient-Centered Contraceptive Effectiveness Poster... 33
Figure 4.1 The CDC’s Contraceptive Effectiveness Poster ... 44
Figure 4.2 The Patient-centered Contraceptive Effectiveness Poster ... 45
Figure 5.1 Structure of Contraceptive Education Poster Markov Model ... 61
Figure 5.2 Threshold Analysis on Cost of Intervention per Woman for No-Switching Model ... 77
Figure 5.3 Threshold Analysis on Cost of Intervention per Woman for Switching Model ... 78
Figure 5.4 Bivariate Sensitivity Analysis of Variation in Follow-Through for Posters for No-Switching Model ... 79
Figure A.1 CEAC for No-Switching Model with Categories ... 90
Figure A.2 CEAC for Switching Model with Categories ... 91
Figure A.3 Incremental Cost-Effectiveness Ratio Plane for No-Switching Model ... 92
Figure A.4 Incremental Cost-Effectiveness Ratio Plane for Switching Model ... 92
Figure A.5 Structure of Contraceptive Education Poster Markov Model ... 94
Figure A.6 Incremental Cost-Effectiveness Ratio Plane for No-Switching Model ... 112
Figure A.7 Incremental Cost-Effectiveness Ratio Plane for Switching Model ... 113
Figure A.8 Cost-Effectiveness Acceptability Curve for No-Switching Model ... 114
Figure A.9 Cost-Effectiveness Acceptability Curve for Switching Model ... 114
LIST OF ABBREVIATIONS
CDC Centers for Disease Control and Prevention
NSFG National Survey of Family Growth
CHAPTER 1: INTRODUCTION AND OVERVIEW Specific Aims
In the US, unplanned pregnancies cost the public $21 billion annually [2] while harming
the health of women and children [3]. Despite representing only 14% and 18% of the women at
risk of an unplanned pregnancy, 54% and 41% of unplanned pregnancies occur among women
who do not use contraception or who use it inconsistently, respectively [4]. Two key reasons [5,
6] for inconsistent or non-use of contraception are that 40% of women greatly overestimate
contraceptive failure rates [7], and 24% of women greatly underestimate the long-term risk of
pregnancy associated with unprotected sex [8]. The Centers for Disease Control and Prevention
(CDC) has a poster that is designed to educate women about contraceptive effectiveness, but its effectiveness has not been evaluated, and it does not provide information about women’s
baseline pregnancy risk. Furthermore, it was not designed with the input of patients. An
innovative, evidence-based new contraceptive poster is needed to prevent costly and harmful
unplanned pregnancies.
This project’s objective was to create and evaluate a patient-centered poster designed to better communicate information about pregnancy risk and contraceptive effectiveness.My central hypothesis was that the patient-centered poster would be a more cost-effective and acceptable method of preventing unplanned pregnancies among women of
reproductive age than the CDC poster. This work had three specific aims:
Aim 2: Compare the effect of the CDC poster to the patient-centered poster on changes in women’s contraceptive knowledge, the accuracy of women’s perceived pregnancy risk, and the
effectiveness of the contraceptive methods women were most likely to use in the following year.
Hypothesis 1: In an online randomized control trial, women shown the patient-centered poster will increase their contraceptive knowledge, express an intention to use more
effective contraceptive options, and increase the accuracy of their perceived risk of
pregnancy compared to women shown the CDC poster.
Hypothesis 1a-c: Hypothesis 2 holds for women with past pregnancy scares, low numeracy, and no current contraceptive method.
Aim 3: Compare the cost-effectiveness for preventing unplanned pregnancies of the CDC poster and the patient-centered poster compared to the status quo, which is the current distribution of
contraceptive methods observed in the US population.
Hypothesis 2: Using two Markov models, exposure to the patient-centered poster will cost-effectively prevent unintended pregnancies compared to the status quo.
This project’s expected outcome is the estimated cost-effectiveness for preventing unplanned
pregnancies of both posters. This project helps advance the CDC recommendation to provide
contraceptive education during reproductive counseling [9] and the Healthy People 2020 goal of
reducing unplanned pregnancies [10].
Significance
A. Unintended pregnancies are common and harm the health of mothers and infants.
Unintended pregnancies comprised 45% of pregnancies in the United States in 2011 [11].
This means that nearly 5% of reproductive age women (aged 15-44) will experience an
unintended pregnancy each year [11]. Unintended pregnancies are associated with poor
worsened mental health [14]. Unintended pregnancies are also associated with poor outcomes for
infants [3]: premature birth [15], worsened relationships with parents [16], and reduced
economic investment in children [13].
B. The current approach to communicating contraceptive effectiveness encourages misinterpretation.
The CDC poster focuses on statistical and relative contraceptive effectiveness [17], as do
most paper posters. This approach has two weaknesses. First, it does not report a pregnancy rate
for unprotected sex. As a result, the CDC sheet may not educate the 1 in 4 women who
underestimate the annual probability of pregnancy for unprotected sex by >15 percentage points
[8]. Second, the sheet presents contraceptive effectiveness using one-year failure probabilities,
which people rarely interpret accurately [18]. Consequently, the CDC poster may correct few of
the 4 in 10 women who greatly overestimate contraceptive failure rates [7, 18]. The limitations
of the CDC poster have real consequences: when women overestimate the likelihood of
pregnancy with protected sex or underestimate the likelihood of pregnancy with unprotected sex,
they are less likely to use contraception [6, 19-21]. Communication research suggests that when
teaching people about risk, we should avoid statistical jargon and help people realize their
behavior puts them at risk [22]. We pilot tested a poster that avoided jargon in its presentation of
the effectiveness of each contraceptive method and no method (Aims 1-3).
C. Research on the cost-effectiveness of contraceptive posters has significant implications for policy and practice.
Reducing unintended pregnancies to 44% is a Healthy People 2020 goal [10]. Because of
this, CDC recommends reproductive counseling at every patient contact and suggests using the
CDC poster to educate people about contraception [9]. However, it is unknown whether this
recommendation is cost-effective, because the effectiveness of the CDC poster has not
methods of communicating risk that could be applied to other prevention goals, 2) test the
cost-effectiveness of the CDC poster, and 3) pilot test a new poster for preventing unplanned
pregnancies (Aims 1-3).
Innovation
When women have more contraceptive knowledge they tend to use more effective
contraception [23], but researchers do not know whether contraceptive posters are a
cost-effective educational intervention. Regardless of the outcome of this project, the results will
influence clinical practice by providing evidence to improve CDC’s recommendations regarding
contraceptive posters.
Furthermore, this project is innovative because it tests several novel measures of
probabilistic risk that couldboth help women rank contraceptive methods by effectiveness while
also correcting misconceptions that increase contraceptive non-use. Finding a method of
communicating risk that is intuitive and understandable for less numerate people would be
advantageous for public health work in reproductive health and other preventable conditions. It is
also innovative because it draws on the expertise of average patients to design a poster that meets
Figure 1.1 Contraceptive Health Belief Model Conceptual Model
The conceptual model for this study is Hall’s Contraceptive Health Belief Model [24]
(Figure 1.1). This model posits that the likelihood of contraceptive behavior is dependent on
individual decision making, which is determined by a number of factors: the perceived threat of
pregnancy, a contraceptive-cost-benefit analysis, and modifying and enabling factors (not
shown). Hall demonstrates that evidence consistently supports the links between each of the
domains in this model [24].
In the context of this model, Aim 1 refines the cue-to-action intervention, which is the
patient-centered contraceptive poster. Aim 2 tests how this cue affects contraceptive
and a woman’s contraceptive cost-benefit analysis. Aim 3 makes a business case by testing how
the posters influence costs and benefits by changing individuals’ contraceptive decision-making
and likelihood of contraceptive behavior.
Approach
I will describe my approach to each aim individually. Throughout, I study women of
reproductive age, defined as women age 18-44.
Aim 1
Introduction. This aim’s objective was to compare the comprehension, relevance, and
acceptability for the two posters. My planned approach was to conduct cognitive interviews with
approximately 20 women about the posters (Figure 1.2). The interviews occurred in several
waves, with revisions to the patient-centered poster after each wave. The rationale was to refine
the patient-centered poster and provide feedback to the CDC on its poster. The expected
outcomes were: 1) a refined patient-centered poster that was comprehensible, relevant, and
acceptable to the majority of women, 2) suggested revisions to the CDC poster to improve
comprehension, relevance, and acceptability, and 3) a qualitative understanding of how the
patient-centered poster compares to the CDC poster in terms of comprehension, relevance, and
acceptability.
Procedures. I conducted cognitive interviews with 26 women age 18-44 living in North
Carolina who spoke and read English and who had ever had sex. These women were recruited from a University email list, a women’s health research center, and a Family Medicine practice.
We purposively sampled women to have a range of characteristics that might influence their
perspectives. Cognitive interviewing explores breakdowns in the process of understanding and
responding to outside information [25], and has previously been used to test comprehension of
interviewing. I used the “think-aloud” method with semi-structured interviews to elicit responses
to the posters [27].
Analyses. We conducted interviews in unequal-sized waves until saturation was reached
within the wave; we continued adding waves until we reached a wave where there were no
suggestions warranting major revisions to the patient-centered poster. The interviews were audio
recorded, transcribed, and coded for themes. A second researcher coded half of the interviews.
Using the thematic codes and transcriptions, after each wave I created a structured report for
each poster documenting issues that arose, the number of women mentioning an issue, and the
number of mentions [25]. The summaries were used to decide what revisions to the
patient-centered poster were needed [25].
Limitations. The primary limitation of this study is that it only includes women who live
in North Carolina, which limits the generalizability of the results.
Figure 1.2 CDC and Initial Version of Patient-Centered Posters
Average Time Until an Unplanned Pregnancy for Each
Family Planning Method*
4 Months 3 Years or Less 5 Years or Less 7 Years 11 Years Lifetime
You Are at Low Risk
* Typical Use
Implant Injectable Pill Patch Ring Male Condom Fertility-Awareness
Based Methods Sponge
Male Sterilization
(Vasectomy)
Intrauterine Device (IUD)
No Method Diaphragm Spermicide Sp erm icide JANUARY 1 234 56 7 8 91011121314 15161718192021 22232425262728 2930311 23 4
SU N MO N TUES WED THUR FRI SAT
Introduction. This aim’s objective is to compare the effect of the CDC poster to the
patient-centered poster on changes in women’s contraceptive knowledge, the accuracy of women’s perceived pregnancy risk, and the effectiveness of the contraceptive methods women
were most likely to use in the following year. I tested the working hypothesis that the
patient-centered poster would significantly improve all of these outcomes compared to the CDC poster,
with subgroup analyses of this hypothesis among women with a previous pregnancy scare, low
numeracy, or no current contraceptive method. My approach was to conduct a randomized
control trial using an online national sample of approximately 1,000 women aged 18-44 who
were sexually active with a man in the past three months, not seeking pregnancy, not pregnant,
and who spoke and read English. The expected outcomes were pilot results on: 1) whether the
CDC or patient-centered posters improve risk factors for unintended pregnancy, 2) whether these
results hold for particularly vulnerable subgroups of women, and 3) whether either poster
performs significantly better than the other.
Data Sources. I collected primary data on N = 990 women for this aim using Amazon
Mechanical Turk. Amazon Mechanical Turk data are generalizable to American internet users
and have been found to be as reliable as data from other sources [28, 29].
Key Variables and Measures. The survey will have screening questions, a “before
exposure” section, exposure to one of two posters, and an “after exposure” section.
I measured current contraceptive use by asking women before exposure to a poster what
method they used in the past three months. All other outcome variables are measured before and
after exposure. Contraceptive knowledge was measured using the validated, 25-question
Contraceptive Knowledge Assessment [30]. We measured contraceptive intentions by asking
would be willing to use if they had to switch methods in the next year. To measure accuracy of
pregnancy risk perception, women were asked whether their chances of getting pregnant this
year were very high to very low, and this response was compared to their true risk based on their
current contraceptive method.
Before exposure I asked whether the woman had ever had a pregnancy scare and I
measured numeracy using the Berlin Single-Item Numeracy scale [31]. I used standard questions
from the National Survey of Family Growth and the National Longitudinal Study of Adolescent
to Adult Health to measure potentially confounding variables (see Chapter 4).
Analysis. First, we used two-sample t-tests and likelihood-ratio tests to test whether the
confounding variables were balanced between the two randomized groups. Because there were
no significant differences between the groups, we did not control for these variables. We also
presented information on the distribution of similar covariates in a nationally representative
sample: the 2013-2015 National Survey of Family Growth. We then tested whether each poster
improved the three outcomes relative to baseline and relative to the other poster using
two-sample t-tests on the change in the mean score for each outcome. Finally, we tested the same
hypotheses in the three subgroups: women with prior pregnancy scares, low numeracy, or no
current contraceptive method.
Limitations. A limitation of this study is the lack of follow-up data on women’s
contraceptive usage. However, this project is intended as a pilot study to assess the potential of
Aim 3
Introduction This aim’s objective was to estimate the cost-effectiveness of using the
CDC and patient-centered posters to prevent unplanned pregnancies compared to the status quo.
I tested the working hypothesis that exposure to the patient-centered poster would
cost-effectively prevent unintended pregnancies compared to the CDC poster and the status quo. My
approach was to use two Markov models comparing the costs and benefits associated with
contraceptive choices made after exposure to either poster or the status quo. The first Markov
model did not simulate contraceptive switching and discontinuation, making the assumption that
the population-level contraceptive mix is relatively stable. The second model did simulate
contraceptive switching and discontinuation. The rationale for this study was to produce a
business case for using these contraceptive education posters. The expected outcome was
cost-effectiveness estimates for each poster.
Procedures. I built two Markov models in TreeAge Pro Healthcare that simulated the
behavior of a hypothetical cohort of women who do not intend to conceive and are of
reproductive age. Input probabilities and costs for this model were sourced from a literature
review and Aim 2 primary data.
Key Variables and Measures. The health outcomes for this model were number of
unplanned pregnancies averted and quality-adjusted life years. Women chose a contraceptive
method using the distribution in preferences observed after being exposed to each poster or at
baseline (for the status quo) in Aim 2. After choosing a method, women could experience one of
four possible method failures or no failure that year. In the switching model, women could
choose to switch to a new contraceptive method at the end of the year. This cycle repeated for
five years. We chose this time horizon because long-acting contraceptive methods have high
dollars. I incorporated costs associated with method failures, contraceptive methods, and visit(s)
for obtaining the method.
Analysis. I calculated incremental cost-effectiveness ratios for unplanned pregnancies
averted and quality-adjusted life years, as well as a cost-effectiveness acceptability curve
[32-34]. I will quantify uncertainty using a probabilistic sensitivity analysis [33] and a bivariate
sensitivity analysis varying the implementation costs and effectiveness of the posters.
Limitations. Because Aim 2 only collected contraceptive intentions rather than behavior,
this study assumes that women’s intentions are acted on perfectly. The results are also only
generalizable to the same population that the Aim 2 results are generalizable to; this likely means
the internet-using population of women aged 18-44.
Summary of Contributions
The findings from this research provide evidence to enhance CDC’s 2014 Quality Family
Planning recommendations regarding contraceptive counseling using contraceptive posters. This
project also tested several novel ways of communicating probabilistic risk. This research is
important because to achieve the Healthy People 2020 goal of reducing the number of unplanned
pregnancies in the US, every aspect of our contraceptive counseling must help women choose
contraception that is in accordance with their reproductive goals. We can educate women while
preserving their right to choose the contraceptive method of their choice using simple,
CHAPTER 2: LITERATURE REVIEW Overview
The goal of this dissertation is to refine and pilot test a new, patient-centered
contraceptive effectiveness educational poster and compare it to a poster created by the CDC.
This dissertation is needed because the CDC poster does not include information to address
common misconceptions about pregnancy risk and contraceptive effectiveness. These
misconceptions increase the likelihood that women will have unprotected sex [19, 23, 35-38].
This chapter will review the literature on the prevalence, sources, and consequences of these
misconceptions about pregnancy risk and contraceptive effectiveness. It will also give an
overview of the currently available contraceptive posters and decision aids, as well as previous studies of the posters’ ability to change women’s misconceptions and improve women’s
contraceptive behavior.
Prevalence of Pregnancy Risk Misconceptions
I define a pregnancy risk misconception to mean underestimating the risk of pregnancy
with unprotected sex. A subtype of this misconception is perceived infertility: when a person
wrongly thinks they cannot conceive. CDC reports that in 2013 about 6.1% of married women in
the United States are infertile, meaning they are unable get pregnant after at least 12 months of
unprotected sex [39]. However, many more than 6% of women believe that they might be
infertile or underestimate the risk of pregnancy with unprotected sex. Between 14.6%-21.5% of
women aged 15-29 have reported thinking that it is very likely that they are infertile on both
that I conducted using an Amazon Mechanical Turk survey of N = 242 women aged 18-44 found
that 55% of these women thought that it was at least slightly likely that they were infertile.
Misconceptions about the general likelihood of conceiving with unprotected sex are
similarly common. In a national survey of 1,392 women with no history of abortion recruited at
family planning clinics, 91% inaccurately estimated the risk of conception from having
unprotected sex once, and 25% underestimated the probability of pregnancy associated with a
year of unprotected sex by >15 percentage points [8]. A second study conducted through the
Contraceptive CHOICE project found that 14% of women thought that the annual chance of
pregnancy without contraception was <10% (an underestimate of at least 75 percentage points)
[42]. Finally, public and private health care providers rank “underestimating pregnancy risk” as
the second most prevalent problem among contraceptive clients [43]. In summary, at least twice
as many women believe they are infertile as actually are infertile, and 14-25% of women
dramatically underestimate the risk of pregnancy associated with a year of unprotected sex.
Prevalence of Contraceptive Effectiveness Misconceptions
I define contraceptive effectiveness misconception to mean underestimating the
effectiveness of contraception. For reference, the CDC categorizes contraceptive methods into
three categories based on effectiveness: very effective methods have an annual risk of pregnancy
0-1%, effective methods have an annual risk of 2-9%, and somewhat effective methods have an
annual risk of 10-30% [7]. Very effective methods include IUDs, implants, the hormonal shot,
and surgical sterilization. Effective methods include birth control pills, the patch, and the ring.
Somewhat effective methods include condoms, spermicide, and natural methods like withdrawal
and fertility awareness.
18-29, 40% of women believe that the chance of getting pregnant within a year while using the birth
control pill is 50% or greater (true probability: 2-9%) [41]. This lack of knowledge does not
translate into a lack of confidence: in the same study, 90% of these young adults felt that they
had all of the information they needed to protect themselves from pregnancy [41]. In a national
survey of 1,392 women with no history of abortion recruited at family planning clinics, only
26% of women correctly assessed the effectiveness of condoms, 61% for the effectiveness of
OCs, and 56% for IUDs [8]. In a study of 433 reproductive-age US women, 70% of participants
overestimated the risk of pregnancy with a very effective method by five percentage points, and
40% and 41% overestimated the risk of pregnancy with very effective and effective methods
(respectively) by 15 percentage points or more [7]. Finally, a nationally representative survey of
623 unmarried 18-29 year old women who were at risk of unintended pregnancy found that only 50% of them received a grade of “A or B” on a contraceptive knowledge quiz, and 60% of them
underestimated the effectiveness of the pill [23]. In summary, these studies suggest that at most
half of women can accurately estimate the effectiveness of various contraceptive methods,
despite the fact that more than 99% of sexually active women of reproductive age have used at
least one method of contraception [44].
Sources of Misconceptions
Studies have identified several sources of misconceptions about pregnancy risk and
contraceptive effectiveness: a history of unprotected sex without pregnancy, alarmist sex
education, poor communication with doctors, personal experience with contraceptive failures,
and contraceptive failures among friends or family.
The first reason that a woman might believe she is infertile or has a low risk of
pregnancy is having a history of unprotected sex without conception. In a sample of 300 teen
result ever thought they were infertile, compared to 6% of girls who had never had a pregnancy
test (OR 3.23, 95% CI: 1.14-9.19) [37]. A second study of 32 women split into 4 focus groups
found that women cited a history of unprotected sex without pregnancy to justify misconceptions
about pregnancy risk [6]. Finally, qualitative interviews with 51 unmarried from two Bay Area
community colleges found that when a woman had a history of unprotected sex without
pregnancy, she believed that meant that she was unlikely to ever get pregnant [5]. In particular,
women attributed this reasoning to sex education messages warning that pregnancy is the
inevitable result of even one unprotected sexual encounter [5].
The second source of misconceptions about pregnancy risk is miscommunication with a
doctor. The Fog Zone study found that 25% of the young women who believed they were
infertile said that a doctor had told them so [41]. In a large qualitative study of women who
received abortions at one California clinic, one researcher found that two-thirds of the women
she interviewed said that a doctor had told them they could not get pregnant or would have
trouble getting pregnant [45]. Since all of these women had received abortions, and thus were not
infertile, further questioning often revealed that doctors had either told women with reproductive
organs that vary from the norm that they “may have trouble conceiving”, or had taken women off
of their hormonal contraceptive methods in order to test their fertility [45]. Miscommunication
by doctors resulting in increased risk of unplanned pregnancy did not end in the 1970s: 49% of
abortion patients in a 2003 study reported undesirable provider behaviors like being taken off of
oral contraceptives without being given a backup method [46]. Providers who unduly worry
women about potential infertility, or put women at risk of an unplanned pregnancy to test a woman’s fertility, increase the chances that women will suffer from misconceptions about her
Finally, misconceptions about contraceptive effectiveness can be attributed to how
memorable method failures are. In a study of 32 women split into 4 focus groups, women cited
anecdotal or personal experience with method failures to justify their misconceptions about
contraceptive effectiveness [6].
In conclusion, misconceptions about pregnancy risk are likely attributable to a history of
unprotected sex without pregnancy, alarmist sex education, and poor communication with
doctors. Misconceptions about contraceptive effectiveness are attributable to personal
experience with contraceptive failures or similar anecdotes from friends.
Consequences of Misconceptions
Misconceptions about pregnancy risk and contraception affect women’s behavior. Many
studies confirm that when women are unlikely to use contraception if they think they are unlikely
to get pregnant from engaging in unprotected sex. Women who think they are unlikely to get
pregnant are 1.5-3 times as likely as other women to have unprotected sex, even when
controlling for baseline unprotected sex, demographic factors, and psychological factors [19,
35-38]. Women report in qualitative studies that one reason they choose to have unprotected sex is
because of perceived infertility [6, 45]. Finally, one of the most frequently cited (40-44% of
cases) reasons for having unprotected sex in both pregnant teens [47-50] and adult women with
unplanned pregnancies [21, 50, 51] is perceived infertility. Furthermore, one study using
Pregnancy Risk Assessment Monitoring System data from 7,856 women found that 66% of
women only endorse one reason for having unprotected sex, and latent class analysis confirmed
this finding. This suggests that misconceptions about pregnancy risk are all that is needed for a
woman to engage in unprotected sex [51].
Women who underestimate the effectiveness of contraception are also less likely to use
623 unmarried 18-29 year old women who were at risk of unintended pregnancy found that as
their objectively-assessed contraceptive knowledge increased, the women were significantly
more likely to use effective or highly effective birth control methods (17% increase in likelihood
for each correct answer, p<0.01) [23]. These authors found the same association between
knowledge and reported likelihood of having unprotected sex in the next three months (9%
reduction in odds for each correct response, p<0.05) [23]. Finally, a study of unmarried women
found that those who know less about the relative effectiveness of different contraceptive
methods are less likely to use contraception [52]. However, one study which predicted previous
unprotected intercourse found that the effect of underestimating the effectiveness of
contraception was no longer significant after controlling for underestimating the risk of
pregnancy, age, race, education, and perceived ease of access to birth control [19].
In conclusion, women who underestimate the risk of pregnancy with unprotected sex are
much less likely to use contraception and there is some evidence that women who underestimate
the effectiveness of contraception are also less likely to use contraception.
Contraceptive Effectiveness Posters
Because of the connection between contraceptive knowledge and pregnancy prevention
behavior, the public health community has long tried to educate women about contraception. The
CDC has recommended that every contact between women and a health care provider become an
opportunity for education and reproductive life planning [9]. The CDC also recommends using
contraceptive effectiveness educational tools, such as the CDC poster, during these contacts [9].
However, while posters explaining the effectiveness of contraception are available online, we
were not able to identify any scientific evaluations of the effectiveness of these posters, nor were
On the other hand, several charts designed to communicate the relative effectiveness of
different contraceptive methods, including a chart that seems to be the basis for the CDC poster,
were evaluated in a previous study [7]. These charts include the FDA chart [53], the “categories”
chart created by a group of contraceptive effectiveness researchers [7], and a chart similar to the
CDC poster [54]. The FDA chart presents typical and perfect use rates for each method of contraception and no method in a table without any graphics. The “categories” chart [7] does not
include typical or perfect use rates, but instead categorizes each method using the WHO
categories of effectiveness and whether the method provides protection against STIs. The chart
similar to the CDC poster combines the typical and perfect use rates with more general
information about the broader effectiveness category that each contraceptive method falls into. It
does not include the risk of pregnancy without a contraceptive method.
Previous Studies on Effectiveness of Counseling Posters
Each of these charts has strengths and weaknesses in terms of the information they
include and the misconceptions they perpetuate. The three charts discussed previously (FDA, “categories”, and CDC) do not provide all of the information that a woman might need to make a
decision about which contraceptive method to use; instead, they complement the information that a practitioner can provide in response to a woman’s needs and questions. A randomized trial
conducted by Steiner et al. compared the side-by-side performances of these three charts in a
sample of 433 women (age 18-44) recruited at five shopping malls around the US (2003). This
trial found that the posters presenting pregnancy risk information numerically (FDA, CDC)
increased the percent of participants who could correctly rank the pill and condoms or pill and
hormone shot in terms of effectiveness by 14-20 percentage points [7]. On the other hand, the “categories” sheet poster did an even better job of improving participants’ ability to rank
points [7]. However, while the FDA and CDC charts appear to have improved women’s ability
to report failure rates for the contraceptive pill from 59 to 67%, the authors do not report whether
the improvement was significant [7]. Furthermore, the “categories” chart demonstrated no
improvement in misconceptions about contraceptive effectiveness [7]. In conclusion, all three charts improved women’s ability to rank methods in terms of effectiveness. However, if we want
to educate women about actual contraceptive failure rates, then we cannot use “categories of
effectiveness” alone, but must also provide numerical estimates of effectiveness.
These results are supported by more general research on communicating risk information
numerically. Humans, even those with some statistical training, have a number of biases when
presented with probabilistic risk information. Cumulative probabilities are particularly
problematic: when people are presented with a one-year probability of failure (as is the case in
the FDA and CDC posters), they are unable to accurately predict how this translates to failure
probabilities over longer periods of time [18]. Almost half of us do not predict that cumulative
failure probabilities will increase over time [18]. The rest predict failure rates over time that
increase too slowly and do not show large enough differences between contraceptive methods of
different failure rates [18]. In short, even if women could accurately estimate the one-year failure
rates for different methods of contraception, they would still be overly optimistic about
contraceptive failure rates over multiple years and pessimistic about them over the very short
term.
All contraceptive posters have to fight against women’s widespread misconceptions
about the baseline probability of pregnancy. Only the FDA chart includes the estimated risk of
is a clearer risk factor for contraceptive non-use than contraceptive effectiveness
misconceptions.
Current research suggests many ways to improve counseling posters:
• The poster should present risk information non-probabilistically [18, 56].
• The poster should include the risk of pregnancy with no contraceptive method.
• The poster should also use visual cues to indicate the relative effectiveness of
methods, since people tend to remember visual cues, not numbers [57, 58].
• The poster should include categories of effectiveness, but not rely on only categories
to communicate contraceptive failure rates [7].
• The poster should present failure rates over longer lengths of time, since most women
will use contraception for decades of their lives [18].
• Finally, the poster should help a woman place herself into the “high risk of
pregnancy” category or the “low risk of pregnancy” category; people’s preventive
behavior is linked to whether they perceive themselves to be at low or high risk
relative to other people [22, 58].
Contraceptive counseling posters should be redesigned using the wealth of evidence available
about how to best communication risk information.
Finally, it is not a lost cause to rely on simple interventions like a poster to educate
women about contraception and pregnancy. A systematic review of contraceptive education
interventions found 21 interventions, of which nine used written materials/decision aids in either
provider independent or enhanced settings [56]. Of these, six had a positive impact on
education materials on actual contraceptive behavior found that compliance with oral
contraceptive pill taking was increased [59]. In conclusion, written educational materials can
CHAPTER 3: COGNITIVE INTERVIEWS TO IMPROVE A PATIENT-CENTERED CONTRACEPTIVE EFFECTIVENESS POSTER
Overview
Objectives: To refine by qualitatively comparing a patient-centered contraceptive
effectiveness poster to a Centers for Disease Control and Prevention (CDC) poster based on
comprehension, relevance, acceptability, design, and overall preference.
Study Design: We conducted cognitive interviews with 26 women aged 18-44 living in
North Carolina who spoke and read English and had ever had sex. We interviewed women about
both a CDC and a patient-centered poster in alternating order. Participants were contraceptive
users and non-users that we selected purposively to have a range of characteristics that might
influence their perspective: age, race/ethnicity, previous births and pregnancies, contraceptive
method(s) used in the past three months, pregnancy intentions, and numeracy. The initial
response rate for participants was 55%. We coded the interviews for comprehension, relevance,
and acceptability as defined in cognitive theory, as well as design and overall preference. We
structured the 26 interviews into four rounds and revised the patient-centered poster after each
round to improve these measures.
Results: By the final round, 83% of women preferred the patient-centered poster overall,
and it was preferred by the majority of women in terms of comprehension (86%), relevance
(86%), and design (100%). Women raised few concerns about the acceptability of the final
version of the patient-centered poster. Women identified many issues with both posters that the
researchers did not anticipate, highlighting the value of patient-centered design approaches to
Conclusions: This study refined a patient-centered poster so that its language is clear and
it addresses the informational needs of its target audience.
Implications: The Centers for Disease Control and Prevention and the Office of
Population Affairs recommend that clinicians educate women about contraception. This study
developed a poster that could help clinicians follow this recommendation. Before widespread implementation, more research is needed to evaluate the poster’s impact on contraceptive
knowledge and behaviors.
Introduction
A Cochrane review of the effect of decision aids on helping people make health treatment
and screening decisions found that decision aids like posters can improve knowledge and
decision-making [9, 63]. A second systematic review of contraceptive education interventions,
such as written materials, found that the majority improve contraceptive knowledge, and many
can also significantly increase comfort with the decision making process and improve
contraceptive intentions [56]. Some interventions have also demonstrated impacts on
contraceptive use and pregnancy outcomes [56]. The Centers for Disease Control and Prevention
(CDC) adapted an existing [7] contraceptive education poster (Figure 3.1) to help providers
adhere to the CDC/Office of Population Affairs (OPA) recommendation that reproductive health
counseling include contraceptive education [9]. However, while posters such as the CDC’s are
thoughtfully developed and scientifically accurate, they may not be designed with patients’ input,
as is recommended by the CDC and OPA [17]. When we involve patients in design, it helps
make educational materials understandable [64], especially for the half of Americans with low
health literacy [65]. Making health materials understandable is both a national priority, according
to the Institute of Medicine [65], and important in sexual education specifically [17] because low
used cognitive interviews to design a patient-centered poster that educates women about
contraceptive effectiveness and their risk of pregnancy with unprotected sex; we tested this poster against the CDC’s contraceptive effectiveness poster.
Figure 3.1 CDC-adapted Contraceptive Effectiveness Poster Material and Methods
Participants
We conducted in-person cognitive interviews with 26 women in four unequal-sized
waves (N=4, 7, 8, and 7). Women were age 18-44, had ever had vaginal intercourse, and were
able to speak and read English. We recruited women through a Family Medicine clinic, a
recruit women with a range of characteristics that might influence their perspective on
comprehension, relevance, and acceptability. These characteristics were age, race/ethnicity,
previous births and pregnancies, contraceptive method(s) used in the past three months,
motivation to avoid pregnancy, and numeracy (Berlin single item scale [31]). We did not provide
compensation for participation. The University of North Carolina at Chapel Hill institutional
review board approved this study (IRB #17-1246).
Cognitive Interviewing Procedure
Cognitive interviewing is a method for studying how people process and feel about
written and graphical materials [25]. It is iterative, with rounds of interviews followed by
refinements to the material being tested [25]. Cognitive interviewing has been used to test
comprehension of educational materials [68-70] and contraceptive information [26].
We presented the posters in alternating order by interview. We used the combined method of cognitive interviewing, which begins with the participant “thinking-aloud” [27] as
they process a poster, and then exploring their cognitive processing further in a structured
interview [27, 71].
Measures
We measured comprehension, relevance, and acceptability, the three key components of cognitive processing identified by Tourangeau’s cognitive theory [72] as adapted by Vreeman
and Choi [73, 74]. We also measured design and preference.
Comprehension is a measure with two constructs: (1) intent, whether the respondent
understands the information presented, and (2) meaning, whether the respondent understands the
specific words and phrases used. We assessed intent by probing whether participants could use
the poster to correctly answer questions about contraception. We assessed meaning by probing
Relevance (Tourangeau’s “response mapping”) is a measure of whether the information
applies to the respondent. We assessed relevance by probing whether the participant found the
information on the poster useful.
Acceptability (Tourangeau’s “sensitivity”) is a measure of whether the information seems
truthful and inoffensive. We assessed acceptability by probing whether anything on the poster
offended the participant and whether she believed the information on the poster.
Design was assessed by asking the participant to identify missing or extraneous information and propose changes to the poster’s appearance.
Preference was assessed by asking the participant to select which poster she preferred in
terms of comprehension, relevance, design, and overall.
Analysis
We audio-recorded and transcribed each interview and developed a framework to code
the interviews for our measures. Using NVivo 11, after each wave one interviewer (SA) coded
all and a second researcher (MB) coded half of the interviews described. The kappa agreement
scores for the two coders were 0.77 (range 0.41-0.94) for comprehension, 0.76 (0.44-0.99) for
relevance, 0.77 (0.24-0.97) for acceptability, and 0.76 for design (0.55-0.89). The coders
resolved discrepancies through discussion. We created an overview report for each poster
documenting issues, the number of women mentioning an issue, and the number of mentions.
After each round, we used the overview to revise the patient-centered poster. Our saturation
criterion for each round was when an interview produced no new suggestions warranting serious
modifications to the poster.
Derivation of Contraceptive Effectiveness Measures
The CDC poster expresses contraceptive effectiveness using the annual failure rate with
the theoretical average time-to-pregnancy for each contraceptive method. We derived these from
the annual failure rates using the binomial probability function to solve for the time at which
there is a 50% probability of at least one pregnancy having occurred. This measure estimates the
average time women might expect to use a contraceptive method before they have an unplanned
pregnancy, similar to how flood risks are commonly expressed [75]. This measure assumes that
failure rates are constant over time, which may not be the case. Later versions of the poster used a “times more effective” measure of contraceptive effectiveness, which is calculated by dividing
the probability of pregnancy for unprotected sex by the failure probabilities for each method.
This measures gives how many times more effective at pregnancy prevention a contraceptive
method is compared to having unprotected sex
Results
Of the 62 eligible women we invited to participate, 34 (55%) agreed, and 26 (42%) were
interviewed before we reached saturation. Table 3.1 provides descriptive statistics for
participating women on key characteristics. In general, the study sample was less likely to have
children than US women generally, more likely to use highly effective methods of contraception,
and less likely to be in the top 50% of the population for numeracy. The majority of women were
Table 3.1 Characteristics of Interviewed Women by Interview Round Round 1 (N=4) Round 2 (N=7) Round 3 (N=8) Round 4 (N=7) Total (N=26)
Average Age (Years) 30.5 30.7 29.1 27.9 29.3
Race/Ethnicity
White Black Asian
American Indian/Alaskan Native 3 1 0 0 4 2 1 0 4 3 1 0 4 0 2 1 15 6 4 1 Any Children Yes No 2 2 2 5 3 5 2 5 9 17 Ever Pregnant Yes No 2 2 2 5 4 4 2 5 10 16
Method(s) Used in Past 3 Months
Vasectomy Sterilization IUD Implant Injectable Pills Patch Ring Male Condom Withdrawal Diaphragm Sponge Spermicide Other No Method 0 0 2 1 0 3 1 0 3 0 0 0 0 0 0 1 1 1 0 0 4 0 0 3 2 0 0 0 0 0 0 1 3 0 1 4 2 1 4 2 0 0 0 1 1 0 0 4 0 0 4 0 0 5 3 0 0 1 0 0 1 2 10 1 1 15 3 1 15 7 0 0 1 1 1 Pregnancy Intentions
Trying to avoid pregnancy Ambivalent
Trying to get pregnant Don’t know 2 1 0 1 5 1 0 1 5 0 2 1 5 1 1 0 17 3 3 3 Numeracy Top 50% Bottom 50% 1 3 4 3 4 4 2 5 11 15
Round 1 identified simple mistakes in the patient-centered poster, leading us to reach saturation
quickly (N=4). In the other rounds, we reached saturation within 5-10 interviews, as is typical in
cognitive interviewing studies [27]. In Round 4, participants made few suggestions for changes
patient-centered poster overall, leading us to conclude the study. Tables 3.2 and 3.3 show
abbreviated versions of the overview report for each poster by round. Figure 3.2 shows the final
31
Table 3.2 Abbreviated Overview Report for the CDC Poster by Domain
Round 1 (N=4) 2 (N=7) 3 (N=8) 4 (N=7) Total (N=26)
How Addressed by Patient-Centered Poster?
Problem n* n* n* n*
n* (% of N) COMPREHENSION: Information and words/phrases on the poster are clear
Clinical terms (LAM, LNG IUD, nulli/parous, methods’ clinical names) are unclear.
1 7 7 6 16 (62%) All removed and replaced with
suggested non-clinical terms. Asterisk is not seen before the percentages, making the
percentages confusing.
3 2 5 2 12 (46%) Percentage legend added at the top of the
column.
“Typical use" is unclear. 3 4 3 2 12 (46%) Term not used.
Pictures unclear for some methods. 2 2 4 2 10 (38%) Suggested change.
"Permanent" is confusing when there is a small risk of pregnancy.
1 1 2 (8%) “Surgical” used instead.
RELEVANCE: Information on poster applies to the participant and is useful for her
Missing how each method works and how long it lasts. 4 5 7 7 23 (88%) Added information.
Missing side effects/contraindications. 1 2 3 5 11 (42%) Suggests 2nd poster.
Women only interested in methods that are commonly used, relatively effective, and easy to obtain.
2 4 3 9 (35%) Only shows commonly used methods.
"Family Planning" not inclusive and not equivalent to "birth control.”
3 2 2 7 (27%) “Birth control” used.
Missing unprotected sex. 1 4 1 6 (23%) Added this information.
ACCEPTABILITY: Information on poster seems truthful and inoffensive
Withdrawal picture is confusing or offensive. 1 3 4 2 10 (38%) New withdrawal image.
Pictures of sterilization offensive. 1 1 2 4 (15%) Suggested change.
Add number to call or website.
1 1 2 4 (15%) Suggested change for sponsored projects
with sponsor.
Add "Talk to your doctor.” 1 2 1 4 (15%) Added.
Picture of injectable is off-putting. 1 1 2 (8%) Removed needle.
DESIGN: Poster is attractive and well-organized
No color. 3 6 6 7 22 (85%) In color.
Too much text/"looks" like a lot of text. 3 5 2 1 11 (42%) Text is in separate column.
Not enough of a visual emphasis on STI prevention. 2 3 4 2 11 (42%) Bolded and in main text.
Titles and headers are not noticed first. 1 3 3 2 9 (35%) Title is in large font.
The order in which the information on the sheet should be read is unclear/Some information would not be read.
1 3 2 3 9 (35%) Order to read information is signaled in
design and color.
32
Table 3.3 Abbreviated Overview Report for Patient-Centered Poster by Domain
Round 1 (N = 4) Round 2 (N = 7) Round 3 (N = 8) Round 4 (N = 7)
Problem n* Change n* Change n* Change n* Change
COMPREHENSION: Information and words/phrases on the poster are clear
Pregnancy risk measure confusing. 4
Title
changed. 7
Added first-year failure
percentages. 5
Replaced with "times
better" scale. 3
No change; more prefer alternative.
Pictures unclear for some methods. 2 No change. 2 No change. 4 No change. 2 Suggested change.
Unclear what colors convey. 2
"No method" in different
color from other methods. 2
Tried to reduce number
of colors and intensity. 1
Surgical methods now same color.
Unclear what numbers mean. 2 Added explanation. 6 Header added.
Unclear reference/scale for arrow. 2
Added time for most
effective. 4
Switched scale label to “times more effective”.
RELEVANCE: Information on poster applies to the participant and is useful for her
Missing how each method works and
how long it lasts. 2 No change. 5
Done for all but least
effective methods. 4
Added information on
least effective methods. 3 Updated IUD information.
Missing side effects/contraindications. 1 No change. 3 No change. 3 No change. 5 Suggests 2nd poster.
Missing brand names. 1 No change. 2 Added. 2 Added.
Women only interested in methods that are commonly used, relatively
effective, and easy to obtain. 1
Retained all contraceptive
options from CDC poster. 4
Removed sponge, spermicide, and female
condom. 1 Removed diaphragm.
Missing LAM information. 1 More prefer removal. 1 More prefer removal. 1 More prefer removal.
ACCEPTABILITY: Information on poster seems truthful and inoffensive
Feels less believable due to no logo,
short citation, or poor design. 3
Added logo
and citation. 3 Revised design. 1 No space for long citation.
“Advertising” most effective methods. 1 No change. 3 No red, yellow, green. 1 All methods in one color.
Add "Talk to your doctor.” 1 No change. 2 No change. 1 Done.
Pictures of sterilization offensive. 1 No change. 1 No change. 2 Suggested change.
Add number to call or website. 1 No change. 1 No change. 2 Suggested change.
DESIGN: Poster is attractive and well-organized
The order in which the sheet should be
read is unclear/sheet is crowded. 3
Decreased font size in
order of importance. 7
New layout. Fewer
numbers. 1
Removed diaphragm and technical names.
More visual weight on STI prevention. 1 No change. 4 Bolded STI box. 3 Bolded in text.
Titles and headers are not noticed first. 2 No change. 2 Larger title font. 1 Headers added in blue.
More emphasis on surgical methods. 3 Retained box. 4 Separated methods.
Too much text. 1 No change. 4 Removed surgical text.
Figure 3.2 Final Iteration of the Patient-Centered Contraceptive Effectiveness Poster In the interviews, the CDC logo was used in the Logo Space to ensure that the two posters were comparable. Recent research suggests that some long-acting reversible methods can be used for longer than they were initially approved for in some groups of women [76]; however, we use lengths of time for which these devices were approved for use by the U.S. Food and Drug Administration.
What Are My Birth Control Options?
Least Effective
HORMONAL METHODS
Injectable
6% Pill 9% Patch 9%
Ring 9%
SUN MON TUES WED THUR FRI SAT
1 2 3 4
Most
Effective Talk to your doctor to find a method of birth control that works best for you.
These estimates are based on each birth control method’s observed effectiveness in the population, including couples using their method inconsistently or incorrectly.
Information from CDC and Trussell J. Contraceptive failure in the United States. Contraception 2011;83:397-404.
Unprotected Sex 85%
Use emergency contraception after unprotected sex to lower
your pregnancy risk.
Use within:
NON-HORMONAL METHODS
Condom
18% Withdrawal 22% Fertility Tracking 24%
Always use condoms to prevent STIs.
LONG-LASTING METHODS
IUD 0.2% (hormonal)
0.8% (non-hormonal)
Implant 0.05%
Get inserted by doctor into arm (implant) or uterus (IUD).
Lasts up to:
SURGICAL METHODS
Vasectomy Having Tubes Tied
0.15% 0.5%
Implant
(Nexplanon®)!
3 years!
Hormonal IUD
(Mirena®, Skyla®, Liletta®, Kyleena®)!
3-5 years!
Non-Hormonal IUD
(Paragard®) 10 years
Vasectomy Permanent
Having Tubes Tied Permanent
Injectable
(Depo-Provera®)!
Injected by doctor every 3 months!
Pill! Take at the same time daily!
Ring
(NuvaRing®) Replace in vagina monthly!
Patch! Replace sticker weekly
10 times more effective 5 times more effective Unprotected Sex
150
times more effectiveCondom! Use during sex!
Withdrawal! Ejaculate outside
woman
Fertility Tracking!
Abstain on fertile days!
NO BIRTH CONTROL
Ella® Pill! 5 days!
Morning-After Pill (over-the-counter)!
3 days!
Comprehension
Technical language was the most common issue with comprehension. Women often did
not know the meanings of lactational amenorrhea (62%), parous/nulliparous (54%), typical use
(46%), the LNG IUD (23%), and hysteroscopic/laparascopic/abdominal sterilization (19%). As
one woman said:
I think that some of it can read jargony. So it could be unapproachable. Not necessarily lying, but that it’s just too much.
Women often assumed that the information was not relevant to them if they did not
understand a word, and few asked for clarification. This finding led us to incorporate women’s
preferred terminology into the patient-centered poster. For example, women suggested adding brand names and using “having tubes tied” instead of “female sterilization.” As one woman said:
[The poster] broke down the names, the actual names that the doctor will usually use… When you're not in the medical profession, and you say, “Can I get the injectable?” and the doctor says, “Depo,” and you're like, “Is that same thing?”… You feel a distance between who you're talking to. You want to feel the same. You don't want to feel as though the doctor is superior.
When the poster used women’s terminology it not only reduced confusion, but also
increased the relevance of the information.
Another consistent comprehension problem was confusion about the patient-centered poster’s average time-to-pregnancy measure. Women found it difficult to understand because it
was unfamiliar and not how they thought about risk.
I think about birth control in a very immediate way. So it's kind of hard to pick [a contraceptive method] out in terms of, 10 years, when would I want an unplanned pregnancy? That I find a little confusing when I think about this.
As a result, in the fourth round we transitioned to contextualizing the percent failure rate with a “times more effective” scale. Women preferred this scale to the CDC’s use of a percent
five women with low numeracy in the fourth round, three preferred the “times more effective”
scale, and one did not prefer either scale. In the final round, six out of seven women interviewed
said the patient-centered poster was easier to understand than the CDC poster.
Relevance
An unexpected finding was that 27% of women felt the term “family planning” excluded
single women or that it did not reflect their attitude when they chose contraception. One younger
woman said:
I don't think it should be "family planning" unless it was maybe for a couple. Women preferred “birth control” or “contraception,” so we use these in the
patient-centered poster.
To increase relevance, 35% of women suggested removing uncommonly used methods
from the poster. One woman observed:
I don't think I have ever met anybody who uses a sponge or a diaphragm.
In the final poster, we removed methods used by less than 0.2% of contraceptive users:
the female condom, diaphragm, sponge, and spermicide [77].
When the poster provided information relevant to women’s options, it increased women’s
perceived ability to process their contraceptive choices. As one woman said in Round 3:
[The patient-centered poster] is just more useful to me because it gives me more of what I need in terms of being able to make a decision about birth control. How often do I have to take it? What's the length of time that it will be effective for me in terms of not getting pregnant? ... Does it have hormones? … And how it's used. So I think that information is presented here in a much easier digestible frame. It's easier for me to understand.
In each round, an increasing proportion of women said the patient-centered poster
provided more relevant information than the CDC poster. By the final round, six out of seven