Gender Differences in the Long-Haul Trucking Industry Related to Worker Health Perception - A Pilot Study
by Diane M. Layne
A Master's Paper submitted to the faculty of the University ofNorth Carolina at Chapel Hill
in partial fulfillment of the requirements for the degree of Master of Public Health
in the Public Health Leadership Program.
2007
ABSTRACT
Over 3. million long-haul truck drivers transport goods across the United States and truck driving is listed as the nation's third largest growth occupation (US. Bureau ofLabor Statistics, 2004). Over 360,000 women now make up a part of this traditionally male dominated profession, and the number of women employed in the trucking industry is growing daily (U.S. Bureau of Labor Statistics, 2004). Long-haul truck drivers who are gone from home at least one overnight each week makes up a unique subset of this occupation.
Long-haul trucking has been found to be associated with a number of medical problems including musculoskeletal disease, sleep disorders,
hypertension and cardiovascular disease, obesity and gastrointestinal disease, substance abuse and alcoholism, various types of cancer and reproductive issues (Solomon, Doucette, Garland, & McGinn, 2004). These health risks are often attributed to lifestyle, work environment including unpredictable work hours and geographical locale, along with lack of health insurance, and occupational exposures (Solomon et a!., 2004). Increased health risks and transience are, therefore, characteristics long-distance truck drivers share with other vulnerable populations (Solomon eta!., 2004). As the long-haul trucking workforce
attempts to take care of their chronic, acute or preventable health problems (Solomon et al., 2004).
As the truckers' workplace is the community, the health of this population is of special interest. This descriptive pilot study of 25 male and 25 female truck drivers was conducted to identify health conditions and limited health care access of male and female long-haul truck drivers to ascertain if gender differences do exist in this population. Data indicate that 54% of males and 66% of females had a usual place of health care with only 21% of males and 35% offemales,
respectively, reporting no health insurance coverage. Both male and female drivers reported common health problems like back pain, sinus problems,
ACKNOWLEDGEMENTS
I would like to thank my advisor Dr. Bonnie Rogers for her patience and understanding as she guided me through this process.
I would like to thank Judy Ostendorf and Susan Randolph for their inspiration and encouragement. I would also like to acknowledge the valuable insight and assistance provided by Deborah B. Reed, RNC, PhD, and Mark Weaver.
TABLE OF CONTENTS
Abstract ... ii
Acknowledgements ... iv
Table of Contents ... v
List of Tables ... vii
List of Figures ... ix
Chapters: I. INTRODUCTION ... 1
2. LITERATURE REVIEW ... 6
Trucking Industry ... 6
Regulations ... 8
Truck Drivers ... 1 0 Morbidity and Mortality ... .11
Health Risks ... 13
Gender Specific Literature ... 16
Theoretical Framework ... 17
3. METHODS ... 22
Study Design ... 22
Study Variables ... 22
Setting ... 23
Sample ... 23
Recruitment ... 24
Instrument Development and Testing ... 24
Data Collection ... 27
Data Management and Analysis ... 29
4. FINDINGS ... 30
Background Information ... 30
Access to Medical Care ... .3 7 Trucking Experience ... 49
Health Care and Health Status ... 57
5. DISCUSSION/CONCLUSIONS ... 77
Limitations of the Study ... 86
Suggestions for Future Research ... 88
Implications for Occupational and Environmental Health Nnrses ... 89
Conclusions ... 91
REFERENCES ... 93
LIST OF TABLES
4.1: Age ... .31
4.2: Marital Status ... .32
4.3: Number of Children Under Age 18 ... 33
4.4: Education ... 35
4.5: Ethnicity ... 36
4.6: Income ... 38
4.7: Particular Facility Used for Medical Care ... 39
4.8: Reason for Not Using Medical Provider. ... .40
4.9: Usual Location for Medical Care ... .42
4.10: Type of Work-Related Injury ... .43
4.11: Reason for Not Pursuing Medical Care ... .44
4.12: Treatment for Work-Related Injury if Unable/Unwilling to Stop for Medical Care ... 46
4.13: Location of Department of Transportation (D.O.T.) Exams ... .47
4.14: Assessment of Personal Health Status ... .48
4.15: Medical Insurance ... 50
4.16: Paid Sick Leave ... 51
4.17: Employment by Type of Trucking Company ... 52
4.18: Years as Professional Truck Driver ... 54
4.19: Driving Hours Per Day ... 55
4.20: Pressure and Job Demands ... 56
4.21: Medical Concerns While On-the-Road ... 58
4.22: Type ofNon-Prescription Medication Use ... 60
4.23: Use of Over-the-Counter Medications by Condition ... 61
4.24: Diagnosed Medical Conditions ... 63
4.25: Health Problems in the Last Month ... 64
4.26: Smoking Status ... 65
4.27: Exercise Sessions per Week ... 67
4.28: Consumption ofCaffeinated Beverages ... 68
4.29: Pap Smear ... 69
LIST OF FIGURES
CHAPTER I
INTRODUCTION
There are over 3 million commercial motor vehicle operators in the United States (U.S.), representing one of the largest occupational groups in this country (U.S. Bureau of Labor Statistics, 2004). This study focuses specifically on long-haul truck drivers who are away from home overnight at least one night each week. The long-haul truck drivers of this country are frequently referred to as the last cowboys because their lifestyles reflect those of cowboys of days gone by. Similar to cowboys, truck drivers live on the road and bring their worldly belongings with them as they travel the countryside delivering goods that keep this country moving on a daily basis (Stratford, Ellerbrock, Akins, & Hall, 2000). It is this nomadic-type lifestyle that medical professionals may not understand to meet the health care needs of this large working population. In addition, truckers are often faced with irregular schedules, difficult working conditions, high-pressure jobs, and family demands, which may place them at high risk for multiple health problems. This has implications not only for the welfare of truckers who may be suffering effects of untreated medical problems such as hypertension and sleep disturbances, but also for the safety of the community-at-large with whom they share the road while operating these community-at-large vehicles.
1992 to 2002, the number of large trucks involved in fatal crashes increased by 10% due to driver fatigue, unsafe vehicle operation, large, unstable loads, or defective equipment. The Insurance Institute for Highway Safety reports that in crashes involving large trucks and other vehicles, 98% of the fatalities occur to the people in passenger vehicles (Trucking Accident Facts, n.d.).
Long-haul drivers operate trucks or vans with a capacity of at least 26,000 pounds Gross Vehicle Weight (GVW) (U.S. Bureau of Labor Statistics, 2006-07). The Federal Motor Carrier Safety Administration (FMCSA) Motor Carrier Management Information System (MCMIS) classifies a truck as large if its gross vehicle weight rating (GVWR) exceeds 10,000 pounds (Trucking Accident Facts, n.d.). Considering the average vehicle on the American road today weighs 3,500 pounds, any large truck could quickly become a moving missile if the truck driver does not have complete control of the vehicle at all times. They transport goods including cars, livestock, and other materials in liquid, loose, or packaged form, often adding additional weight creating loads weighing in excess of 80,000 pounds. Many routes are from city to city and cover long distances. Some
To drive a commercial vehicle between states, one must be 21 years of age, according to the U.S. Department of Transportation (2005c), which establishes minimum qualifications for truck drivers engaging in interstate commerce. Other qualifications are related to health, alcohol and drug use, language abilities, and previous motor vehicle accident involvement. In addition, many trucking operations have established standards higher than federal
requirements. Many firms require that drivers be at least 22 years old, able to lift heavy objects, and have driven trucks for 3 to 5 years. Many prefer to hire high school graduates and require annual physical examinations.
The trucking industry is considered a high growth industry, growing at almost 5% annually (U.S. Bureau of Labor Statistics, 2006-07). Historically, trucking has been a male-dominated occupation. However, more women are finding that a career in trucking offers many rewards and that the sacrifices and challenges are well worth the effort. This high growth rate is affecting the gender make up of the driver workforce as the number of females employed as truck drivers has risen from an estimated 513 drivers in 1970 to over 360,000 in 2006, or 4.5% of the workforce (Lembright & Riemer, 1982; U.S. Bureau of Labor Statistics, 2006-07).
According to the U.S. Bureau of Labor Statistics (2005) National
Compensation Survey, 70% of workers in private industry had access to medical insurance care plans, and 53% participated in such plans. The measure of current lack of coverage provides an estimate of persons who at any given time may experience barriers to obtaining needed health care, as well as not obtaining preventative services as well as care for illness and injury. Specific data regarding national truck driver medical insurance coverage were not available, although one recent trucker survey indicated 31% of respondents were uninsured (Solomon et al., 2004).
Driving is an extremely stressful job because of the hypervigilant state the driver must maintain for long periods (Renner, 1998). This stress can induce mental and physical fatigue, which is compounded by the drowsiness created by the monotony of the job. Drivers' prolonged stationary seated position can cause back disorders and decreased circulation of the lower extremities. The sitting position combined with the constant vibration of the truck can increase the incidence of kidney disease and herniated intervertebral discs. Demanding delivery schedules produce highly erratic work and rest schedules, which in tum creates myriad of health risks including family strife, drug abuse, stress, smoking, excess caffeine intake, sleep deprivation, and disenfranchisement from family, friends, and coworkers (Renner, 1998).
Outside the commercial driver medical fitness examination required by the U.S. Department of Transportation (2005c), little is known or understood
Trucking Industry
CHAPTER II
LITERATURE REVIEW
The total distance driven by commercial truck drivers in the U.S. exceeds 150 billion miles each year (Trucking Stats and FAQ's, n.d.). Professional drivers in the United States drove 200 billion miles in 2000. By 2004, total miles driven by all commercial truck drivers were 197 billion miles compared to 152.5 billion in 1994. A truck driver in the United States travels an average of 64,200 miles per year with the average trip for trucks about 420 miles one way. By 2008, the trucking industry will haul9.3 billion tons, approximately 64% of total U.S. freight. Eighty-seven cents of every dollar ofU.S. freight revenue in 2008 will go to the trucking industry. The majority (70%) of U.S. communities depend solely on trucking for delivery of their goods and commodities. Commercial trucking keeps this country operating on a daily basis.
This country depends on the operators of these commercial vehicles on a daily basis. There are almost 3 million commercial motor vehicle drivers in the United States (U.S. Bureau of Labor Statistics, 2006-07). Little research,
however, has been done specifically to examine the health status and health care access needs of these workers (Solomon eta!., 2004). Truck drivers are a constant presence on our Nation's highways and interstates. They deliver
goods travel most of the way by ship, train, or airplane, almost everything is carried by trucks at some point in its journey (U.S. Bureau of Labor Statistics, 2006-07). Thus, it is important to understand who makes up this occupational population, as well as their health needs.
Truck drivers can be categorized into subpopulations: local, regular route, and long-haul irregular route truck drivers (Renner, 1998). Local drivers typically return home every night and are able to stay within their geographic area.
Regular route truck drivers are assigned specific routes and return home on a regular schedule. These subpopulations are generally able to seek health care with their preferred provider on a regular basis. The long-haul irregular route trucker provides services between large geographic areas, frequently from one coast to the other (U.S. Bureau of Labor Statistics, 2006-07). These drivers typically are not routed home on a regular basis. Some drivers may stay out on the road for several weeks before being routed home making it difficult for these workers to obtain consistent health care services (LaDou, 1988; Renner, 1998). With erratic work hours, scheduling appointments with healthcare providers is virtually impossible; thus, treatment is delayed or is often sought at multiple emergency departments or freestanding ambulatory clinics where costs are high and care is generally nonholistic and fragmented (LaDou, 1988; Renner, 1998).
Employers also look for responsible, self-motivated individuals who are able to work well with little supervision (U.S. Bureau of Labor Statistics, 2006-07). It is estimated that 21% ofthose working as truck drivers are self-employed, working as owner operators or independent drivers (U.S. Census Bureau, 2000).
Regulations
The commercial trucking industry, the vehicles, and the employees of this industry are subject to many federal and state regulations. The Federal Motor Carrier Safety Administration within the U.S. Department of Transportation governs the activities of this transportation mode. There are 12 different parts within the Department of Transportation Title 49 that specifically address the trucking industry (U.S. Department of Transportation, 2005d). These parts include controlled substances and alcohol use and testing; commercial driver's license (CDL) standards; compliance with CDL program; general Federal motor carrier safety regulations; qualifications of drivers; driving of commercial motor vehicles; parts and accessories for safe operation; hours of service of drivers; inspection, repair and maintenance; transportation of hazardous materials; transportation of migrant workers; and employee safety and health standards.
Physical standards for commercial drivers were first issued by the Interstate Commerce Commission (ICC) in 1939 when "Good physical and mental health; good eyesight; adequate hearing; no addiction to narcotic drugs; and no excessive use of alcoholic beverages or liquors" were the only criteria needed (Hartenbaum, 2003, p. 3). It was not until 1970 that actual medical
2000, an expansion of those set in 1970 (Appendix A). Drivers are required to be at least 21 years old and pass a physical examination a minimum of once every 2 years. The main physical requirements include at least 20/40 vision with glasses or corrective lenses, and a 70-degree field of vision in each eye. Drivers may not be colorblind. Drivers must have good hearing, including ability to hear a forced whisper in one ear at not less than 5 feet, with a hearing aid if needed. Drivers must have normal use of arms and legs and normal blood pressure. Drivers may not use any controlled substances, unless prescribed by a licensed physician.
Persons with epilepsy are not permitted to be interstate truck drivers. Recently, insulin dependent diabetics have been issued waivers if good control of their disease process is demonstrated. Federal regulations also require employers to test their drivers for alcohol and drug use as a condition of employment, and require periodic random tests of the drivers while they are on duty. A driver must not have been convicted of a felony involving the use of a motor vehicle; a crime involving drugs; driving under the influence of drugs or alcohol; refusing to submit to an alcohol test required by a State or its implied consent laws or regulations; leaving the scene of a crime; or causing a fatality through negligent operation of a motor vehicle.
days unless they have taken at least 34 hours off-duty (U.S. Department of
Transportation, 2005a). Many drivers, particularly on long runs, work close to the maximum time permitted because they typically are compensated according to the number of miles or hours they drive (U.S. Bureau of Labor Statistics, 2006-07). Truck Drivers
According to the U.S. Bureau of Labor Statistics (2005), 13.1% of employed persons are Hispanic/Latina, 10.8% are Black or African American, and 4.4% are Asian. Specifically, the driver/sales workers and truck driver workforce is made up of 14.5% Black or African American, 12.7%
Hispanic/Latina, and 1.1% are Asian. Over 88% of truck drivers have a high school diploma or better (Trucking Stats and FAQ's, n.d.). This is a higher level of education than the general population age 20 and over, in which 83% are high school graduates or more (U.S. Bureau of Labor Statistics, 2006-07). The average age of those employed in the truck transportation industry is 4 3 years, with the average age of the American workforce at 41 years in 2000 (U.S. Census Bureau, 2000). Average yearly income for a driver was estimated to be $32,000
A review of the existing academic and trade literature reveals limited information about the health, health behavior, and health status of truck drivers. Of the 3 million Americans employed in the truck transportation industry, 12.4% are female (U.S. Bureau of Labor Statistics, 2004). Truck driving is rated as the Nation's third largest growth occupation, with estimated growth of 5% annually. Industry experts estimate 300,000 new drivers will be needed each year through 2014 to keep up with the growing demand for the transport of goods throughout this country (Holmes, Power, and Walter, 1996; U.S. Bureau of Labor Statistics, 2006-07). As this industry continues to grow, so too should concern for the trucker's health not only to preserve the trucker's livelihood, but also to protect the motoring public with whom the trucker shares the nation's highways.
All drivers must be able to read and speak English well enough to read road signs, prepare reports, and communicate with law enforcement officers and the public (U.S. Bureau of Labor Statistics, 2006-07). Although the vast majority of drivers are healthy and easily comply with the medical standards set forth in the D.O.T. regulations, this examination is not a wellness exam and those drivers who do not have a primary medical provider often are not in the best of health to meet the medical requirements set forth (Auerbach, 2003).
Morbidity and Mortality
an incidence rate of 5.0 per 100. With over 151,000 injuries in 2003, truck drivers had more nonfatal injuries than workers in any other occupation. Half of these nonfatal injuries were serious sprains and strains, with bruises, fractures, and lacerations accounting for many of their other common injuries. Truck drivers suffered nearly 14% (862) of the 6,238 fatal occupational injuries during 1997 (U.S. Bureau of Labor Statistics, 2003). Workers in the trucking industry experienced the most fatalities of all occupations. This number far exceeded the next closest high-risk occupation, farm occupations, with 616 fatal injuries in 1997. The number offatalities among truck drivers increased fairly steadily, from 699 in 1992 to 862 in 1997. Over the same period, the fatality rate increased from 26 to 28 per 100,000 workers. In 1997, more than 50% of the fatalities occurred in trucks with trailers or semi-trailers, and more than 80% occurred in
transportation-related incidents. From 1996 through 1997, fatalities from jackknifing and from collisions between vehicles increased by 16% and 9% respectively. Causes of death among the 862 truck driver fatalities in 1997 included transportation incidents, contact with objects or equipment, assaults and violent acts, falls, exposure to harmful substances or environments, and fires and explosions (U.S. Bureau of Labor Statistics, 2006-07). More than half of the fatal occupational injuries among truck drivers occurred on interstate highways,
freeways, expressways, or other State or U.S. highways.
in fatal crashes, 363 (about 7%) were 25 years of age or younger, and 118 (about 2%) were 66 years of age or older. In comparison, 14,117 (30%) of the 47,548 drivers of passenger vehicles in fatal crashes were 25 years of age or younger, and 5,620 (about 12%) were 66 years of age or older. About 2% of all the drivers of large trucks involved in fatal crashes were female, as compared with 30% of all drivers of passenger vehicles involved in fatal crashes. Finally, of the 4,883 drivers oflarge trucks involved in fatal crashes in 2000, 897 were not wearing a safety belt at the time of the crash; of those, 22% were completely or partially ejected from the vehicle.
Health Risks
Truck drivers are subjected to physical and psychological stresses inherent in their occupation which often includes long and irregular working hours causing excessive fatigue and mental stress (Bernard, Bouck & Young, 2000). Fatigue compromises the safety of the trucker and others on the road, and may pose long-term threats to their overall health and longevity (Reed & Cronin, 2003 ).
According to a 200 I Federal Motor Carrier Safety Administration Report, driver fatigue is recognized as a major factor in accidents involving long-haul truck drivers (Dingus et al., 2001 ). Participants at the 1995 Federal Highway Administration Truck and Bus Safety Surmnit rated driver fatigue as the most significant safety issue of their industry (Hamilton, 1995).
monotony of driving, the need for extreme mental alertness, irregular mealtimes, and unhealthy food choices (Robinson and Burnett, 2005). In a study of2,945 drivers in the United States, Korelitz eta!. (1993) found that more than 50% of drivers admitted to smoking one to two packs of cigarettes per day, almost 90% of drivers exercised only sometimes or never, 61% reported having 2 or more snacks daily, and 75% had a body mass index of>25. Drivers reported being diagnosed with back injuries, hearing loss, hemorrhoids, hernias, and unspecified types of heart disease. Drivers also complained of backaches, tiredness, leg pain,
insomnia, and gastrointestinal distress.
Roberts and York (2000) conducted a study for the Federal Motor Carrier Safety Administration and focused on six risk factors and their subsequent disease states, including smoking, obesity, hypertension, alcohol and drug abuse, stress, poor eating habits, and physical activity. The results of this study revealed an overall poor state of health for truck drivers when compared to the U.S. general population with a prevalence of 49-54% of drivers smoking, 70-73% obese, 33% hypertensive, and 91% reporting higher stress levels.
$300 in excess claim costs attributed to stress (Roberts & York, 2000). Indirectly, excessive driver turnover was also believed to be influenced by these driver concerns.
Driver turnover has been estimated to cost $1,000 per incident and the cost of recruiting, hiring and training a new driver has been estimated at $5,000
(McElroy, Rodriguez, Griffin, Morrow & Wilson, 1993). A study conducted by Robinson and Burnett (2005) revealed that long-haul truck drivers under age 55 at death were identified as experiencing significantly higher mortality from lung cancer, ischemic heart disease, acute myocardial infarction, and other forms of heart disease when compared to those in the general U.S. population based upon data gathered from 1979-1990. Age-adjusted proportionate mortality ratios (PMR), defined as the proportion of workers with a specific cause of death in a specific occupation compared to the proportion of workers with that cause of death in all occupations, indicated that Caucasian and African-American male long-haul truck drivers age 15-64 had I 09 PMR for ischemic heart disease, 112 PMR for acute myocardial infarction, 123 PMR for other forms of heart disease, and 117 PMR for lung cancer (Robinson & Burnett, 2005).
freon, and the vast array of substances carried as cargo were also identified as contributing factors to a high mortality rate.
Gender Specific Literature
Gender differences regarding the health status and health behaviors of commercial drivers were generally not identified in the literature published to date. The commercial truck industry is a male-dominated profession, estimated to be 87.6% male (U.S. Bureau of Labor Statistics, 2004). With an occupation that is one gender dominate, it is not surprising that limited information exists in identifYing the health care status of females, the minority population in this group.
measures to be taken to safeguard their health (U.S. Bureau of Labor Statistics, 2004).
Theoretical Framework
Health care access and use of health care services in the United States are complex issues. Many factors are responsible for how and why individuals choose to use the health care system. This study is based upon Andersen's Behavioral Model of Health Services Use which is a conceptual framework presenting a systems approach to understanding a specific population's access to health care and how population characteristics, in this case gender, determine predisposing characteristics involving health care behaviors (Andersen, Rice, & Kaminski, 2001 ).
The United States holds the dubious distinction of being the only
The Behavioral Model of Health Services Use, depicted in Figure 2.1, is a conceptual framework that presents a system's approach to understanding a population's access to health care. The model consists of four major components: Contextual Characteristics, Individual Characteristics, Health Behaviors, and Outcomes. The framework purports that each of the components exerts an influence on the others so the use of health services is a composite of the whole.
Contextual Characteristics contain the external environment and the health care system itself. External environmental factors affect an individual's health status and reflect the economic climate, relative wealth, politics, level of stress and violence, and prevailing norms of society that may affect the way society views health and whether access to health care is considered the responsibility of the individual or the state (Andersen eta!., 2001). Characteristics of the health care system include policies, resources, organization and financial transactions that influence the accessibility, availability, and acceptability or medical services.
The second component, Individual Characteristics, includes the personal characteristics of the population at risk that compel individuals to demonstrate certain practices and to use particular health services. Within Individual Characteristics reside predisposing characteristics, such as age and gender,
enabling resources and barriers to care, such as fiscal resources and availability of care, and need, including both evaluated and perceived needs.
FIGURE2.1
BEHAVIORAL MODEL OF HEALTH SERVICES USE (Andersen et al., 2001)
Contextual Characteristics Individual Characteristics Health Behaviors Outcomes
~
~
I
Predisposing _.Enabling ~ Need Predisposing _.Enabling
•
Need Personal PerceivedHealth Health
D,mographic HeaT policy Envirnmental D1mographic Finrcing Perc[ved Pracres
EvaJated Pop lation
f---J
Social Financing Social Organization Eva uated
r--I
I
Health Indices BeliefsI
Process of Medical HealthI
Beliefs Organization Care
I
Consumer SatisfactionUse of Personal Health
health such as appropriate diet and nutrition, exercise, stress reduction, control of alcohol and tobacco use, self-care, and compliance with medical regimens. By examining the use of health services and self-rated general health status, global measures can be identified that are possible predictors for health care access and use.
Contextual Characteristics and Individual Characteristics work through Health Behaviors to influence Outcomes. Outcomes involve people's perception of their health status and clinical assessment by health care professionals as well as their general satisfaction with the care that they received. This model also includes feedback. Health Outcomes may result in changes of health behavior and predisposing beliefs or perceived need. Health Behaviors can alter a person's need for health care services. The key to understanding health services use is understanding access. This model provides the necessary parameters that will guide this look at health care access among long-haul truckers.
perception of need and use of health care services. Each of these factors is a vital part of the trucker's access and utilization of health care.
Study Design
CHAPTER III
METHODS
The research used a descriptive, cross sectional survey design with a non-random, convenience sample. The study was designed to answer three research questions:
I. What is the self-perceived health status of male and female long-haul truckers? Are there gender differences?
2. What are the health care needs of male and female long-haul truckers? Are there gender differences?
3. How satisfied are male and female long-haul truckers with their health care access? Are there gender differences?
Institutional human subjects review board approval was obtained from the University of North Carolina at Chapel Hill prior to data collection (Appendix B).
Study Variables
Independent and dependent variables were defined for the study. Independent Variables:
- Demographic characteristics: gender, age, marital status, education, ethnicity, and income.
-Work practice variables: stress to get the job done in less hours, and stress relating to job demands.
Dependent Variables:
-Research question I: Self-perceived health status of the individual. -Research question 2: Self-perceived health care needs of the individual. -Research question 3: Trucker satisfaction with health care access.
Setting
Verbal approval from managers of truck stops from June 16, 2005 through July 14, 2005 was obtained. Three locations in rural Ohio were identified and included London, Ohio; Beaverdam, Ohio; and Jeffersonville, Ohio (Appendix C). These three sites were selected based upon their location on major interstate truck routes, proximity to large metropolitan areas, large diesel fuel island stations, proximity to dining establishments, and shower facilities for the professional drivers.
Sample
Recruitment
Recruitment occurred during five separate occasions, with two trips made to the London, Ohio truck stop, two trips to the Jeffersonville, Ohio location, and one trip to the Beaverdam, Ohio location. The principal investigator observed that more truckers were willing to participate during the evening mealtime of 5:00PM to 8:00PM. Interested male participants fitting the eligibility criteria were found to be plentiful with 27 volunteers identified during the first trips to each of the three selected locations. Interested female participants fitting the study criteria proved to be more difficult to locate possibly due to the overall fewer numbers of female truckers. Multiple trips to the London, Ohio and Jeffersonville, Ohio locations were required to exclusively recruit the desired number of 26 female long-haul truckers. Subjects who identified themselves as long-haul truckers were distributed a study recruitment flyer (Appendix D) which indicated the study purpose and eligibility requirements. Eligible subjects who expressed interest in participating were directed to a recreational vehicle parked in the truck stop lot for further study information.
Instrument Development and Testing
A five page, self-administered questionnaire (Appendix E) focusing on health access, health care, and health status was adapted from a questionnaire previously developed and used by permission ofD.B. Reed (personal
to medical care, trucking experience, health care and health status, and background demographic information.
The questionnaire was further developed by personal interviews with two male and one female long-haul truckers to frame the most pertinent questions and develop a better cultural appreciation and occupational understanding oflong-haul truckers. This increased the validity of the instrument and ultimately the data derived from such. The questionnaire was then pre-tested with two male truckers to establish clarity, time burden, and content validity of the instrument. No female truckers were readily accessible during the pre-test phase and were not utilized for pre-testing the instrument.
The first section of the survey, Access to Medical Care, contained 13 questions. Questions in this section established if the participant had a usual place for medical care and the type of health facility, if a work-related injury had ever occurred and where treatment was obtained, where employment physical
examinations were conducted including assessment of personal health status, and if the participant had health insurance and employer paid sick leave. Twelve of the thirteen questions were categorical type questions that requested a specific response, and one was a yes/no type question.
The second section, Trucking Experience, included five questions. These questions established the type of employer, years as a professional driver, number of days and hours typically worked, and job demands and pressure ratings. Four of the five questions were continuous type questions requesting a specific
The third section, Health Care and Health Status, included 14 questions. Twelve questions in this section were continuous type questions requesting a specific response. Two questions were ordinallikert-type questions. Questions in this section focused on use of health care services, use of medications, health problems experienced, smoking status, exercise levels, source of health
information, and satisfaction with health care access while at home and at work. The final section, Background Information, included seven questions. These questions, all continuous type questions, focused on establishing a demographic picture of the participants. These questions included age, marital status, number of children, level of education, ethnicity, and income.
Access to health care, defined as "actual use of personal health services and everything that facilitates or impedes their use" (Andersen et al., 2001, p. 3), was measured by the respondents' usual method of obtaining care while on the job and their satisfaction with access to care. A list of seven categories, including trucker magazines, other popular magazines, on-line trucker web sites, other websites, trucking company employer, health care provider, and occupational health clinics, as well as an open-ended response area where a specific other answer could be provided for respondents to check related to their methods of acquiring health care information was provided.
accessible health services for truckers"; "many truckers are in very poor health"; and "it would be nice to have more affordable health services closer to the interstates." These data were entered as field entries and may be useful in generating hypotheses for future studies.
Data Collection
From June 16, 2005 through July 14, 2005, verbal approval from managers of the three truck stops was obtained. A recreational vehicle was parked in a prominent location within the truck stop parking lot near the fuel island and served as the base location for participants to utilize while completing their questionnaire. Surveys were generally administered from 1:OOPM to 8:00PM at large interstate truck stops in London, Jeffersonville, and Beaverdam, Ohio.
Recruitment flyers were posted on the fuel islands directing any eligible participant to the nearby recreational vehicle. As truckers were observed pulling into the fuel island or parking area, the principal investigator approached their vehicle and handed a recruitment flyer to the driver. If the driver refused the flyer, he/she was thanked for their time and the researcher walked away. If the trucker expressed interest, read the recruitment flyer, and met the eligibility requirements, he/she was escorted to the recreational vehicle.
were raised mainly concerned how the survey information would be used to assist in program development. The fact sheet served as the surrogate informed consent of the participant. The principal investigator then signed the bottom of the fact sheet acknowledging subject participation and informed consent. Participants were specifically requested not to provide their name or signature to maintain confidentiality and anonymity of the survey process.
After verbal consent was given, the first 27 male and 26 female self-identified eligible participants were escorted into a private area within the recreational vehicle, handed a questionnaire and a pencil, and offered a seat in order to complete the questionnaire in its entirety. Participants were limited to two at a time in the vehicle due to size and also to maintain confidentiality of the participants. A curtain was hung in the middle of the recreational vehicle that obscured the view from one area to another. Participation was strictly voluntary and the respondents were free to leave at any time during the survey process. The principal investigator remained outside the vehicle but was accessible at all times to answer any questions that arose. Completion of the survey generally took I
Data Management and Analysis
Following the data collection process, all data were transferred to and maintained in a locked filing cabinet at the principal investigator's office under the principal investigator's control at all times. No personal identifiers were given to maintain the anonymity of the data. All data were analyzed and presented in aggregate form by gender.
Questionnaires were examined for completeness. Two male and 1 female questionnaires were found to be missing at least 25% of the data and were
CHAPTER IV
FINDINGS
There were 27 male and 26 female surveys completed as part of this pilot study. Male participants meeting the eligibility criteria were found to be readily available and willing to complete the questionnaire. Eligible female participants were much more difficult to obtain and proved to be a challenging group to access.
Background Information
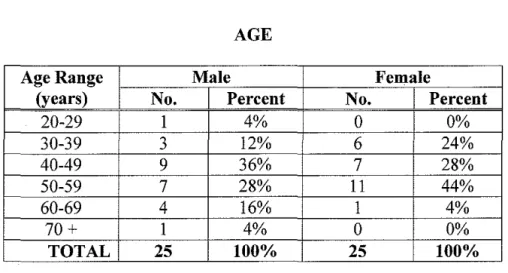
The questionnaire requested general background information to establish a demographic picture of the participants. Table 4.1 indicates 9 (36%) of the male drivers were age 40-49, 7 (28%) were 50-59,4 (16%) were age 60-69, 3 (12%) age 30-39, 1 (4%) age 22-29, and 1 (4%) was over age 70. The median age of the male drivers was 49.8 years. Eleven (44%) of the female drivers were age 50-59, 7 (28%) were age 40-49, 6 (24%) age 30-39, and 1 (4%) was age 60-69. The median age of the female participants was 4 7.4 years.
The majority of participants were married, as reflected by the data shown in Table 4.2. Of the male drivers, 16 (67%) were married, 4 (17%) were
divorced, 3 (12%) single, and 1 (4%) was separated. For the women subjects, 13 (52%) were married, 6 (24%) divorced, 3 (12%) single, and 3 (12%) were separated.
TABLE 4.1 AGE
Age Range Male Female
(years) No. Percent No. Percent
20-29 I 4% 0 0%
30-39 3 12% 6 24%
40-49 9 36% 7 28%
50-59 7 28% 11 44%
60-69 4 16% I 4%
70+ I 4% 0 0%
TABLE4.2
MARITAL STATUS
Marital Status Male Female
No. Percent No. Percent
Married 16 67% 13 52%
Divorced 4 17% 6 24%
Single 3 12% 3 12%
Separated I 4% 3 12%
Widowed 0 0% 0 0%
TABLE4.3
NUMBER OF CHILDREN UNDER AGE 18
Children Under Male Female
Age18 No. Percent No. Percent
0 15 60% 19 76%
1 4 16% 2 8%
2 4 16% 2 8%
3 1 4% 1 4%
4 1 4% 1 4%
children under the age of 18,4 (16%) had 1 child under age 18, 4 (16%) had 2 children under age 18, 1 driver ( 4%) had 3 children under age 18, and I driver ( 4%) had 4 children under the age of 18. Female drivers reported much the same way with 19 (76%) female drivers reporting have zero children under age 18. Two female drivers (8%) had 1 child under age 18, 2 had 2 children under 18, and I (4%) had 3 children and 1 (4%) had 4 children under the age of 18.
To gain a picture of the educational level of the participants, drivers were asked to indicate the highest level of education completed (Table 4.4). Fourteen (56%) male drivers reported completing high school or obtaining their G.E.D. certificate, nine (36%) completed college courses or above, and two (8%) reported not completing their high school education. Female drivers reported completing a higher level of education than the men as 16 (64%) completed college courses or above. Seven (28%) female drivers completed high school or obtained their G.E.D. certificate, and two (8%) failed to complete their high school education.
When asked to describe themselves ethnically, the overwhelming majority of both genders reported being Caucasian, reflected in Table 4.5. Twenty-two (88%) male drivers considered themselves to be Caucasian, two (8%) were African-American, and one (4%) was of Asian descent. Among the female drivers, 19 (79%) were Caucasian, 2 (8%) African- American, 2 (8%) identified themselves as mixed descent, and 1 ( 4%) was of Hispanic origin.
TABLE4.4 EDUCATION
Level of Education Male Female
No. Percent No. Percent
Less than 12th Grade 2 8% 2 8%
HS Diploma/GED 14 56% 7 28%
College or Higher 9 36% 16 64%
TABLE4.5
ETHNICITY
Ethnicity Male Female
No. Percent No. Percent
Caucasian 22 88% 19 79%
African American 2 8% 2 8%
Asian I 4% 0 0%
Hispanic 0 0% I 4%
Other 0 0% 2 8%
TOTAL 25 100% 24 99%*
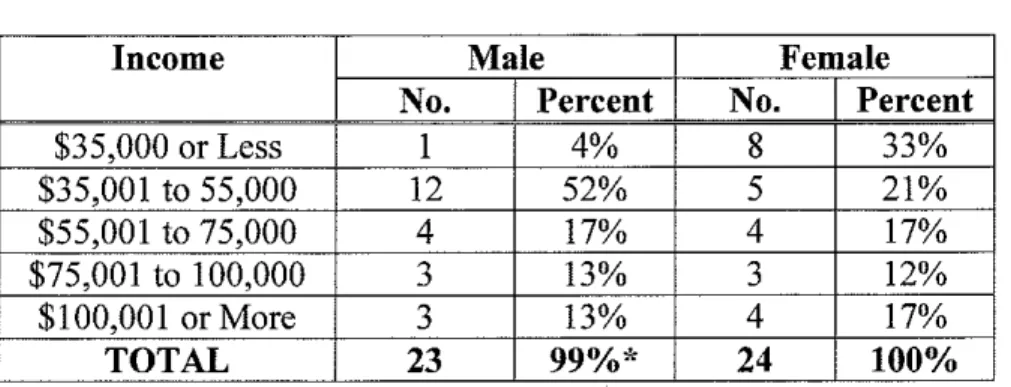
income as shown in Table 4.6. Twelve (52%) of the male participants had income between $35,001 to $55,000 per year, 4 (17%) reported income of$55,001 to $75,000, 3 (13%) reported income ranging from $75,001 to $100,000, and 3 (13%) reported income over $100,000. One driver (4%) reported gross annual income in 2003 of $35,000 or less. Female drivers reported income at a much lower level than their male counterparts with 8 (33%) having gross income at $35,000 or less. Five female drivers (21 %) reported income ranging from
$35,001 to $55,000,4 (17%) had income of$55,001 to $75,000, 3 (12%) reported income ranging from greater than $75,000 to $100,000, and 4 (17%) had income of more than $100,000.
Access to Medical Care
Table 4.7 reflects that 13 (54%) of the male respondents had a usual place that they went when sick or needed advice about their health care. Of the female drivers, 16 ( 66%) had a usual place for their health care.
TABLE 4.6
INCOME
Income Male Female
No. Percent No. Percent
$35,000 or Less I 4% 8 33%
$35,001 to 55,000 12 52% 5 21%
$55,001 to 75,000 4 17% 4 17%
$75,001 to 100,000 3 13% 3 12%
$100,001 or More 3 13% 4 17%
TOTAL 23 99%*
24
100%TABLE4.7
PARTICULAR FACILITY USED FOR MEDICAL CARE
Response Male Female
No. Percent No. Percent
Yes 13 54% 16 66%
No 11 46% 8 33%
TOTAL 24 100% 24 99%*
TABLE4.8
REASON FOR NOT USING MEDICAL PROVIDER
Reason Male Female
No. Percent No. Percent
No Insurance/Can't Afford 2 18% 2 25%
Care Was Not Convenient 2 18% 0 0%
Don't Know Where to Go 2 18% 1 13%
Don't Need Doctor 1 9% 1 13%
Have Insurance But Can't Afford 1 9% 3 37%
Office Visits
Don't Know 1 9% 0 0%
Don't Like, Trust or Believe in 0 0% 1 13% Doctor
Other 2 18% 0 0%
TOTAL 11 99%* 8 100%
not afford a visit, one (12.5%) female driver did not like, trust or believe in a doctor, one (12.5%) female driver did not know where to go to seek health care, and one (12.5%) felt she did not need a doctor.
When questioned where medical care was usually sought, Table 4.9 reflects that 20 (83%) of the male respondents went to a doctor's office or private clinic for care, 3 (13%) went to an urgent treatment center, and I (4%)went to a hospital emergency room. Eighteen (78%) of the female drivers sought treatment at a doctor's office or private clinic, 3 (13%) went to an urgent treatment center, and 1 (4%) each went to the hospital emergency room or a VA hospital or clinic.
Ten males (40%), and 13 (52%) females indicated they had experienced a work-related injury while away from home. Two males and I female experienced injury to multiple body parts. Table 4.10 shows the types of work-related injuries reported. The most common complaint for males were back and neck injury (n=4), shoulder injury (n=2), injury due to falling (n=2), knee injury (n=l), laceration (n=1), foot injury (n=l) and inhalation injury due to noxious fumes (n=l). For the female respondents, the most common complaint was injury due to falling (n=4), back injury (n=3), hand, wrist or shoulder injury (n=3) broken bones (n=2), and foot, ankle or toe injury (n=2).
TABLE4.9
USUAL LOCATION FOR MEDICAL CARE
Usual Location Male Female
No. Percent No. Percent
Doctor's Office or Private Clinic 20 83% 18 78%
Urgent Treatment Center 3 13% 3 13%
Hospital Emergency Room I 4% I 4%
VA Hospital or Clinic 0 0% l 4%
TOTAL 24 100% 23 99%*
TABLE 4.10
TYPE OF WORK-RELATED INJURY
Injury Type Male Female
No. No.
Back and Neck Injury 4 3
Hand/Wrist/Shoulder Injury 2 3
Falls 2 4
Knee Injury 1 0
Laceration 1 0
Foot/Ankle/Toe Injury 1 2
Inhalation of Fumes 1 0
Broken Bones 0 2
TABLE 4.11
REASON FOR NOT PURSUING MEDICAL CARE
Male Female
Response Yes No Yes No
No. % No.
•;.
No. % No. 0/oNot Know Where to 5 71% 2 29% 5 83% 1 17%
Stop
Pressure to Make 3 43% 4 57% 6 100% 0 0%
they were unsure of where to stop or find a medical provider while on-the-road while three (43%) did not stop for medical care due to pressure to make a
delivery. Five (83%) of the six female drivers who suffered a work-related injury did not seek medical care while on-the-road because they were unsure where to stop or find a provider and all six (100%) female drivers also indicated they did not seek medical care due to demands to make a delivery.
When asked what the drivers did for treatment while on-the-road if they did not seek medical care, four males responded (57%) that they took over-the-counter medicine (Table 4.12). Two responses included they called their family physician office and asked for advice (29%), and one respondent (14%) ignored the injury. Among the six female drivers who chose not to seek medical care, three (50%) took over-the-counter medicine, two (33%) ignored the injury, and one (17%) called their family physician and asked for advice.
Table 4.13 indicates responses regarding the location drivers obtained their required Department of Transportation physicals. The majority of the males (n=13, 54%) utilized a company health clinic for their exams, 6 (25%) went to their family physician's office or clinic, and 5 (21%) utilized an occupational health clinic. Among the female drivers, 13 (52%) utilized a company health clinic, 7 (28%) an occupational health clinic, 4 (16%) their family physician's office or clinic and 1 (4%) utilized a walk-in clinic for their exam.
TABLE 4.12
TREATMENT FOR WORK-RELATED INJURY IF UNABLE/UNWILLING TO STOP FOR MEDICAL CARE
Treatment Male Female
No. Percent No. Percent
Took Over-the-Counter 4 57% 3 50%
Medicine
Called Family Physician and 2 29% 1 17%
Asked for Advice
Ignored It 1 14% 2 33%
TABLE4.13
LOCATION OF DEPARTMENT OF TRANSPORTATION (D.O.T.) EXAMS
Location ofD.O.T. Exams Male Female
No. Percent No. Percent
Company Health Clinic 13 54% 13 52%
Family Doctor's Office or 6 25% 4 16%
Private Clinic
Occupational Health Clinic 5 21% 7 28%
Other 0 0% 1 4%
TABLE 4.14
ASSESSMENT OF PERSONAL HEALTH STATUS
Perceived Health Male Female
Status No. Percent No. Percent
Excellent I 4% 2 8%
Very Good 3 13% 3 12%
Good 12 50% 14 56%
Fair 8 33% 5 20%
Poor 0 0% 1 4%
health status was excellent or very good, 14 (56%) judged their health status as good, 5 (20%) as only fair, and I (4%) judged their health status as poor.
When asked about medical insurance, 16 males (64%) worked for an employer who provided health insurance coverage, 5 (20%) drivers did not have health insurance coverage, 3 (12%) responded as other and I (4%) was self-employed and purchased his own coverage (Table 4.15). Among the female drivers, 13 (52%) indicated their trucking company provided their health
insurance coverage, 9 (36%) did not have health insurance coverage, 2 (8%) were self-employed and purchased their own health plan, and I (4%) responded as other.
Among the males who worked for a trucking company, 7 (30%) indicated they had paid sick leave, 12 (52%) did not have paid sick leave, 2 (9%) did not know if they had paid sick leave, and 2 (9%) of the drivers indicated they were self-employed (Table 4.16). Fourteen (56%) female driver respondents indicated they did not have paid sick leave, 6 (24%) were self-employed, 3 (12%) did not know if their employer provided paid sick leave, and 2 (8%) had paid sick leave.
Trucking Experience
The majority of male drivers (n=l8, 75%) worked for a commercial fleet operation (Table 4.17). Six (25%) of the males were owner-operators or
independent drivers. Among the females, 17 (71 %) worked as part of a
commercial fleet, 5 (21%) were owner-operator/independent drivers, and 2 (8%) indicated they leased their vehicle and worked independently.
TABLE4.15
MEDICAL INSURANCE
Type of Medical Insurance/ Male Female
Health Plan No. Percent No. Percent
Trucking Company Provides 16 64% 13 52%
Health Plan
Don't Have Health Plan/ 5 20% 9 36%
Medical Insurance
Self-employed and Provide Own 1 4% 2 8%
Insurance
Other 3 12% 1 4%
TABLE4.16 PAID SICK LEAVE
Response Male Female
No. Percent No. Percent
Yes 7 30% 2 8%
No 12 52% 14 56%
Don't Know 2 9% 3 12%
Self-employed 2 9% 6 24%
TABLE 4.17
EMPLOYMENT BY TYPE OF TRUCKING COMPANY
Type of Trucking Male Female
Company No. Percent No. Percent
Employment
Commercial Fleet 18 75% 17 71%
Owner-Operator/ 6 25% 5 21%
Independent
Other 0 0% 2 8%
truck driver for 20 years or more (Table 4.18). Five (21 %) were on the opposite end. of this spectrum and indicated that they had worked less than 5 years as a professional truck driver. Four (17%) worked 10 to 14.9 years as a driver, 4 (17%) worked 15 to 19.9 years as a driver, and 3 (13%) had worked 5 to 9.9 years as a professional truck driver. The male sample reported an average of 15.5 years experience as a professional truck driver. The majority of female drivers (n=12, 50%) indicated they had worked less than five years as a professional truck driver. Six (25%) had worked 5 to 9.9 years as a driver, 3 (13%) had worked 10 to 14.9 years, 2 (8%) had worked 15 to 19.9 years as a driver and 1 (4%) had worked twenty years or more as a professional truck driver. The female sample reported an average of 6.6 years experience as a professional truck driver.
Table 4.19 indicates that the majority of male drivers, (n=l5, 63%) drove ten hours or less per day. The female drivers indicated a slightly lower number with twelve (55%) driving ten hours or less per day. The Department of
Transportation (D.O.T.) dictates that a driver may drive for up to eleven hours per day before a mandatory rest period is taken (U.S. Department of Transportation, 2005 a).
When a male driver is on-the-road, II (44%) felt pressured several times a month to get the job done in less hours, 4 (16%) never felt pressured to complete the job in less hours, 4 (16%) almost never felt pressured to complete the job in less hours, 3 (12%) felt pressured several times a week, and 3 (12%) felt
TABLE 4.18
YEARS AS PROFESSIONAL TRUCK DRIVER
Years Driving Male Female
No. Percent No. Percent
Less than 1 to 4.9 5 21% 12 50%
5-9.9 3 13% 6 25%
10-14.9 4 17% 3 13%
15-19.9 4 17% 2 8%
20+ 8 33% 1 4%
TABLE4.19
DRIVING HOURS PER DAY
Driving Hours per Male Female
Day No. Percent No. Percent
1-10 15 63% 12 55%
11+ 9 37% 10 45%
TABLE4.20
PRESSURE AND JOB DEMANDS
Pressure to Get Job Done Male Female
in Fewer Hours No. Percent No. Percent
Several Times a Month 11 44% 1 4%
Several Times a Week 3 12% 5 20%
Daily 3 12% 8 32%
Almost Never 4 16% 8 32%
Never 4 16% 3 12%
TOTAL 25 100% 25 100%
Job Demands More Than Can be Handled
Several Times a Month 6 24% 7 29%
Several Times a Week 1 4% 2 8%
Daily 0 0% 1 4%
Almost Never 10 40% 6 25%
Never 8 32% 8 33%
TOTAL 25 100% 24 99%*
felt this was almost never the case, 8 (32%) indicated this was never a problem, 6 (24%) felt this was the case several times a month, and 1 (4%) indicated feeling this way several times a week. None of the male drivers indicated this was a problem on a daily basis. Eight (32%) female drivers indicated feeling pressure on a daily basis to get the job done in less time and 8 (32%) indicated that they almost never felt pressured to complete a job in less time. Additionally, 5 (20%) felt pressured several times a week, 3 (12%) never felt pressured, and I (4%) felt pressured several times a month to complete a job in less time. Concerning job demands being more than could be handled, 8 (33%) female drivers never felt this was a problem, 7 (29%) felt this was an issue several times a month, six (25%) indicated this was a problem almost never, two (8%) felt this was several times a week, and one (4%) felt this was the case on a daily basis.
Health Care and Health Status
TABLE 4.21
MEDICAL CONCERNS WHILE ON-THE-ROAD
Action Taken Male Female
No. Percent No. Percent
Take Over-the-Counter 10 40% 9 36%
Medication On My Own
Wait Until Home to See a Doctor 8 32% 9 36%
Call Family Physician 2 8% 1 4%
Go to Emergency Room 1 4% 2 8%
Find Local Public Health Clinic 1 4% 1 4%
Ignore It 0 0% 1 4%
Consult With a Pharmacist 0 0% 1 4%
Other 3 12% 1 4%
or drew upon past experience for self-treatment.
The next question inquired what non-prescription medications were taken by the drivers regularly, at least twice a week. Ten male drivers took
Tylenol/ Advil/ Aspirin on a regular basis (Table 4.22). Ten drivers also indicated taking other medications such as sinus and cold medications and high blood pressure pills. Nine male drivers took vitamins, 7 used antacid and heartburn medication, 1 driver used diet pills, and 1 used stimulants such as "No-Doz." Among the female participants, 18 took Tylenol/ Ad viii Aspirin on a regular basis, 16 took vitamins, 5 used antacid and heartburn medication, 5 indicated taking other medications that included birth control pills and Sudafed. Four respondents indicated they used stimulants such as "No-Doz," and two took diet pills on a regular basis.
TABLE4.22
TYPE OF NON-PRESCRIPTION MEDICATION USE
Non-Prescription Medication No. No.
Taken Regularly Male Female
Tylenol/ Advil/ Aspirin
10
18
Vitamins 9
16
Antacids/Heartburn Medication 7 5
Diet Pills
1
2Stimulants (i.e.,"No-Doz")
1
4TABLE4.23
USE OF OVER-THE-COUNTER MEDICATIONS BY CONDITION
Medication Usage No. Male No. Female
Headaches
10
15
Heartburn 8 7
Colds/Flu 8 9
Back Pain 7
12
Sinus Problems
5
13Preventing Colds/Flu 4 6
Muscle Soreness 4
10
High Blood Pressure 3
0
Arthritis 3
10
For Energy
2
5
Sleeping Difficulty
1
3Ulcers
0
2
Menstrual Pain N/A 7
When asked if a health professional stated they had any of the following conditions, I 0 male drivers listed they had been told they had high blood pressure, 7 had sinus problems, 6 had back pain, 4 each had frequent heartburn and
diabetes, 3 each had arthritis, sleeping difficulty or vision problems, 2 had a heart attack or have chronic bronchitis, and I had asthma or migraine headaches (Table 4.24). Twelve female drivers indicated having sinus problems, I 0 had back pain, 8 had arthritis, 7 had chronic bronchitis and vision problems, 6 had high blood pressure, 5 had frequent heartburn and depression, 4 indicated being told they were diabetic, asthmatic, or had migraine headaches, 3 had ulcers, and I had a heart attack or sleeping difficulty. Drivers may have indicated a variety of medical problems in their responses, thus these responses are not mutually exclusive.
Table 4.25 reflects responses regarding drivers having had any of the conditions in the past month. Eleven of the male drivers indicated having a backache, 9 had extreme tiredness, 7 had leg pain or diarrhea/constipation, 5 had difficulty sleeping or dizziness/headaches, 4 had depression, and 2 had stomach pain. Fourteen female drivers indicated problems with backache, 12 had leg pain or diarrhea/constipation, I 0 had extreme tiredness, 8 had stomach pain or
dizziness/headaches, 6 had depression, and 5 had difficulty sleeping.
TABLE 4.24
DIAGNOSED MEDICAL CONDITIONS
Diagnosed Medical No. Male No. Female
Condition
High Blood Pressure 10 6
Sinus Problems 7 12
Back Pain 6 10
Frequent Heartburn 4 5
Diabetes 4 4
Arthritis 3 8
Sleeping Difficulty 3 1
Vision Problems 3 7
Heart Attack 2 1
Chronic Bronchitis 2 7
Asthma 1 4
Migraine Headaches 1 4
Depression 0 5
TABLE 4.25
HEALTH PROBLEMS IN THE LAST MONTH
Health Problems No. Male No. Female
Backache 11 14
Extreme Tiredness 9 10
Leg Pain 7 12
Diarrhea/Constipation 7 12
Difficulty Sleeping 5 5
Dizziness/Headaches 5 8
Depression 4 6
TABLE4.26 SMOKING STATUS
Smoking Status Male Female
No. Percent No. Percent
Current Smoker 10 40% 15 60%
Never Smoked 9 36% 9 36%
Former Smoker 6 24% 1 4%
When asked about exercising, the majority of male drivers (n=15, 60%) indicated they did not exercise (Table 4.27). Seven (28%) exercised 1 or 2 times a week, and 3 (12%) indicated they exercised 3 or more times per week. Of the female respondents, 14 (58%) indicated they did not exercise, 6 (25%) exercised 1 or 2 times a week, and 4 (17%) exercised 3 or more times per week.
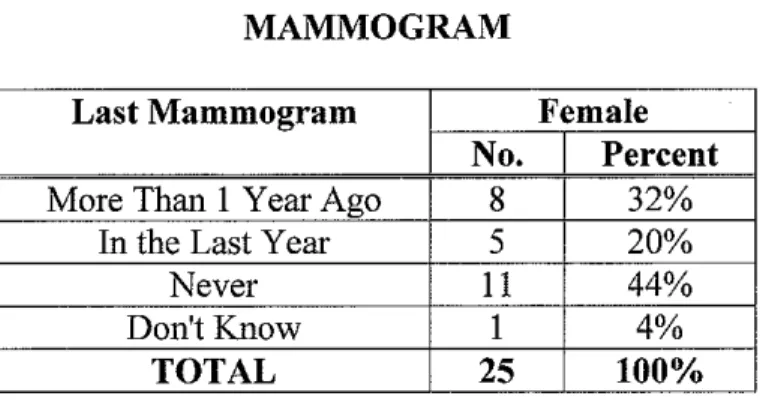
Table 4.28 reflects data concerning the number of caffeinated beverages consumed per day. The majority of male and female drivers (n=18, 72% and n=21, 84% respectively) consumed one to five caffeinated beverages per day. There were two questions pertaining exclusively to female health care. Over half of the female drivers (n=13, 52%) had their last Pap smear more than one year ago, 9 (36%) had a Pap smear in the last year, and 3 (12%) had never had a Pap smear (Table 4.29). Table 4.30 data indicates 11 ( 44%) female participants had never had a mammogram, 8 (32%) had their last mammogram more than one year ago, 5 (20%) in the last year and 1 (4%) did not know when their last
mammogram had been.
When drivers were asked where they typically found information
TABLE4.27
EXERCISE SESSIONS PER WEEK
Exercise Sessions Male Female
Per Week No. Percent No. Percent
None 15 60% 14 58%
1 or 2 7 28% 6 25%
3+ 3 12% 4 17%
TABLE4.28
CONSUMPTION OF CAFFEINATED BEVERAGES
Caffeinated Beverages Male Female
Consumed Daily No. Percent No. Percent
None 2 8% 1 4%
1-5 18 72% 21 84%
5+ 5 20% ' ~ 12%
TABLE4.29 PAP SMEAR
Last Pap Smear Female
No. Percent
More Than 1 Year Ago 13 52%
In the Last Year 9 36%
Never 3 12%
TABLE 4.30
MAMMOGRAM
Last Mammogram Female
No. Percent
More Than 1 Year Ago 8 32%
In the Last Year 5 20%
Never 11 44%
Don't Know 1 4%
TABLE 4.31
SOURCE OF HEALTH CARE INFORMATION
Source of Information No. Male No. Female
Health Care Provider 9 10
Trucker11agazines 5 6
Trucking Company 3 4
Employer
Other Popular 11agazines 2 7
Occupational Health 2 2
Clinics
Other Websites 0 2
care provider was their source of health care information, 7 cited other popular magazines, 6 utilized trucker magazines, 4 indicated their employer was a source of health care information, 2 indicated utilizing non-trucking related websites, and 2 utilized occupational health clinics as a source of information.
Regarding access to health care while on-the-road, two (11 %) of the male drivers indicated they were very satisfied with their health care, four (21%) indicated they were somewhat satisfied, five (26%) were not very satisfied, and eight (42%) of the male drivers indicated they were not at all satisfied with their health care access while on-the-road (Table 4.32). Among the female drivers, none of the drivers were very satisfied with their health care while on-the-road, 7 (29%) were somewhat satisfied, 5 (21%) were not very satisfied, and 12 (50%) were not at all satisfied with their health care while on-the-road.
Table 4.33, however, reflects that I 0 (50%) of the male drivers were very satisfied with their health care access while at home. Six (30%) indicated they were somewhat satisfied with health care access at home, 2 (1 0%) were not very satisfied, and 2 (I 0%) were not at all satisfied with health care access at home. Females reflected the same sentiments, with 11 (44%) very satisfied with health care access at home, 8 (32%) were somewhat satisfied, 4 (16%) were not very satisfied, and 2 (8%) indicated they were not at all satisfied with health care access at home. There was not, however, a significant difference found when comparing satisfaction between access to health care while on-the-road (p = 0.93)
TABLE 4.32
SATISFACTION WITH HEALTH CARE ON-THE-ROAD
Satisfaction Level Male Female
No. Percent No. Percent
Very Satisfied 2 11% 0 0%
Somewhat Satisfied 4 21% 7 29%
Not Very Satisfied 5 26% 5 21%
Not at All Satisfied 8 42% 12 50%
TABLE4.33
SATISFACTION WITH HEALTH CARE AT HOME
Satisfaction Level Male Female
No. Percent No. Percent
Very Satisfied 10 50% 11 44%
Somewhat Satisfied 6 30% 8 32%
Not Very Satisfied 2 10% 4 16%
Not at All Satisfied 2 10% 2 8%
TABLE4.34
COMPARISON OF SATISFACTION WITH CARE
Variable Type of Test Result
Satisfaction with Care Chi-squared,
Q
p-0.93 While On-the-roadSatisfaction with Care Chi-squared,
Q
p=0.5CHAPTERV
DISCUSSION/CONCLUSIONS
Tbis was a descriptive study to identify the health care needs, health status, satisfaction with health care providers, and degree of health care access of the long-haul trucker comparing gender differences. This chapter will discuss the major findings, limitations of the study, suggestions for future research,
implications for occupational and environmental health nurses, and conclusions. Sample Characteristics
The ethnic make-up of the study population was predominately Caucasian (88% male, 79% female) with African Americans comprising 8% of both male and female participants. The study was lacking in minority representation with only one driver of Asian descent and one driver of Hispanic descent. This lack of minority representation may have been due to the rural locations chosen for the survey locations.
The study population tended to be older, better educated, and had a considerably higher income than the industry average. The average age of the study population, 49.8 years among males and 47.4 years among females, was older than the 40.6 years of the general working population and the average age of drivers in the trucking industry at 43.1 years. This difference may have been due to the time of day the survey information was collected, as senior employees tend to work the daytime hours. A second reason for the variation from the average age may be attributed to the large number of owner-operator drivers who