MJCCA9 – 715 ISSN 1857-5552 e-ISSN 1857-5625
Received: May 19, 2016 DOI: doi.org/10.20450/mjcce.2016.936
Accepted: June 8, 2016 Original scientific paper
DEVELOPMENT OF ALTERNATIVE HPLC METHOD FOR THE DETERMINATION OF TIROFIBAN IN RAT SERUM
Marija Darkovska Serafimovska1,3, Emilija Janevik-Ivanovska1*, Trajan Balkanov2, Nenad Ugresic3
1Faculty of Medical Sciences, Goce Delčev University, Štip, Republic of Macedonia
2Faculty of Medicine, Ss. Cyril and Methodius University, Skopje, Republic of Macedonia
3Faculty of Pharmacy, University of Belgrade, Belgrade, Serbia
e-mail corresponding author???
Tirofiban hydrochloride is a reversible antagonist of fibrinogen binding to the GPIIb/IIIa receptor, used for the treatment of acute coronary syndrome. A novel RP-HPLC method has been developed and validated for the determination of Tirofiban in serum of Wistar rats with and without deep acute venous thrombosis. The chromatographic separation was carried out using a reverse-phase HPLC column Puro-spher® RP-18e (150 mm 4.6 mm i.d.; 5 μm) coupled with a guard column LiChrosorb® (4 mm 4 mm i.d.; 7 μm) and mobile phase consisting of the mixture of 1-octane sulfonic acid in water (pH 3.0, adjusted with orthophosphoric acid) and acetonitrile, with a ratio of 60 : 40 (v/v) and a flow rate of 1.0 ml/min, at a wavelength of 277 nm. The serum concentrations of Tirofiban in the group of rats with DVT were lower than those in the control group, and it could be explained with the binding of Tirofiban with the GPIIb/IIIa receptors.
Keywords: Tirofiban; deep acute venous thrombosis (DVT); HPLC determination; rat serum
РАЗВОЈ НА АЛТЕРНАТИВНA HPLC-МЕТОДA ЗА ОПРЕДЕЛУВАЊЕ ТИРОФИБАН ВО СЕРУМОТ НА СТАОРЕЦ
Тирофибан хидрохлорид е реверзибилен антагонист на фибриногенот врзувајќи се за рецепторот GPIIb/IIIa, и се користи за третман на акутен коронарен синдром. Нова RP-HPLC-метода е развиена и валидирана за определување на тирофибанот во серумот на Wistar стаорци со и без длабока акутна венска тромбоза. Хроматографското раздвојување се врши со помош на реверзно фазна HPLC-колона Purospher® RP-18E (150 mm 4.6 mm; 5 μm) во комбинација со претколона LiChrosorb® (4 mm 4 mm; 7 μm) и мобилна фаза која се состои од смеса на 1-октанска сулфонска киселина во вода (pH 3.0, се регулира со ортофосфорна киселина) и ацетонитрил во сооднос 60 : 40 (v/v) и проток од 1,0 ml/min, на бранова должина од 277 nm. Серумските концентрации на тирофибанот во групата стаорци со ДВТ беа пониски од оние во контролната група, што би можело да се објасни со врзување на тирофибанот за рецепторите GPIIb/IIIa.
Клучни зборови: тирофибан; длабока акутна венска тромбоза (ДВТ); HPLC-определување; серум на стаорец
1. INTRODUCTION
Tirofiban hydrochloride, chemically described as N-(butylsulfonyl)-O -(4-[4piperidinyl]butyl)-L-ty-rosine monohydrochloride monohydrate (Fig. 1), is
Arg-Gly-Asp (RGD) as a template [1, 2]. When adminis-tered intravenously, Tirofiban inhibits ex vivo
platelet aggregation in a dose- and concentration-dependent manner. In combination with heparin and aspirin, it is used for the treatment of patients with unstable angina or non-Q-wave myocardial infarction, including patients who are to be man-aged medically or those treated prior to angi-ography/coronary intervention [3, 4]. Adjunctive therapy with GP IIb/IIIa-receptor inhibitors can reduce the incidence of cardiac ischemic events, including subsequent myocardial infarction (MI) and death, in patients with non-ST-segment-elevation acute coronary syndromes [5]. It was shown that treatment with Tirofiban can reduce the rate of thrombotic cardiovascular events (com-bined endpoint of death, myocardial infarction, or refractory ischemia/repeat cardiac procedure) in patients with non-ST elevation acute coronary syndrome (NSTE-ACS) [6, 7]. Ex vivo cultures of arterial rings confirmed that Tirofiban also activate growth-stimulatory signals in the endothelium. Thus, the benefits of tirofiban in those with acute coronary syndromes may be due to rapid endo-thelization of damaged vessel, besides antiplatelet effects [1]. Platelet aggregation inhibition [8] is reversible following cessation of the infusion of Tirofiban. Tirofiban has a rapid onset and short duration of action when administered intravenous-ly, with a half-life of approximately 2 hours. Also, 90% inhibition is achieved by the end of a 30-minute infusion [9]. Tirofiban is not strongly bound to plasma proteins. The unbound fraction in human plasma is around 35%. The distribution volume of Tirofiban in the steady state ranges from 22 to 42 liters [10–12]. Experiments with the intra-venous administration of 14C-labelled Tirofiban to healthy subjects show that it is cleared from the plasma largely by renal excretion, with about 65% of an administered dose appearing in urine and about 25% in feces [10, 11]. The drug was ap-proved by the FDA in 1998, discovered by Merck, USA, and marketed under the brand name Ag-grastat in the US by Medicure Pharma and the rest of the world by Irokocardio International SARL, Geneva [2, 12, 13].
Fig. 1. Chemical structure of Tirofiban hydrochloride
Very few methods have been reported for the determination of Tirofiban in biological samples [14, 15]. According to data in the literature, reverse-phase chromatographic methods with acetonitrile and phos-phate buffer solution [16] or 1-octane sulfonic acid solution at lower pH are used for the identification and quantification of Tirofiban [15, 17].
In our previous work, we developed and val-idated a RP-HPLC method using the mobile phase consisting of phosphate buffer (pH 5.2) and ace-tonitrile (70:30, v/v) and a detection wavelength of 274 nm [16]. Although we obtained good separa-tion with the existing method, we aimed to achieve higher sensitivity and an increased range of meas-urements. Therefore, our objective was to develop a sensitive, reproducible, rapid, and cost-effective RP-HPLC method with UV detection for the ther-apeutic monitoring of the levels of Tirofiban in serum samples.
2. EXPERMENTAL
2.1. Chemicals and reagents
Tirofiban hydrochloride as a Reference Standard was supplied by Merck (batch No. L-000700462-006X027). Methanol and acetonitrile were HPLC grade and were provided by Sigma Aldrich. All other chemicals were analytical rea-gent grade. Redistilled water was used to prepare solutions for mobile phase.
2.2. Apparatus
Chromatography was performed on a HPLC system 1200 series equipped with: binary pump SL, microvacuum degasser, standard autosampler ALS SL, column compartment TCC SL, diode array detector DAD SL from Agilent Technologies (Germany).
2.3. Chromatographic conditions
The separation was performed at room tem-perature, using an isocratic method and reverse-phase HPLC column Purospher® RP-18e (150 mm
samples precipitated proteins so they do not inter-fere with further analysis.
The mobile phase, containing a mixture of 1-octane sulfonic acid in water (pH 3.0, adjusted with orthophosphoric acid) and acetonitrile in the ratio 60 : 40 v/v and flow rate of 1.0 ml min–1, gave the best separation of peaks without interference from other components from the plasma including heparin, which we added as an anticoagulant.
The injection volume of samples was 50 µl. Chromatographic data were analyzed using Chem-Station software from Agilent Technologies (Ger-many), following requirements for chromatograph-ic analysis. Regression calculations were done with Microsoft Excel.
2.4. Preparation of 1-octane sulfonic acid solution
Two g of 1-octane sulfonic acid were weighed and transferred into a 1000-ml flask, and then water was added to the mark. The pH was adjusted to 3.0 with orthophosphoric acid
2.5. Standard solutions and calibration curves
The standard stock solution of Tirofiban was prepared by dissolving Tirofiban hydrochloride with methanol to achieve the concentration of Tirofiban in the range of 0.01–0.21 mg·ml–1. The calibration curve was constructed by plotting the ratio of the peak area of the drug against the drug concentration. All solvents and solutions for HPLC analysis were filtered using a membrane filter (0.45 μm pore size) and were vacuum degassed before use.
2.6. Validation of the method
The proposed method was validated accord-ing to the guidelines set by the International Con-ference of Harmonization for validation of analyti-cal procedures [18, 19]. The precision and repro-ducibility of the proposed method were evaluated by performing replicate analysis of the standard solutions and serum samples, to determine intra-day and inter-intra-day variability [within intra-day (n = 5) and between days (n = 5)] for three different con-centrations. Relative standard deviations were cal-culated to obtain the precision of the method. The stock solution of Tirofiban was prepared by dis-solving 25 mg of Tirofiban reference standard in methanol and diluted with methanol to 25 ml. Working standard solutions were prepared by ap-propriate dilution with methanol to achieve final concentrations of Tirofiban (0.033 mg·ml–1, 0.1 mg·ml–1 and 0.21 mg·ml–1).
2.7. Recovery studies
To establish the accuracy and reliability of the proposed method, recovery experiments were carried out by adding known amounts of the stand-ard solution of Tirofiban to rat blood. Serum sam-ples were used for this study and collected from normal rats before introducing the experimental model of deep venous thrombosis (DVT) in order to obtain a validated quantitative method suitable to monitor the concentration of Tirofiban and po-tential degradation products in vivo after applica-tion. Aliquots of 1 ml rat blood samples were spiked with Tirofiban standard solution to achieve final concentrations of Tirofiban: 0.033 mg·ml–1, 0.1 mg·ml–1 and 0.21 mg·ml–1. The heparin was added as an anticoagulant. After heating in a water bath for 15 min., the tubes were centrifuged for 5 min at 3500 rpm min–1. The supernatant was taken carefully, methanol was added for the precipitation of proteins in the ratio serum:methanol = 1:3 and then the tubes were centrifuged again for 5 min at 3500 rpm min–1. The recoveries were calculated after five repeated experiments. The amount of Tirofiban in spiked rat serum samples was calcu-lated from the linear regression equation.
2.8. Limit of detection and limit of quantification
The limit of detection (LOD) and limit of quantitation (LOQ) were calculated using follow-ing formula: LOD = 3.3 SD/S and LOQ = 10 SD/S, where SD is the standard deviation of the response (peak area) and S is the slope of the cali-bration curve obtained.
2.9. Experimental animal model
In this study, male Wistar rats weighing 220–250 g were used. The rats were randomly assigned into two groups: a control group (n = 18) and a group with experimentally induced deep venous thrombosis (n = 18). They were housed in cages and maintained in a controlled environment with free access to food and water. The experi-mental animal model [3, 20] of venous thrombosis was induced by ligature of the femoral vein in rats. The hypercoagulability of blood was achieved by the intravenous administration of tissue thrombin [21, 22]. The rats were anaesthetized by intraperi-toneal injection of water solution of Nesdonal (concentration 20 mg/kg body weight). The i.v.
taken at 0, 5, 15, 30, 45, and 60 min post-dose in the presence of heparin and were collected in se-rum tubes. They were centrifuged at 3500 rpm min–1 for 5 min, then serum was harvested and kept at –20 °C until analyzed. Then, methanol was added for protein precipitation in the serum : meth-anol ratio (1 : 3). The tubes were then centrifuged again at 3500 rpm min–1 for 5 min and supernatant was injected into the HPLC column.
3. RESULTS AND DISCUSSION
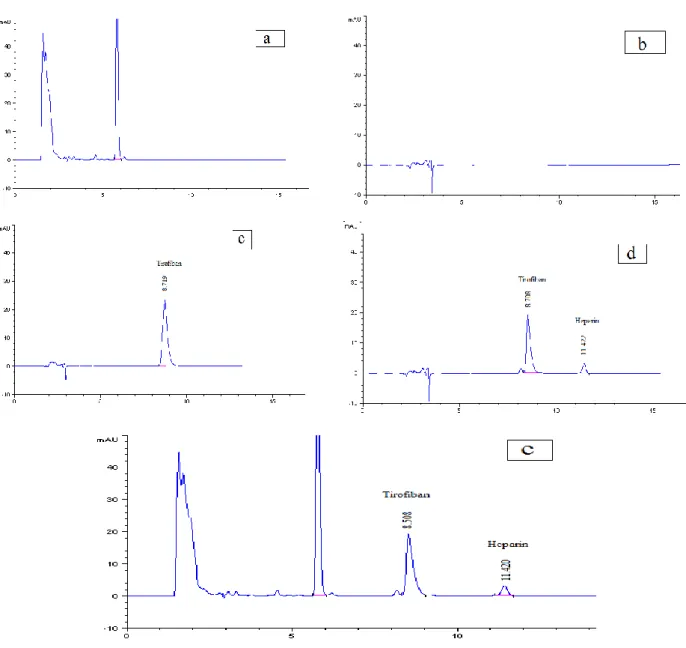
Initial experiments were carried out using the mobile phase consisting of 1-octane sulfonic acid in water and acetonitrile in different propor-tions and at different pH values. Mobile phase composition of 1-octane sulfuric acid in water (pH 3.0, adjusted with orthophosphoric acid) and ace-tonitrile (60:40, v/v) was found to be optimal for good peak resolution for Tirofiban and heparin with a retention time of 8.7 min and 11.4 min. for Tirofiban and heparin, respectively. The optimum wavelength for detection was 277 nm.
System suitability tests as an integral part of each analytical HPLC methods was performed
through evaluation of different parameters (reten-tion time, tailing factor, reten(reten-tion factor, resolu(reten-tion, and selectivity) on freshly prepared standard stock solutions of Tirofiban. The retention times of Tiro-fiban in methanol and rat serum samples were 8.7 and 8.6 min, respectively. Tailing and retention factors for Tirofiban were obtained as 1.13 and 1.21. Resolution factor for this system for Tirofi-ban and heparin was 3.50. The variation in reten-tion time of Tirofiban among five replicate injec-tions of standard solution in methanol and rat se-rum samples was very slight, giving the relative standard deviations (RSD %) of 0.54% and 0.73%, respectively.
The calibration characteristics and validation parameters of the proposed method are shown in Table 1. Linearity of response was calculated as a ratio of peak areas of Tirofiban vs. concentration in methanol and spiked serum samples in the concen-tration range of 0.033–0.21 mg·ml–1. Coefficient of correlation was greater than 0.99 for both media.
The results of precision, accuracy (recov-ery), and reproducibility (assay) of the method are shown in Table 2. They demonstrate a good preci-sion (determined as the RSD %), accuracy, and reproducibility.
T a b l e 1
Characteristics of the linear regression analysis
Methanol Rat serum
Linearity range (mg·ml–1) 0.033–0.21 0.033–0.21
Slope 3561.1 3041.8
Intercept –13.1235 –13.9671
Determination coefficient (r2)
0.9991 0.9983
SEa of the intercept 5.8008 6.7076
SE of the slope 43.4632 50.2579
Detection limit (mg·ml–1) 0.0053 0.0073 Quantification limit (mg·ml–1) 0.0163 0.0221 aSE – Standard error
T a b l e 2
Precision and accuracy of the method
Concentra-tion added (mg·ml–1)
Measured concentration (mg·ml–1)a
In methanol In rat serum
Intra-day Mean (mg·ml–1)
± RSD (%)
Inter-day Mean (mg·ml–1)
± RSD (%)
Intra-day Inter-day
Mean (mg·ml–1) ± RSD (%) Mean (mg·ml–1)
± RSD (%)
Recovery (%)
0.033 0.0329 ± 0.96 0.0318 ± 1.17 0.0315 ± 1.54 95.45 0.0309 ± 0.87
0.100 0.1023 ± 0.67 0.1025 ± 0.98 0.0985 ± 1.14 98.50 0.0974 ± 1.75
0.211 0.2137 ± 1.13 0.2123 ± 1.45 0.2045 ± 1.39 96.92 0.2019 ± 0.93
Figure 2a shows a typical chromatogram of the extract of the fresh blank serum sample. Figure 2b shows the chromatogram of methanol used as a solvent. Figure 2c shows a chromatogram of Tiro-fiban standard solution in methanol, while Figure 2d shows a chromatogram of Tirofiban standard solution with heparin in methanol. Figure 2e shows the chromatogram obtained when the same method was applied to spiked rat serum samples. There are no extraneous peaks from endogenous substances in chromatograms obtained in serum samples.
In our previous work [16], with a mobile phase containing of 0.1 M KH2PO4 (pH 5.2) and
acetoni-trile (70 : 30, v/v), the response was linear over the range of 0.03–0.18 mg·ml–1 and the limit of detection (LOD) for Tirofiban in rat serum was 13.8 μg ml–1.
In the proposed method, the response was linear over the range of 0.033–0.21 mg·ml–1 and
the LOD for Tirofiban in rat serum was twice as high (7.30 μg ml–1).
Heparin was detected in both methods, with no reflecting importance, but with significant sepa-ration from Tirofiban and without any effect on the calculation of results.
All of the obtained results confirm that the proposed method can be applied in the direct deter-mination of Tirofiban content in the serum. In our study, besides confirmation of the reciprocity of obtained results from the same injected dose in normal rats and rats with introduced experimental deep venous thrombosis, we attempted to present the impact of different concentration of Tirofiban during the same period. This was important to con-firm the biodistribution and fast clearance of Tirofi-ban in both groups and its potential availability to be used as a radioactive marker for the detection and definition of early deep venous thrombosis [23].
The low concentration of Тirofiban will not affect the fibrinogen binding to the GPIIb/IIIa re-ceptors, but will be enough to visualize the patho-logical deviations in the circulation [24]. In Table 2, we present the results obtained by HPLC analysis of the spiked serum samples with Tirofiban. Serum concentrations of Tirofiban (mg/l) in male rats with and without DVT, after single i.v. bolus dose of 0.6 mg/kg, measured after 5, 15, 30, 45 and 60 min, determined by HPLC, are shown in Figure 3.
We calculated the percent of Tirofiban as a function of time after i.v. bolus injection. The re-sults are presented in Table 3.
Fig. 3. Concentrations of Tirofiban (mg/l) in the serum of male rats with and without DVT, after single i.v. bolus dose of
0.6 mg/kg, measured after 5, 15, 30, 45 and 60 min.
T a b l e 3
The percent of Tirofiban in the serum of normal rat and rat with DVT after i.v. bolus injection
Time after injection (min) 0 5 15 30 45 60
Percent in the serum (%) after 0.6 mg/kg dose of Tirofiban
Control group 100,00 55,23 29,85 23,34 19,10 17,00
Experimental group
(rats with introduced DVT) 100,00 41,21 22,24 15,67 14,55 13,27
From the percent presented in Table 3, we can see the difference between samples obtained from normal rats and samples from rats with intro-duced fresh deep venous thrombosis. The results showed good agreement between two different groups of animals, but not between the different concentrations of injected Tirofiban. Here, 17% of injected doses found 60 minutes after injection in normal rats and the values of 13.27% in rats with DVT confirm the fast clearance of Tirofiban from the blood [14, 15]. Our results confirmed the vari-ability between different concentrations of Tirofi-ban and its metabolite in human samples, especial-ly those obtained from patients with earespecial-ly DVT [23]. In our study, we did not consider determining the serum concentration in humans, so this will be the goal of our next investigation, after receiving the satisfactory result after the first labeling of Tirofiban with radioactive isotopes [23]. The good correlation in serum concentrations of different concentrations of Tirofiban obtained from experimental animals and from patients with acute DVT, will contribute to the idea that radiolabeled Tirofiban can be introduce as a potential radiopharmaceutical.
4. CONCLUSION
The proposed RP-HPLC method is a simple, accurate, precise and rapid for the determination of Tirofiban in the serum. The developed HPLC method was fully validated by evaluation of the
validation parameters. Our results confirmed the aim of our study and showed the possibility of monitoring the concentration of Tirofiban in serum during the therapy, either given alone or in the presence of heparin.
In our study we did not envision determining the serum concentration in humans, so this will be the goal of our next investigation, after receiving satisfactory results regarding the first labeling of Tirofiban with radioactive isotopes. Further, we could contribute to the idea that Tirofiban as a GPIIb/IIa antagonist is a potential imaging phar-maceutical.
REFERENCES
[1] A. Giordano, A. D'Angelillo , S. Romano, P. D'Arrig, N. Corcione, R. Bisogni, S. Messina, M. Polimeno, P. Pep-ino, P. Ferraro, M. F. Romano, Tirofiban induces VEGF production and stimulates migration and proliferation of endothelial cells, Vascul Pharmacol., 61(2–3), 63–71 (2014).
[2] M. Hashemzadeh, M. Furukawa, S. Goldsberry, M. R. Movahed, Chemical structures and mode of action of in-travenous glycoprotein IIb/IIIa receptor blockers: A re-view, Exp Clin Cardiol., Winter; 13(4), 192–197 (2008). [3] L. L. Brunton, J. S. Lazo, K. Parker, Goodman and Gilman’s The Pharmacological Basis of Therapeutics, 11th ed.; The McGraw Hill Co., 2006.
[5] A. Kumar, H. C. Herrmann, Tirofiban: an investigational platelet glycoprotein IIb/IIIa receptor antagonist, Exp Opin Invest Drugs, 6, 1257–67 (1997).
[6] The Platelet Receptor Inhibition in Ischemic Syndrome Management in Patients Limited by Unstable Signs and Symptoms (PRISM-PLUS) Study Investigators. Inhibi-tion of the platelet glycoprotein IIb/IIIa receptor with Tirofiban in unstable angina and non-Q-wave myocardi-al infarction. N Engl J Med, 338, 1488–97 (1998). [7] The Study Investigators. Effects of platelet glycoprotein
IIb/IIIa blockade with Tirofiban on adverse cardiac events in patients with unstable angina or acute myocar-dial infarction undergoing coronary angioplasty. Circu-lation,96, 1445–53 (1997).
[8] L. Brass, Understanding and evaluating platelet func-tion, Hematology Am Soc Hematol Educ Program, 387– 396 (2010).
[9] http://www.accessdata.fda.gov/drugsatfda_docs/label/20 12/020912s018,0209 13s017lbl.pdf assessed on 24th of October, 2014.
[10] Anon, Tirofiban hydrochloride, Drugs Future,20, 897– 901 (1995).
[11] K. Kondo, K. Umemura, Clinical pharmacokinetics of Tirofiban, a nonpeptide glycoprotein IIb/IIIa receptor antagonist: comparison with the monoclonal antibody abciximab, Clin Pharmacokinet, 41(3), 187–95 (2002). [12] Medicure Pharma, Aggrastat (Tirofiban hydrochloride)
injection premixed and injection prescribing infor-mation, Somerset, NJ; Nov. (2007).
[13] http://www.accessdata.fda.gov/drugsatfda_docs/label/20 12/020912s018,0209 13s017lbl. pdf, assessed on 14th of July 2012.
[14] D. W. Bougie, P. R. Wilker, E. D. Wuitschick, B. R. Curtis, M. Malik, S. Levine, R. N. Lind, J. Pereira, R. H. Aster, Acute thrombocytopenia after treatment with Tiro-fiban or eptifibatide is associated with antibodies specific for ligandoccupied GPIIb/IIIa, Journal of the American Society of Hematology, 100(6), 2071–2076 (2002).
[15] R. Oertel, A. Köhler, A. Koster, W. Kirch, Determina-tion of Tirofiban in human plasma by liquid chromato-graphy-tandem mass spectrometry, J Chromatogr B An-alyt Technol Biomed Life Sci.,805(1), 181–5 (2004). [16] M. Darkovska Serafimovska, E. Janevik-Ivanovska, Z.
Arsova-Sarafinovska, I. Djorgoski, N. Ugresic, Develop-ment and validation of reversed phase high performance liquid chromatographic method for determination of Tiro-fiban in serum, Int J Pharm, 4(4), 115–120 (2014). [17] K. Sridevi Ranjitha, A. Lakshmana Rao, Development
and validation of new RP-HPLC method for the deter-mination of Tirofiban in pharmaceutical formulation,
IJPCBS, 1(1), 43–47 (2011).
[18] ICH Q2R1: Validation of Analytical Procedures: Text and Methodology. Proceeding of the International Con-ference on Harmonization of Technical Requirements for the Registration of Drugs for Human Use, Geneva, Switzerland, 1996.
[19] ICH, Guideline on Analytical Method Validation, Pro-ceeding of International Convention on Quality for the Pharmaceutical Industry, Toronto, Canada, 2002. [20] J. Lister-James, A. Mauer, Thrombus imaging with a
technetium 99m labeled, activated platelet receptor bind-ing peptide, J. Nucl. Med., 213, 207 (1996).
[21] J. W. Callas, D. D. J. Fareed, A survey of animal models to develop new and novel antithrombotic agents, New Therapeutic Agents in Thrombosis and Thrombolysis
(Sasahara, A. A., Loscalzo, J. L., Eds), 1997, 9–28. [22] J. M. Herbert, A. Bernat, J. P. Maffrand, Importance of
platelets in experimental venous thrombosis in the rat,
Blood,80 (9), 2281–2286 (1992).
[23] M. Darkovska Serafimovska, E. Janevik-Ivanovska, N. Ugresic, I. Djorgoski, Imaging of deep venous throm-bosis using radioactive-labeled tirofiban. Bratisl Med J, 116 (10), 621–626 (2015).