www.jyoungpharm.org | www.phcog.net
INTRODUCTION
The pharmaceutical industry works thrive for developing, manufacturing and introducing new drugs to the market, by satisfying the regulatory requirements which comply to the drug safety, identity, strength, purity and quality standards.1 Levocetirizine dihydrochloride is the R-enantiomer of Cetirizine. It is a second generation piperazine derivative with potent H1 selective, anti- histaminic or anti-allergic activities. It has a two-fold higher affinity for H1 receptors than cetirizine. The clinical efficacy of cetirizine and levocetirizine is comparable with a marginal advantage of better antipruritic effect of levocetirizine. The difference between these two drugs and traditional antihistamines such as Chlor-phenamine (chlorpheniramine), is a less sedative effect on the central nervous system.2Impinging new approaches in drug development arena will be helpful in enhancing efficiency by providing regulatory relief, flexibility, and offer substantial business benefits throughout the product’s lifecycle.3 Tablet compression is the subject of substantial research in Tablet formulation studies. Understanding compression mechanisms, identifying critical process and material parameters are often crucial for process development.4 FDA has reported a strategy as to how ANDA applicants can move towards implementation of Quality by Design approaches such as Response Surface methodology (RSM). Based on the desired quality attributes of the drug products, the inputs and process variables are stipulated. The product quality attributes that would be affected by compression include appearance, tablet weight, content uniformity, hardness, thickness, friability, Disintegration time and
Dissolution time. According to FDA’s case study, it has found that feeder speed variation may cause over-lubrication or inconsistent die filling while improper pre-compression force may cause lamination/capping. Also, the suboptimal compression force may affect tablet hardness, friability and, ultimately, dissolution. Turret speed may cause inconsistent die filling which may then impact hardness and disintegration, dissolu-tion, assay, content uniformity, friability, weight variability and appear-ance. Based on this risk assessment study it was found that feeder speed, precompression force, main compression force and Turret speed has a sound impact on tablet properties.5-8
Modeling and optimization of tablet compression parameters in phar-maceutical manufacturing and necessary supportive data, particularly in the present the industrial scenario is mainly dependent on Design of Experiments approach.9,10Response surface methodology (RSM) utilizes the combination of statistical and mathematical tools. It provides the individual and interactive effects of process variables (input variables) on the targeted output to model the process, usually by representation through non-linear regression equation. The effectiveness of modeling coupled optimization approach in pharmaceutical sector has been reported in several instances.11 Various studies on effects of tablet formulation and process parameters on tablet properties were evaluated and quantified by multivariate analysis techniques; principal component analysis (PCA) and partial least square regression’s(PLS).12-16 The Design of Experiment (DOE) as an essential element of the RSM paradigm, has
Utilization of Response Surface Methodology for Modeling and
Optimization of Tablet Compression Process
Vijay Kumar Garlapati1,Lakshmishri Roy2
1Department of Biotechnology and Bioinformatics, Jaypee University of Information Technology, Waknaghat – 173234, HP, INDIA. 2Department of Food Technology, Techno India,Kolkata, West Bengal - 700091, INDIA.
ABSTRACT
Rationale: Table compression process has a profound effect on different quality attributes of table manufacturing process such as appearance, content uniformity, hardness, thickness, friability, Disintegration time and Dissolution time. Among all the table compression parameters, feeder speed, precompression, main compression forces and Turret speed have a substantial effect on tablet properties. Aim: Statistical modeling and optimizationapproach has been utilized to model and optimize Levocetirizine tablet formulation compression process using Response Surface Method-ology. Methods: A 3-level Central Composite Design has been chosen by taking turret speed, pre & main compression forces and Feeder speed as input variables and tablet characteristics (hardness, thickness and disinte-gration time) as output variables. Results: Non-linear regression models have obtained with respective to output variables (hardness, thickness and disintegration time) with R2 values of 99.26%, 98.01% and 99.84% for hardness, thickness and disintegration time, respectively. The effect of individual, square and interaction terms on the table hardness, thickness and disintegration has been summarized through the significance test and depicted through response surface plots. An optimized tablet characteristic of 15.3 kP hardness, 3.7 mm thickness and 226 sec disintegration time have been obtained using predicted tablet compression process variables
of 68 rpm Turret speed, pre and main compression forces of 2.05 and 7.95 kN respectively and Feeder speed of 27 rpm. Conclusion: The results demonstrated the reliability of the proposed statistical approach to model and optimized the compression studies of levocetirizine tablet formulation. The present study helps in scale-up studies of tablet compression during Levocetirizine tablet formulation.
Key words: Central Composite Design, Levocetirizine, Optimization, Statistical Modeling, Tablet Compression.
Key message: The present study showcasing the profound effect of tablet compression parameters on the quality characteristics of Levocetirizine tablets through a modeling coupled optimization approach.
Correspondence :
Dr. Vijay Kumar Garlapati, Dept. of Biotechnology and Bioinformatics, Jaypee University of Information Technology, Waknaghat, HP-173234, INDIA
Phone: +91-1792-239225 Email: [email protected]
DOI: 10.5530/jyp.2017.9.82
been widely adopted in studies for many applications including risk assessment, process robustness and product design to improve industrial production efficacy.17-23 Hence, in the present study, we have utilized RSM approach to model and optimize the tablet compression step of Levocetirizine tablet formulation by taking turret speed, pre & main compression force and feeder speed as input variables and tablet charac-teristics (hardness, thickness and disintegration time) as output variables.
MATERIALS AND METHODS
Materials and equipment
Levocetirizine HCl was received as a gift sample from Symed lab Limited, Hyderabad, India. Magnesium stearate NF vegetable source (Ferro) was received as a gift sample from Biovams Pharmaceuticals Pvt. Ltd,
Ahmedabad, India. Lactose monohydrate EP, Microcrystalline cellulose NF ph102 and Croscarmellose sodium NF were procured from SD fine chemicals Ltd, Mumbai. Colloidal silicon dioxide NFCAB-O-SIL M5 was procured from Cabot Sanmar Ltd, Mumbai, and all the other reagents were of analytical grade. Two high Speeds single rotatory European make compression machines were used for the present study.
Methods
For screening and optimization purpose, a simple formulation was taken and used on two different high-speed rotary tablet presses. Parameters that are deemed insignificant at one machine may prove to be significant on the other machine. Similarly, operational limitation of the full- scale equipment must be considered when proposing the design space. The range of operating conditions and discontinuous configuration option makes it difficult to develop a tablet formulation that is sufficiently robust for all the various compression conditions because a solid formulation is not imparted by small process variation which is practically difficult to achieve.
Tablet compression methodology
A dry granulation process was used to prepare a blend of raw materials (except magnesium stearate) were sifted through #60 ASTM (American Society for Testing and Materials) using a Vibro Sifter .Pre-blending for 10 minutes was done using an Octagonal blender 150 L . Pre- blend materials have been sifted through #40 ASTM followed by blending for 10 minutes. Magnesium stearate was sifted through #60 ASTM followed by lubrication of blend materials with sifted magnesium stearate for 05 minutes. The present study has been conducted using two single sided rotatory high-speed compression machines as a model to show how DOE helps in optimizing a robust formulation (tablet) as an approach for implementation of RSM which improves the production efficiency.24 Tablets were compressed using ‘B’ tooling standard square shaped punch having diameter 8 millimeters.
RSM based modelling and optimization approach
Modeling coupled optimization approach facilitates the understanding of the process along with the enhanced yield through a selection of the optimized process variables. RSM was one of the approach for modeling and optimization tasks of pharmaceutical processes. In the present study, we have adopted a RSM approach for compression studies of Levoceti-rizine tablets formulation through central composite design (CCD) of Response Surface Methodology (RSM) and executed through MINITAB 14 software.
Selection of tablet compression parameters for central
composite design
Tablet compression studies are mainly dependent on process variables namely Turret speed (RPM), Pre-compression force (kN), Main
com-pression force (kN) and Feeder speed (RPM). The finished tablets were examined regarding hardness, thickness and disintegration time. Based on the one variable at a time approach, experimental results coupled with the literature survey and prior experience in statistical modeling, in the present study CCD was utilized for RSM approach by taking four
vari-ables of compression studies at three levels. In the present study
three-level, four factorial CCD design has been utilized by taking the tablet compression variables (Turret speed, Pre- compression force, Main compression force & Feeder speed) as input variables and Tablet Hardness, Tablet Thickness and Tablet Disintegration time as output variables. The range of four compression variables utilized for the present study was tabulated under Table 1. Based on the used range of input variables, the central composite design of RSM planned a design of experiment (DOE) set consists of 31 sets of experiments. The DOE set utilized in the present study shown in Table 2. The designed sets of experiments were executed through wet lab experiments and concerned output variables (Tablet hardness, Tablet thickness and Tablet disintegration time) were noted to each set.
Statistical analysis
Non-linear regression analysis was carried out based on the data collected as per CCD (Table 2) planning for response, namely hardness, thickness and disintegration time of tablets using MINITAB 14 software which resulted in a second-order polynomial equation by giving the effect of linear, square and interaction terms of process variables on the response. The non-linear relationship between a response and input variables has been represented by a polynomial quadratic equation (Eqn. 1) to describe the functional relationship between the response, Y and the input variables x1, x2---xk
β β β β
= = <
=
∑
+∑
2+∑∑
0
1 1
k k k
i i ii i ij i j i i i j
Y x x x x (Eq. 1)
The response include the linear terms x1, x2, …, xk, square terms x12, x 22, .., xk2, and interaction terms x
1x2, x1x3, .. , xk-1xk.
The coefficient of the non-linear regression model can be determined using the method of least squares. The effect of the parameters and their interaction terms on the response has been studied by conducting the significance tests, and Analysis of variance (ANOVA) has been carried out on each response to check the adequacy of the model.25 The detailed analysis of the effect of parameters and their interactions on the response was also done through the surface plots using MINITAB 14 software.
RESULTS AND DISCUSSION
Compression machine setting plays a major role in getting the desired tablet properties of tablet formulation process, which usually differs from formulation to formulation. In our experiment, we have consid-ered four machine setting parameters namely, turret speed, Pre and main
compression force and feeder speed. Usually, at higher turret speeds,
approach is a scientifically approved technique to model and optimize the process parameters.
The effect of tablet compression variables namely turret speed, pre & main compression forces and Feeder speed on tablet characteristics, i.e., hardness, thickness and disintegration time was investigated using RSM according to CCD.26The least squares technique has adopted for the
development of second-order polynomial equation, which gives the effect of individual, square and interaction terms of the tablet compression variables on the responses (Tablet hardness, Tablet thickness, and Tablet disintegration time).
Prediction of responses namely hardness, thickness and disintegration
time for the given values of turret speed, pre & main compression forces,
and Feeder speed have depicted through Eq. (2) – Eq. (4) as follows: The estimated non-linear Regression for Hardness (Kp) in un-coded- form is:
Hardness (Kp)= 48.3016-0.679279X1 -15.0765X2 - 0.278188X3 + 0.238967X4 + 0.00592000 X12 -1.40800X
22+0.354667X32 + 0.00302041X42 + 0.267500X
1X2 - 0.0741667X1X3 - 0.00982143X1X4 + 0.558333X2X3 + 0.0946429X2X4
+ 0.000595238X3X4 Eq.(2)
The estimated non-linear Regression for Thickness (mm) in un-coded form is:
Thickness (mm) = 2.12178 + 0.0506520 X1 - 0.276000X2 + 0.0661627X3 + 0.00892460X4 - 4.66667E - 04X12 + 0.0533333X
22 - 0.00962963X32 - 2.38095E-04X42 + 0.000250000X1X2 + 0.00108333X1X3+5.35714E - 05X1X4 – 0.00583333X2X3+0.00125000X2X4
-7.73810E-04X3X4 Eq.(3)
The estimated non-linear Regression for Disintegration time (sec) in un-coded form is:
Disintegration time (sec) = 1835.33 - 66.1165X1 + 41.7678X2 + 67.4797X3 + 17.9907X4 + 0.531787X12 - 30.8213X
22 - 1.86904X32 - 0.218476X
42 + 1.15000X1X2 - 0.483333X1X3 - 0.128571X1X4 + 5.50000X2X3 + 0.285714X2X4 - 0.190476X3X4 Eq.(4) Where X1, X2, X3 and X4 represents turret speed, pre-compression force, main compression force and Feeder speed respectively.
The prediction accuracy of the proposed models seems in close agreement of predicted and experimental values of CCD experiments (done in triplicates) (Table 2). The significance of individual, square, interaction terms of compression variables (X1, X2, X3 and X4) on tablet hardness, thickness and disintegration time have also deducted from the P-values of the significance test (Table 3). The P- value remains less than 0.5 by considering 95 % as a level of confidence for all factors except X12 & X
42 terms of tablet hardness and X2 & X1X4 terms of tablet thickness. Furthermore, the significance effect of linear, square and interaction terms on tablet hardness, thickness and disintegration time has been demonstrated by the ANOVA results (Table 4), where P-values of these terms have seemed to be lesser than the significant value level (α 0.05) except X12 & X
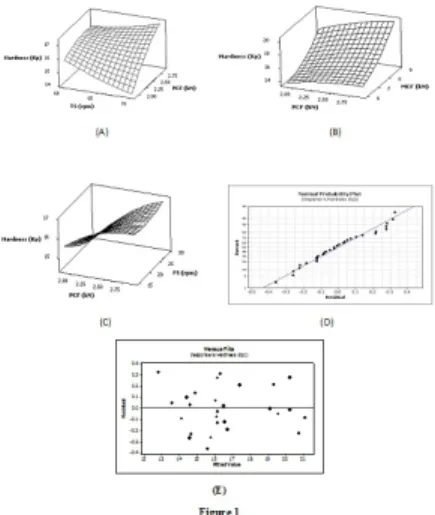
42 terms for tablet hardness and X1, X1X3 & X1X4 terms of tablet thickness. The fitness and adequacy of the proposed models are further demonstrated by the R2 and adjusted R2 values for tablet hardness (R2= 99.26%; Adj. R2=98.61%), tablet thickness (R2= 98.01%; Adj. R2 = 96.27%) and tablet disintegration time (R2= 99.84%; Adj. R2=99.70%). To understand the effect of the independent variables on the dependent variable, response surface plots of the quadratic polynomial model has generated by varying two of the independent variables within the experimental range while holding other variables kept constant at the central point.27 Figure 1 (a) shows the effect of turret speed (rpm) and pre-compression force (kN) on hardness (Kp). It revealed that increase
in (rpm turret speed) with pre-compression force (kN) resulted in progressive enhancement of hardness (Kp). Figure 1 (b) shows the effect of pre-compression force and main compression force on hardness (Kp). It demonstrated that maximum hardness (Kp) has obtained at the pre-compression force of 2.05 kN and main compression force of 7.95 kN. Figure 1 (c) showed the effect of pre-compression force and feeder speed on hardness (Kp). It showed maximum hardness (Kp) at the pre-com-pression force of 2.05 kN and feeder speed of 27 rpm.
The 3D response surface plots represent the regression equation. Figures 2 (a) - 2(c) represent the 3D response surface plots for the optimum conditions of tablet thickness (mm). Each figure represents the effect of two variables on thickness. Figure 2 (a) indicates that maximum thickness of 3.7 mm has obtained with a turret speed of 68 rpm and pre-compression force of 2.05 Kn. Figure 2(b) depicts that the maximum thickness has attained at using turret speed of 68 rpm and main
compres-Figure 1:Surface plots of Hardness (Kp) with: (A) Turret speed (RPM) and Pre-compression force (kN), , (B) Pre-compression force (kN) and Main- compression force (kN), (C) Pre-compression force (kN) and Feeder speed (RPM), (D)Normal % Probability and studentized residual plot for Hardness(E) The studentized residual and fitted response plot for hardness.
sion force of 7.95 kN. Figure 2 (c) similarly shows the effect of varying turret speed and feeder speed on thickness. Figures 3 (a) - 3 (c) represent the 3D response surface plots for the optimum conditions of disinte-gration time (sec). Each figure represents the effect of two variables on disintegration time (sec). Figure 3 (a) showed the effect of Pre-compres-sion force (kN) and Main-compresPre-compres-sion force (kN), Fig 3 (b) showed the effect of Pre-compression force (kN) and Feeder speed (RPM) and Figure 3 (c) showed the effect of Main-compression force (kN) and Feeder speed (RPM) on disintegration time (sec). Response surface plot analysis showed maximum disintegration time (sec) was observed at the pre-compression force of 2.05 kN, the main compression force of 7.95 kN and feeder speed of 27 rpm. The predicted non-linear equation of fitted response surface has also checked through diagnostic plots of Normal % probability Vs studentized residuals and Studentized residual Vs fitted response, for tablet hardness, tablet thickness and tablet thickness, which have depicted in Figure 1(C) & 1(D), Figure 2(C) & 2(D) and Figure 3 (C) & 3(D), respectively. The normal % probability and studentized residuals
plots, which have shown in Figure 1(C), Figure 2(C) and Figure 3 (C)
for hardness, thickness and disintegration time of tablet, respectively.
Usually, the studentized residuals measure the number of standard deviations separating the actual and predicted values. The residuals showed the how well the derived models satisfy the assumptions of analysis of variance (ANOVA). The studentized residuals and predicted tablet hardness, tablet thickness and tablet disintegration time have
depicted in Figure 1(D), Figure 2(D) and Figure 3 (D). Random scattered
these plots suggesting that the variance of original observations be constant for all values of the responses.28
Response surface optimizer function of MINITAB 14 has utilized for drawing the optimal responses with the predicted compression variables. An optimized tablet hardness of 15.2 Kp, tablet thickness of 3.57 mm and tablet disintegration time of 227 secs has proposed by utilizing the tablet compression variables of turret speed of 68 rpm, feeder speed of 27 rpm and Pre & main compression forces of 2.05 kN and 2.7 kN, respectively. The proposed set of tablet compression variables has chosen for experimental testing. The obtained tablet properties (15.3 Kp hardness, the thickness of 3.7 mm and 226 s of disintegration time) of triplicate experimental runs seemed to be in close agreement with the
predicted tablet properties. The enhanced results have reported through
the usage of RSM approach in the case of extended-release drug delivery of cefpodoxime proxetil by taking the amount of hydroxypropyl methylcellulose (HPMC K4M), sodium alginate (SA) and
microcrystal-line cellulose (MCC) as the variables.29 Bose et al., (2013) reported the
enhanced results for sustained release of Itopride HCl by utilizing
response surface methodology. 30
CONCLUSION
In the present study, the compression process of Levocetirizine has been modeled and optimized through RSM approach using compression parameters as input variables and tablet characteristics (hardness, thickness and disintegration time) as output variables. The optimum compression variables have determined as 68 rpm Turret speed, Pre-& main compres-sion force of 2.05kN, 7.950 kN respectively with Feeder speed of 27 rpm. Utilizing the optimum conditions, the compression process of Levoceti-rizine results in a tablet properties of 15.3 Kp hardness, 3.7 mm thickness and a disintegration time of 226S. The results obtained from this work clearly defined the baseline operating parameters that yield compatibility and reproducibility throughout production which is our first goal of this utilized RSM approach. Hence the outcome of this investigation of response optimization suggests it to be a valuable tool for similar processes. As compared to random experimentation, implementation of Design of Experiments with well designed statistical experiments improves the results.
ACKNOWLEDGEMENT
The authors gratefully acknowledge the Jaypee University of Information Technology, Techno India, and India for providing research facilities to VKG and LR, respectively.
CONFLICT OF INTEREST
The authors declared that they don’t have any conflict of interests in pub-lishing this article.
ABBREVIATION USED
ANDA: Abbreviated New Drug Application; ANOVA: Analysis of Vari-ance; CCD: Central Composite Design; DOE: Design of Experiments;
FDA: Food and Drug Administration; PCA: Principal Component
Analysis; PLS: Partial Least Squares; RSM: Response Surface Mehodol-ogy.
REFERENCES
1. Guidance Quality Systems Approach to cGMP Regulations, FDA, 2006.
2. Xyzal Drug information. Available from:http://www.rxlist.com/xyzal-drug.htm.
3. Moheb MN. Quality by Design (QbD): A Modern System Approach to Pharma-ceutical
4. Garlapati VK, Banerjee R. Evolutionary and swarm intelligence‐based approaches for optimization of lipase extraction from fermented broth. Engineering in Life Sciences. 2010;10(3):265-73. https://doi.org/10.1002/elsc.200900086.
5. Quality by Design for ANDAs: Immediate Release dosage forms, Example QBD IR Tablet Module 3 Quality 3.2.P.2 Pharmaceutical Development, 2012. Available from: http ://www.fda.gov/downloads//Drugs/.../UCM304305.pdf.
6. Quality by Design for ANDAs: Immediate Release Dosage Forms, FDA/GPhA Workshop draft example product development report, 2010. Available from: http://www.gphaonline.org/media/wysiwyg/PDF/Past_Events/2010/Example_ QbD_for_Generic_Drugs_2010_WORKSHOP_VERSION_3.pdf
7. The Pharmaceutics and Compounding Laboratory. Available from: http://pharm-labs.unc.edu/labs/tablets/evaluation.htm.
8. Mohan S. Compression physics of pharmaceutical powders: A review. Interna-tional Journal of Pharmaceutical Sciences and Research. 2012;3(6):1580.
9. Quality by design for ANDAs: An example for modified release dosage forms, FDA, 2011.
10. Chauhan M, Chauhan RS, Garlapati VK. Modelling and optimization studies
on a novel lipase production by Staphylococcus arlettae through submerged fermentation. Enzyme research. 2013. https://doi.org/10.1155/2013/353954; PMid:24455210 PMCid:PMC3880713
11. Haware RV, Tho I, Bauer-Brandl A. Application of multivariate methods to compression behavior evaluation of directly compressible materials. European Journal of Pharmaceutics and Biopharmaceutics. 2009;72(1):148-55. https:// doi.org/10.1016/j.ejpb.2008.11.008; PMid:19084596.
12. Haware RV, Bauer-Brandl A, Tho I. Comparative evaluation of the powder and compression properties of various grades and brands of microcrystal-line cellulose by multivariate methods. Pharmaceutical development and technology. 2010;15(4):394-404. https://doi.org/10.3109/10837450903262041; PMid:19772382.
13. Sirisha PL, Babu GK, Babu PS. Conceptuation, formulation and evaluation of sustained release floating tablets of captopril compression coated with gastric dispersible hydrochlorothiazide using 23 factorial design. International journal of pharmaceutical investigation. 2014;4(2):77. https://doi.org/10.4103/2230-973X.133055; PMid:25006552 PMCid:PMC4083537.
14. Dholariya YN, Bansod YB, Vora RM, Mittal SS, Shirsat AE, Bhingare CL. Design and optimization of bilayered tablet of Hydrochlorothiazide using the Quality-by-Design approach. International journal of pharmaceutical investiga-tion. 2014;4(2):93. https://doi.org/10.4103/2230-973X.133058; PMid:25006554 PMCid:PMC4083539.
15. Narayanan V, George P, Akshay L. Application of 3 2 Factorial D-Optimal Design in Formulation of Porous Osmotic Pump Tablets of Ropinirole; An Anti-Parkinson’s Agent. Journal of Young Pharmacists. 2017;9(1).
16. Shirsand SB, Suresh S, Keshavshetti GG, Swamy PV, Reddy PV. Formulation and optimization of mucoadhesive bilayer buccal tablets of atenolol using simplex design method. International journal of pharmaceutical investiga-tion. 2012;2(1):34. https://doi.org/10.4103/2230-973X.96924; PMid:23071958 PMCid:PMC3465156.
17. Renoux R, Demazieres JA, Cardot JM, Aiache JM. Experimentally designed optimization of direct compression tablets. Drug development and Industrial pharmacy. 1996;22(2):103-9. https://doi.org/10.3109/03639049609041979.
18. Bahr NM. A Design of Experiments for Tablet Compression. Pharma Technol. 2011;35: 1-8.
19. Myers RH, Montgomery DC, Anderson-Cook CM. Response Surface Meth-odology: Process and product optimization using designed experiments. New York: John Wiley & Sons; 2009.
20. Djuriš J, Medarevic D, Krstic M, Vasiljevic I, Mašic I, Ibric S. Design space
approach in optimization of fluid bed granulation and tablets compression process. The Scientific World Journal. 2012. https://doi.org/10.1100/2012/185085; PMid:22919295 PMCid:PMC3419407.
21. Mehta TJ, Mothilal M, Patel AD, Patel MR, Patel KP. Optimization of Granulation and Compression process Variables of Atenolol Tablets using Box-Behnken Design. International Journal of Drug Development and Research. 2011.
22. Ratnaparakhi MP, Chaudhari SP, Dhage KE, Dhiwar SB, Bhore SS. Optimization of Coating Formula and Critical Process Parameter for Aqueous Film Coating of Table. International Journal of Research in Pharmaceutical and Biomedical Sciences. 2012;3(4):1488-96.
23. Dhiman S, Verma S. Optimization of melt-in-mouth tablets of levocetirizine dihydrochloride using response surface methodology. International Journal of Pharmacy and Pharmaceutical Sciences. 2012;4(1):176-84.
24. Garlapati VK, Banerjee R. Evolutionary and swarm intelligence‐based approach-es for optimization of lipase extraction from fermented broth. Engineering in Life Sciences. 2010;10(3):265-73. https://doi.org/10.1002/elsc.200900086.
25. Watmough P. GSK “Implementation of quality by design in new pharmaceutical development” Q8, Q9, Q10 guideline. Available from: http://www.ich.org.
26. Bas D, Boyacı IH. Modeling and optimization I: Usability of response surface methodology. Journal of food engineering. 2007 ;78(3):836-45. https://doi. org/10.1016/j.jfoodeng.2005.11.024.
27. Wardrop DM, Myers RH. Some response surface designs for finding optimal conditions. Journal of statistical planning and inference. 1990;25(1):7-28. https://doi.org/10.1016/0378-3758(90)90003-D.
28. Anderson-Cook CM, Borror CM, Montgomery DC. Response surface design evaluation and comparison. Journal of Statistical Planning and Inference. 2009;139(2):629-41. https://doi.org/10.1016/j.jspi.2008.04.004; https://doi. org/10.1016/j.jspi.2008.04.009.
29. Mujtaba A, Ali M, Kohli K. Statistical optimization and characterization of pH- independent extended-release drug delivery of cefpodoxime proxetil using Box–Behnken design. Chemical Engineering Research and Design. 2014;92(1):156-65. https://doi.org/10.1016/j.cherd.2013.05.032.
30. Bose A, Wong TW, Singh N. Formulation development and optimization of sustained release matrix tablet of Itopride HCl by response surface meth-odology and its evaluation of release kinetics. Saudi Pharmaceutical Journal. 2013;21(2):201-13. https://doi.org/10.1016/j.jsps.2012.03.006; PMid:23960836 PMCid:PMC3744972.
Article History: Submission Date : 18-03-2017; Revised Date : 17-04-2017; Acceptance Date : 04-05-2017.