44
BASICS SEQUENTIAL ALGORITHMIC SCHEME
CLUSTERING BY EXPLORING INTER AND INTRA TASK
CO-RELATIONS
M.Parthiban1,P.Damodharan2 PG Scholar1, Associate professor2
[email protected]1, [email protected]2
Department of Computer Science and Engineering Akshaya College of Engineering and Technology, Coimbatore ABSTRACT
Clustering, as one of the most classical research problems in pattern recognition and data mining, has been widely explored and applied to various applications. Due to the rapid evolution of data on the Web, more emerging challenges have been posed on traditional clustering techniques: 1) correlations among related clustering tasks and/or within individual task are not well captured; 2) the problem of clustering out-of-sample data is seldom considered; and 3) the discriminative property of cluster label matrix is not well explored. In this paper, It propose a novel clustering model, namely multitask spectral clustering (MTSC), to cope with the above challenges. Specifically, two types of correlations are well considered: 1) inter task clustering correlation, which refers the relations among different clustering tasks and 2) intra task learning correlation, which enables the processes of learning cluster labels and learning mapping function to reinforce each other. It incorporate a novel 2,p-norm regularizer to control the coherence of all the tasks based on an assumption that related tasks should share a common low-dimensional representation. Moreover, for each individual task, an explicit mapping function is simultaneously learnt for predicting cluster labels by mapping features to the cluster label matrix. It explore and discuss the relationships between proposed model and several representative clustering techniques. In MTSC method overlaps are occurs so its gives the lower accuracy .To overcome this problem BSAS Clustering (Basic Sequential algorithmic scheme) is used. The order in which the vectors are presented to the BSAS plays an important role in the clustering results. Different presentation ordering may lead to totallydifferent clustering results, in terms of the number of clusters as well as the clusters themselves.
Index terms: Cluster analysis, Multi tasking, BSAS,MTSC
1.INTRODUCTION 1.1 OVERVIEW
Clustering, as one of the most classical research problems in pattern recognition and data mining, has been widely explored and applied to various applications. Due to the rapid evolution of data on the Web, more emerging challenges have been posed on traditional clustering techniques: 1) correlations among related clustering tasks and/or within individual task are not well captured; 2) the problem of clustering out-of-sample data is seldom considered; and 3) the discriminative property of cluster label matrix is not well explored. In this
45
an explicit mapping function is simultaneously learnt for predicting cluster labels by mapping features to the cluster label matrix. In MTSC method overlaps are occurs so its gives the lower accuracy .To overcome this problem BSAS Clustering (Basic Sequential algorithmic scheme) is used.The order in which the vectors are presented to the BSAS plays an important role in the clustering results. Different presentation ordering may lead to totally different clustering results, in terms of the number of clusters as well as the clusters themselves.Meanwhile, we show that the learning process can naturally incorporate discriminative information to further improve clustering performance. We explore and discuss the relationships between our proposed
model and several representative clustering
techniques, including spectral clustering, k-means and discriminative k-means.
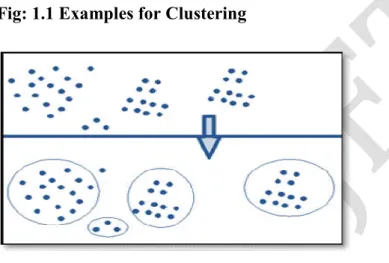
Fig: 1.1 Examples for Clustering
2.LITERATURE SURVEY 2.1 Mining Image
Xin-Jing Wang, Lei Zhang presented aAnnotating Images by Mining Image Search Results.
Although it has been studied for years by the computer vision and machine learning communities, image annotation is still far from practical. In this paper, we propose a novel attempt at model-free image annotation, which is a data-driven approach that annotates images by mining their search results. Some 2.4 million images with their surrounding text are collected from a few photo forums to support
this approach. The entire process is formulated in a divide-and-conquer framework where a query keyword is provided along with the uncaptioned image to improve both the effectiveness and efficiency. This is helpful when the collected data set is not dense everywhere. In this sense, our approach contains three steps: 1) the search process to discover visually and semantically similar search results, 2) the mining process to identify salient terms from textual descriptions of the search results, and 3) the annotation rejection process to filter out noisy terms yielded by Step 2. To ensure real-time annotation, two key techniques are leveraged—one is to map the high-dimensional image visual features into hash codes, the other is to implement it as a distributed system, of which the search and mining processes are provided as Web services. As a typical result, the entire process finishes in less than 1 second. Since no training data set is required, our
approach enables annotating with unlimited
vocabulary and is highly scalable and robust to outliers.
2.2 Cluster Analysis for Gene Expression Data
46
data points within a group are more similar to each other than the points in different groups. A very rich literature on cluster analysis has developed over the past three decades. In particular, we divide cluster analysis for gene expression data into three categories. Then, we present specific challenges pertinent to each clustering category and introduce several representative approaches. We also discuss the problem of cluster validation in three aspects and review various methods to assess the quality and reliability of clustering results. Finally, we conclude this paper and suggest the promising trends in this field.
2.3 Image Segmentation
Jianbo Shi and Jitendra Malik presents a
Normalized Cuts and Image Segmentation.It propose a novel approach for solving the perceptual grouping problem in vision. Rather than focusing on local features and their consistencies in the image data, our approach aims at extracting the global impression of an image. It treat image segmentation as a graph partitioning problem and propose a novel global criterion, the normalized cut, for segmenting the graph. The normalized cut criterion measures both the total dissimilarity between the different groups as well as the total similarity within the groups. It show that an efficient computational technique based on a generalized eigenvalue problem can be used to optimize this criterion. This approach to segmenting static images, as well as motion sequences, and found the results to be very encouraging.
2.4 Web Document Clustering
Khaled M. Hammouda presents aEfficient Phrase-Based Document Indexing for Web Document Clustering. Document clustering techniques mostly rely on single term analysis of the document data set, such as the Vector Space Model. To achieve
more accurate document clustering, more
informative features including phrases and their weights are particularly important in such scenarios. Document clustering is particularly useful in many applications such as automatic categorization of
documents, grouping search engine results, building a taxonomy of documents, and others. This paper presents two key parts of successful document clustering. The first part is a novel phrase-based document index model, the Document Index Graph, which allows for incremental construction of a phrase-based index of the document set with an emphasis on efficiency, rather than relying on single-term indexes only. It provides efficient phrase matching that is used to judge the similarity between documents. The model is flexible in that it could revert to a compact representation of the vector space model if we choose not to index phrases. The second part is an incremental document clustering algorithm based on maximizing the tightness of clusters by carefully watching the pair-wise document similarity distribution inside clusters. The combination of these two components creates an underlying model for robust and accurate document similarity calculation that leads to much improved results in Web document clustering over traditional methods.
3.RESEARCH ANDMETHODOLOGY
3.1 EXISTING SYSTEM
3.1.1.MULTITASK LEARNING
47
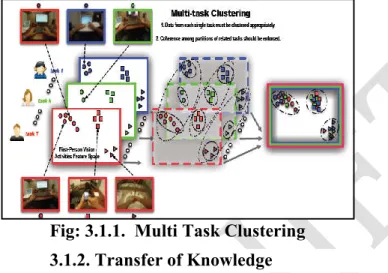
The goal of MTL is to improve the performance of learning algorithms by learning classifiers for multiple tasks jointly. This works particularly well if these tasks have some commonality and are generally slightly under sampled. One example is a spam-filter. Everybody has a slightly different distribution over spam or not-spam emails (e.g. all emails in Russian are spam for me—but not so for my Russian colleagues), yet there is definitely a common aspect across users. Multi-task learning works, because encouraging a classifier (or a modification thereof) to alsperformwell on a slightly
different task is a better regularization than
uninformed regularizers (e.g. to enforce that all weights are small).
Fig: 3.1.1. Multi Task Clustering 3.1.2. Transfer of Knowledge
Until recently, robots have not been capable of
understanding and coping with unstructured
environments (like the ones humans work in) because their systems have relied on knowing in advance the specifics of every possible situation they might encounter. Each response to a contingency has had to be programmed in advance, and systems have had to rebuild their world model from sensor data each time they had to perform a new task
The aim of project RoboEarth is to use the Internet to create a giant open source network database that can be accessed and continually updated by robots around the world. With knowledge shared via the cloud on such a vast scale, and with businesses and academics contributing independently on a common language platform, RoboEarth has the potential to
provide a powerful feed forward to any robot’s 3D sensing, acting and learning capabilities.
3.1.3 Task Grouping and Overlap
In the paradigm of multi-task learning, multiple related prediction tasks are learned jointly, sharing information across the tasks. One can also use a framework for multi-task learning that enables one to selectively share the information across the tasks. Assume that each task parameter vector is a linear combination of a finite number of underlying basis tasks.
3.2 Exploiting Unrelated Tasks
One can attempt learning a group of principal tasks using a group of auxiliary tasks, unrelated to the principal ones. In many applications, joint learning of unrelated tasks which use the same input data can be beneficial. The reason is that prior knowledge about which tasks are unrelated can lead to sparser and more informative representations for each task, essentially screening out idiosyncrasies of the data distribution..
3.3 Regularization
Regularization, in mathematics and statistics and
particularly in the fields of machine
learning and inverse problems, refers to a process of introducing additional information in order to solve an ill-posed problem or to prevent overfitting. This information is usually of the form of a penalty for complexity, such as restrictions forsmoothness or bounds on the vector space norm.A theoretical justification for regularization is that it attempts to impose Occam's razor on the solution. From a Bayesian point of view, many regularization
techniques correspond to imposing
certain prior distributions on model parameters.
3.4 Regularization in statistics and machine learning
48
variants in machine learning
are L₁ and L₂ regularization, which can be added to
learning algorithms that minimize a loss
function E(X, Y) by instead minimizing E(X, Y) + α‖w‖, where w is the model's weight vector, ‖·‖ is either the L₁ norm or the squared L₂ norm, and α is a free parameter that needs to be tuned empirically (typically by cross-validation; see hyperparameter optimization). This method applies to many models. When applied inlinear regression, the resulting models are termed lasso or ridge regression, but
regularization is also employed in (binary
and multiclass) logistic regression, neural
nets, support vector machines, conditional random
fields and some matrix
decomposition methods. L₂ regularization may also be called "weight decay", in particular in the setting of neural nets.
L₁ regularization is often preferred because it produces sparse models and thus performs feature selection within the learning algorithm, but since the L₁ norm is not differentiable, it may require changes to learning algorithms, in particular gradient-based learners.[1][2]
Bayesian learning methods make use of a prior probability that (usually) gives lower probability to more complex models. Well-known model selection
techniques include the Akaike information
criterion (AIC), minimum description length (MDL),
and the Bayesian information criterion (BIC).
Alternative methods of controlling overfitting not involving regularization include cross-validation.
Regularization can be used to fine-tune model complexity using an augmented error function with cross-validation. The data sets used in complex models can produce a levelling-off of validation as complexity of the models increases. Training data sets errors decrease while the validation data set error remains constant. Regularization introduces a second factor which weights the penalty against more complex models with an increasing variance in the data errors. This gives an increasing penalty as model complexity increases.
3.5 Applications 3.5.1. Spam Filtering
Using the principles of MTL, techniques for
collaborative spam filtering that facilitates
personalization have been proposed. In large scale open membership email systems, most users do not
label enough messages for an individual
local classifier to be effective, while the data is too noisy to be used for a global filter across all users. A hybrid global/individual classifier can be effective at absorbing the influence of users who label emails very diligently from the general public. This can be accomplished while still providing sufficient quality to users with few labeled instances.
3.5.2. Advantages of multi task clustering:
In multi-task learning (MTL), multiple tasks are learnt jointly. A major assumption for this paradigm is that all those tasks are indeed related so that the joint training is appropriate and beneficial.
3.6 PROPSED SYSTEM
3.6.1. Basic Sequential Algorithmic Scheme
The basic sequential algorithmic scheme (BSAS) is a very basic clustering algorithm that is easy to understand. In the basic form vectors are presented only once and the number of clusters is not known at priori. What is needed is the dissimilarity measured as the distance d (x, C) between a vector point x and a clusterC, threshold of dissimilarity Θ and the number of maximum clusters allowed q. The idea is to assign every newly presented vector to an existing cluster or create a new cluster for this sample, depending on the distance to the already defined clusters.
49
too large a value is chosen less than required number of clusters are formed.
One detail is that if q is not defined the algorithm ‘decides’ the number of clusters on its own. This might be wanted under some circumstances but when dealing with limited resources a limited q is usually chosen. Also, BSAS can be used with a similarity function simply by replacing the min function with max.
There exists a modification to BSAS called modified BSAS (MBSAS), which runs twice through the samples. It overcomes the drawback that a final cluster for a single sample is decided before all the clusters have been created. The first phase of the algorithm creates the clusters (just like 2b in BSAS) and assigns only a single sample to each cluster.
3.6.2. Cluster analysis
Cluster analysis or clustering is the task of grouping a set of objects in such a way that objects in the same group (called a cluster) are more similar (in some sense or another) to each other than to those in other groups (clusters). It is a main task of exploratory data mining, and a common technique for statistical data analysis, used in many fields,
including machine learning, pattern
recognition, image analysis, information retrieval, and bioinformatics.
Cluster analysis itself is not one specific algorithm, but the general task to be solved. It can be achieved by various algorithms that differ significantly in their notion of what constitutes a cluster and how to efficiently find them. Popular notions of clusters include groups with small distances among the cluster members, dense areas of the data space, intervals or particular statistical distributions. Clustering can therefore be formulated as a multi-objective optimization problem. The appropriate
clustering algorithm and parameter settings
(including values such as the distance function to use, a density threshold or the number of expected clusters) depend on the individual data set and intended use of the results. Cluster analysis as such
is not an automatic task, but an iterative process
of knowledge discovery or interactive
multi-objective optimization that involves trial and failure. It will often be necessary to modify data pre-processing and model parameters until the result achieves the desired properties.
3.6.3. Definition
The notion of a "cluster" cannot be precisely defined, which is one of the reasons why there are so many clustering algorithms.[4] There is a common denominator: a group of data objects. However, different researchers employ different cluster models, and for each of these cluster models again different algorithms can be given. The notion of a cluster, as found by different algorithms, varies significantly in its properties. Understanding these "cluster models" is key to understanding the differences between the various algorithms. Typical cluster models include:
Connectivity models: for
example hierarchical clustering builds models based on distance connectivity.
Centroid models: for example the k-means
algorithm represents each cluster by a single mean vector.
Distribution models: clusters are modeled
using statistical distributions, such
as multivariate normal distributions used by the Expectation-maximization algorithm.
Density models: for
example DBSCAN and OPTICS defines clusters as connected dense regions in the data space.
A "clustering" is essentially a set of such clusters, usually containing all objects in the data set. Additionally, it may specify the relationship of the clusters to each other, for example a hierarchy of clusters embedded in each other. Clusterings can be roughly distinguished as:
hard clustering: each object belongs to a
50
soft clustering (also: fuzzy clustering): each object belongs to each cluster to a certain degree (e.g. a likelihood of belonging to the cluster)
3.6.4. Main category:Data clustering algorithms
Clustering algorithms can be categorized based on their cluster model, as listed above. The following overview will only list the most prominent examples of clustering algorithms, as there are possibly over 100 published clustering algorithms. Not all provide models for their clusters and can thus not easily be categorized. An overview of algorithms explained in Wikipedia can be found in the list of statistics algorithms.
There is no objectively "correct" clustering algorithm, but as it was noted, "clustering is in the eye of the beholder."The most appropriate clustering algorithm for a particular problem often needs to be
chosen experimentally, unless there is a
mathematical reason to prefer one cluster model over another. It should be noted that an algorithm that is designed for one kind of model has no chance on a data set that contains a radically different kind of model.[4] For example, k-means cannot find non-convex clusters.
3.6.5. Connectivity based clustering (hierarchical clustering)
Connectivity based clustering, also known
as hierarchical clustering, is based on the core idea of objects being more related to nearby objects than to objects farther away. These algorithms connect "objects" to form "clusters" based on their distance. Popular choices are known as single-linkage
clustering (the minimum of object
distances), complete linkage clustering (the
maximum of object distances)
or UPGMA("Unweighted Pair Group Method with Arithmetic Mean", also known as average linkage clustering). Furthermore, hierarchical clustering can be agglomerative (starting with single elements and aggregating them into clusters) or divisive (starting
with the complete data set and dividing it into partitions).
These methods will not produce a unique partitioning of the data set, but a hierarchy from which the user still needs to choose appropriate clusters. They are not very robust towards outliers, which will either show up as additional clusters or even cause other clusters to merge (known as "chaining phenomenon", in particular with single-linkage clustering). In the general case, the
complexity is for agglomerative clustering
and for divisive clustering,[5] which
makes them too slow for large data sets. For some special cases, optimal efficient methods (of
complexity ) are known: SLINK[6] for
single-linkage and CLINK for complete-single-linkage clustering. In the data mining community these methods are recognized as a theoretical foundation of cluster analysis, but often considered obsolete. They did however provide inspiration for many later methods such as density based clustering.
3.7 Density-based clustering
In density-based clustering, clusters are defined as areas of higher density than the remainder of the data set. Objects in these sparse areas - that are required to separate clusters - are usually considered to be noise and border points.
The most popular[10] density based clustering
51
times. OPTICS is a generalization of DBSCAN that removes the need to choose an appropriate value for the range parameter , and produces a hierarchical result related to that of linkage clustering.
DeLi-Clu,Density-Link-Clustering combines ideas
from single-linkage clustering and OPTICS,
eliminating the parameter entirely and offering performance improvements over OPTICS by using an R-tree index.
CHAPTER 4
EXPERIMENTAL RESULT
In this subsection, we first compare the proposed MTSC model to several baselines and state-of-the-art multitask clustering algorithms in terms of training performance and testing performance. We fix p = 1 for our proposed MTSC model. Tables II– V demonstrate all the comparison results, from which we have the following observations and analysis.
DKM performs better than TKM in almost all the cases since it is a joint framework incorporating discriminative dimension reduction and clustering together , which might make each cluster more identifiable and thus improve the clustering performance. Such observation implies it is beneficial to take discriminative information into clustering.
SEC is able to achieve comparable results compared to other single-task methods. For DKM, TKM and NCut, SEC performs better in most cases. We believe that it owes to the integration of discriminative information. CLGR, which is one of the state-of-the-art spectral clus- tering, surpasses SEC. This is mainly because CLGR possesses more tunable parameters than our method, which in turn makes it more sensitive.
MTSC consistently outperforms SEC over all the datasets and tasks. This outcome illustrates that the inter- task relationships are well captured and indeed help to improve the clustering performance.
All the multitask clustering algorithms are able to
achieve comparable performance, which is
consistent with the existing outcomes . Especially,
for both Rec.vs.Talk and Comp.vs.Sci, LSSMTC, LSKMTC and LNKMTC achieve similar or even better results as in their original work . MTSC always achieves the best results among all the comparison clustering algorithms, including both
single- task and multitask methods. 4.1 MTSC
(Multitask Spectral Clustering)
In MTSC (Multitask Spectral Clustering) there were the inter task correlations are identified in the
unsupervised way in the random matched
correlations, so that the clusters labels are most accurate. In this proposed study Sequential clustering is going to perform with the priority based correlation clustering. This proposed idea provides to a most accurate spectral clustering results. This sequential prediction finds the important labels between the multi tasks.
4.2 BSAS (Basic Sequential Algorithmic Scheme)
The basic sequential algorithmic scheme
52
Fig 4.2 Architecture Diagram
If is too small unnecessary clusters are created and if too large a value is chosen less than required number of clusters are formed.
One detail is that if q is not defined the algorithm ‘decides’ the number of clusters on its own. This might be wanted under some circumstances but when dealing with limited resources a limited q is usually chosen. Also, BSAS can be used with a similarity function simply by replacing the min function with max.
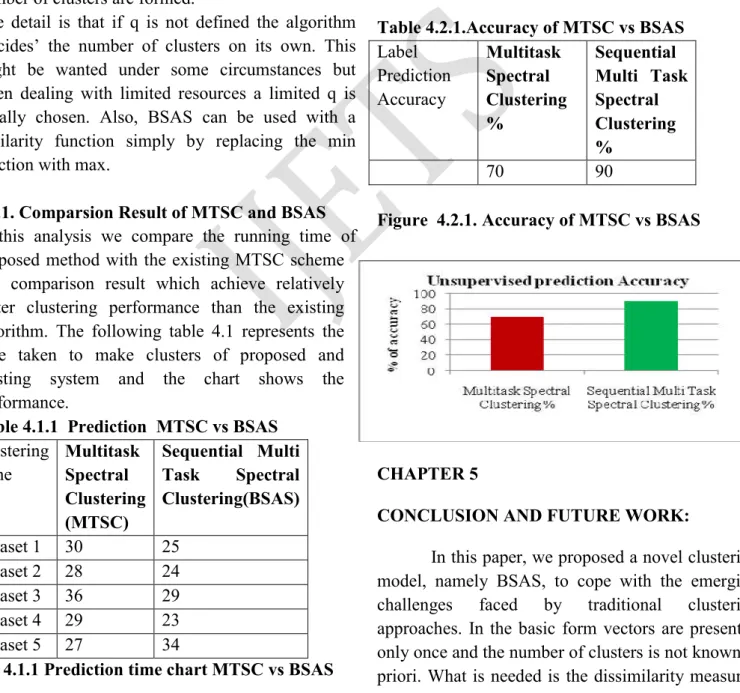
4.1.1. Comparsion Result of MTSC and BSAS
In this analysis we compare the running time of proposed method with the existing MTSC scheme and comparison result which achieve relatively better clustering performance than the existing algorithm. The following table 4.1 represents the time taken to make clusters of proposed and existing system and the chart shows the performance.
Table 4.1.1 Prediction MTSC vs BSAS
Clustering Time
Multitask Spectral Clustering (MTSC)
Sequential Multi Task Spectral Clustering(BSAS)
Dataset 1 30 25
Dataset 2 28 24
Dataset 3 36 29
Dataset 4 29 23
Dataset 5 27 34
Fig 4.1.1 Prediction time chart MTSC vs BSAS
4.2.1 Accuracy Comparison:
Accuracy of sequential inter task clustering is compared with the existing MTSC scheme and the results show that the proposed scheme gives better accuracy. The following table 4.3 and fig 4.4 shows the implemented result.
Table 4.2.1.Accuracy of MTSC vs BSAS
Label Prediction Accuracy
Multitask Spectral Clustering %
Sequential Multi Task Spectral Clustering %
70 90
Figure 4.2.1. Accuracy of MTSC vs BSAS
CHAPTER 5
CONCLUSION AND FUTURE WORK:
In this paper, we proposed a novel clustering model, namely BSAS, to cope with the emerging
challenges faced by traditional clustering
approaches. In the basic form vectors are presented only once and the number of clusters is not known at priori. What is needed is the dissimilarity measured Task 1
Task 2
Task 3 Inter task
correlation
Inter task
correlation Inter task
53
as the distance d (x, C) between a vector point x and a cluster C, threshold of dissimilarity Θ and the number of maximum clusters allowed q. The idea is to assign every newly presented vector to an existing cluster or create a new cluster for this sample, depending on the distance to the already defined clusters. Moreover, for each individual task, an explicit mapping function was learnt by mapping features to the cluster label matrix. We discussed the connections between our proposed model and
several representative clustering techniques,
including spectral clustering, k-means and DKM. Extensive experiments on various real-world datasets illustrated the advantage of the proposed BSAS model over the state-of the-art clustering approaches. In future, will introduced MBSAS clustering algorithm to reduce the process time and increase the accuracy.
REFERENCES
[1] A. Jain, M. Murty, and P. Flynn, “Data clustering: A
review,” ACM
Comput.Surv.
[2] A. Strehl and J. Ghosh, “Cluster ensembles—A knowledge reuse frame- work for combining multiple partitions,”
[3] C. Li, E. Chang, H. Garcia-Molina, and G. Wiederhold, “Clustering for
approximate similarity search in high-dimensional spaces,”. [4] C. Liu, W. Hsaio, C. Lee, and F. Gou, “Semi-supervised linear discriminantclustering,” .
[5] C. Ding and T. Li, “Adaptive dimension reduction using discriminant
analysis and k-means clustering,”.
[6] C. Fowlkes, S. Belongie, F. Chung, and J. Malik, “Spectral grouping using the Nystrom method,”
[7] D. Jiang, C. Tang, and A. Zhang, “Cluster analysis for gene expression
data: A survey,”
[8] D. Meng, Y. Leung, and Z. Xu, “Detecting intrinsic loops underly- ing data manifold,”
[9] F. De la Torre and T. Kanade, “Discriminative cluster analysis,”
[10] F. Nie, D. Xu, I. Tsang, and C. Zhang, “Spectral
embedded clustering,”
[11] F. Wang, C. Zhang, and T. Li, “Clustering with local and
global regular- ization,”
[12] I. S. Dhillon, Y. Guan, and B. Kulis, “Kernel k-means:
Spectral cluster- ing and normalized cuts,”
[13] J. C. Bezdek, Pattern Recognition with Fuzzy Objective Function Algorithms.
[14] J. Shi and J. Malik, “Normalized cuts and image segmentation,”.
[15] J. Jia, N. Yu, and X. Hua, “Annotating personal albums via web mining,”.
[16] J. Li and J. Wang, “Real-time computerized annotation of pictures,”.
[17] J. Ye, Z. Zhao, and H. Liu, “Adaptive distance metric learning for clustering,”.
[18] K. Hammouda and M. Kamel, “Efficient phrase-based
document indexingfor web document clustering,” .
[19] L. Zelnik-Manor and P. Perona, “Self-tuning spectral clustering,”
[20] L. Sigal, A. O. Balan, and M. J. Black, “HumanEva: Synchronized video and motion capture dataset and baseline algorithm for evaluation of articulated human motion,” [21] L. Zelnik-Manor and P. Perona, “Self-tuning spectral clustering,”
[22] L. Saul and S. Roweis, “Think globally, fit locally: Unsupervised learning of low dimensional manifolds,
[23] M. Filippone, F. Camastra, F. Masulli, and S. Rovetta, “A survey of
kernel and spectral methods for clustering,”
[24] M. Belkin, P. Niyogi, and V. Sindhwani, “Manifold regularization:
A geometric framework for learning from labeled and unlabeled examples,”.
[25] M. Belkin and P. Niyogi, “Laplacianeigenmaps for dimensionality reduction and data representation,”
[26] M. Wu and B. Scholkopf, “A local learning approach for clustering,”
[27] P. Felzenszwalb and D. Huttenlocher, “Efficient
graph-based image segmentation,”.
[28] Q. Gu and J. Zhou, “Learning the shared subspace for multi-task clus- tering and transductive transfer classification,” [29] Q. Gu, Z. Li, and J. Han, “Learning a kernel for multi-task cluster- ing,”
[30] S. Yu and J. Shi, “Multiclass spectral clustering,”. [31] S. Xie, H. Lu, and Y. He, “Multi-task co-clustering via
nonnegative matrix factorization,”
[32] S. Kong and D. Wang, “A multi-task learning strategy for unsuper- vised clustering via explicitly separating the commonality,”
[33] S. Gordon, H. Greenspan, and J. Goldberger, “Applying the information
bottleneck principle to unsupervised clustering of discrete and continuous
image representations,”.
.[34] W. Dai, Q. Yang, G.-R. Xue, and Y. Yu, “Self-taught clustering,”
[35] X. Wang, L. Zhang, X. Li, and W. Ma, “Annotating images by mining