Cooperative Eigenvalue-Based Spectrum Sensing Performance Limits
Under different Uncertainty
A. H.Ansari
E&TC Department
Pravara Rural Engineering College Loni
B. A.Pangavhane
E&TC Department
Pravara Rural Engineering College Loni
Abstract—In this contribution,proposed a technique for collaborative sensing based on the analysis of the normalized largest eigenvalues of the sample covariance matrix. Assuming that several base stations are cooperating and without the knowledge of the noise variance, the test is able to determine the presence of mobile users in a network when only few samples are available. Unlike previous heuristic techniques, also showed that the test has roots within the GLRT and provide an asymptotic random matrix analysis enabling to determine adequate threshold detection values (probability of false alarm).A collaborative spectrum sensing system with a fusion center, which utilizes the eigenvalues of the sample covariance matrix for detection, is investigated. On the example of two widely known detectors, shows that imperfect calibration with respect to the noise powers of the receivers leads to a so called SNR wall in eigenvalue-based detectors. The SNR wall manifests itself as an SNR threshold below which detection becomes impossible even if the number of samples tends to infinity. It quantify the performance limits of the detectors in question by deriving lower bounds on the SNR wall and verify them by numerical evaluation. The results show that a very large number of cooperating receivers is needed to enable detection at very low SNRs, which are customary in spectrum sensing. Also in this paper we compared all parameters in Eigenvalue based detector with other spectrum sensing techniques.
Keywords—eigenvalue-based spectrum sensing, cooperative spectrum sensing, SNR walls, noise uncertainty
I. INTRODUCTION
Spectrum sensing is a central issue in cognitive radio (CR) systems and has attracted great research interest in the last decade. In particular, sensing techniques based on the eigenvalues of the received sample covariance matrix (see, for instance, recently emerged as a promising solution, as they do not require a priori assumptions on the signal to be detected, and typically outperform the popular energy detection method when multiple sensors are available.
Eigenvalue baseddetection (EBD) schemes can be further divided into two categories: methods that assume knowledge of noise level, and methods that do not assume this knowledge. Methods belonging to the first class provide better performance when the noise variance is known exactly, whereas second methods are more robust to uncertain or varying noise level [11].
In cognitive radios, the secondary users are allowed to use the spectrum which is originally allocated to primary users as far as primary users are not using it temporarily. It is known as opportunistic spectrum access (OSA). To avoid harmful interference to the primary users, the Secondary unlicensed users have to perform spectrum sensing before transmission over the spectrum. Spectrum sensing is a process in which secondary unlicensed users keep sensing the spectrum to determine whether the PU is transmitting or not. While detecting if PU is absent than the SUs can use those frequencies for transmission. This will help to increase overall spectrum utilization and also in turn increase the spectrum efficiency [6].
The scarcity of available spectral resources presents a major challenge for the advance of future wireless communication technologies, where increasing data rates is a key demand. One of the proposed strategies for overcoming this problem is dynamic spectrum access, in which unlicensed secondary users (SUs) utilize frequency bands when the licensees, the primary users (PUs), are not using it. Obviously, it is of utmost importance to ensure reliable detection of the presence of PUs, in order to avoid interference for the licensed primary system. Observing a frequency band in order to decide its occupancy status is known as spectrum sensing.
A very widely known approach that requires no knowledge about the PU signal is energy detection (ED). While this detector is very elegant due to its simplicity, its performance it limited severely under uncertainty of the receiver noise power. Another class of spectrum sensing detectors that rely on the assumption that receiver noise is uncorrelated is called eigenvalue-based detection (EVD). As the name suggests, they evaluate the eigenvalues of the sample covariance matrix for detection. Several different detectors have been proposed. Widely known is the maximum-minimum eigenvalue (MME) detector and the
generalized likelihood ratio test (GLRT). It is commonly claimed that these detectors are immune to the receiver noise uncertainty problem.
While there has been an intensive work on the spectrum sensing problem in the case of known noise variance, not enough attention has been made to the spectrum sensing under unknown noise variance except. Eigen value detector techniques currently are used in communications and their effectiveness have been shown in different aspects [10]. In the context of dynamic spectrum sharing, Eigen value detector SU can be used for a reliable signal transmission and also spectrum sensing. In fact, using this techniques in CRs is one of possible approaches for the spectrum sensing by exploiting available spatial domain observations. In [10], the authors have shown the efficiency of Eigen value detector spectrum sensing in terms of required sensing time and hardware by using a two-stage sensing method. The PU signal has been treated as an unknown deterministic signal and based on this model the performance of the energy detector has been evaluated in Rayleigh fading channels.
In this paper, we investigate the spectrum sensing problem by using Eigen value detector when the PU signal can be well modeled as a complex Gaussian random signal in the presence of an Additive White Gaussian Noise (AWGN). We derive the Eigen value detector structure for spectrum sensing and investigate its performance. This detector needs to know the noise and PU signal variances, and also the channel gains. In practice one or more of these parameters may be unknown, so in what follows we derive the Generalized Likelihood Ratio Test (GLRT) detector when some or all of these parameters are unknown.
Whether uncertainties in the receiver noise powers may lead to an SNR wall in a cooperative EVD system, however, is still an open problem. In this work, we will answer this question by showing that imperfect calibration will result in an SNR wall. Furthermore, we will quantify the performance limits of two widely known detectors by deriving lower bounds on the SNR wall. For this, a commonly used system model ispresented in Section II and the basics of EVD as well as a summary of relevant results about SNR walls in spectrum sensing are given in Sections III and IV, respectively. We introduce a noise calibration uncertainty model in Section V for this investigation.In Section VI, we present some numerical results to evaluate the performance of the GLR detectors
II. SYSTEM DESIGN
We study a spectrum sensing scenario of K cooperating SUs,that strive to determine the occupancy status of a frequency band. Their goal is to determine whether the frequency band in question is currently in use by its PU or not, i.e., to distinguish between two hypotheses based on
discrete complex baseband samples. The hypothesis test can be stated as
𝐻0 : 𝑦 𝑡 = 𝑤 𝑡
𝐻1 : 𝑦 𝑡 = ℎ𝑠 𝑡 + 𝑤 𝑡 (1)
Due to the stationarity of the random processes, the average receiver signal-to-noise ratio (SNR) is constant for the sensing interval and can be defined as
∝=
𝐸 ℎ𝑠(𝑡) 2 2 𝐸 𝑤 𝑡 22=
𝜎𝑠2 ℎ 2 2 K𝜎𝑤2 (2)This system model is widely used for the analysis of EVD system.
In general, let Tbe the test statistic employed by the detector to distinguish between H0 and H1: several possible
test statistics will be examined throughout the paper. To make the decision, the detector compares T against a pre-defined threshold t: if T > t it decides for H1, otherwise for H0. As a consequence, the probability of false alarm is
defined as
Pfa= Pr(T > t|H0)(3)
and the probability of detection as
Pd= Pr(T > t|H1)(4)
Usually, the decision threshold t is determined as a functionof the target false-alarm probability, to ensure ―constant falsealarmrate (CFAR)‖ detection. The corresponding detection probability (or the missed-detection probability Pmd= 1−Pd) is also very important for CR
networks where the interference caused by an opportunistic user to primary users must be very limited.
In this we are comparing Eigen value Based Detection with Energy detection method and Cyclostationary detection method.
A.Energy Detection
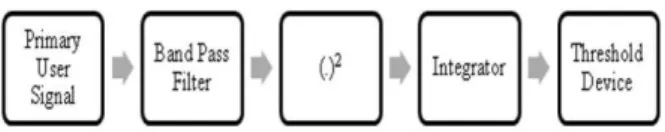
If CR can’t have sufficient information about primary user’s waveform, then the matched filter is not the optimal choice. However if it is aware of the power of the random Gaussian noise, then energy detector is optimal [2]. The authors proposed the energy detector as shown in Fig.1. The input band pass filter selects the center frequency Fsand bandwidth of interest W. The filter is followed by a squaring device to measure the received energy then the integrator determines the observation interval, T. Finally the output of the integrator, Y is compared with a threshold, to decidewhether primary user is present or not.
Figure 1: Block Diagram of Energy Detection Advantages of the Energy Detection method are it is having low operating cost and low complexity, The probability of making decision is faster. It can cause less delay relative to use, it does not require prior knowledge on the received signal.
Disadvantages of this method are high sensing time taken to achieve a given probability, detection performance is subject to the uncertainty of noise power, using Energy Detection technique it is difficult to distinguish primary signals from the CR user signals.
B.Cyclostationary Feature Detection
If we consider the noise uncertainty, cyclostationary detection is preferable than the energy detection technique. This technique mostly depends on cyclostationary attributes like mean and autocorrelation. This method outperforms the energy detection method, particularly for low SNR values. Suppose if any signal is showing the periodicity property then those signals is called Cyclostationary signals.
The block diagram of cyclostationary feature detection is described in below figure.
Figure 2 : Block diagram of cyclostationary feature detection technique
Advantages of cyclostastionary detection method are Robust to noise uncertainties and performs better than energy detection in low SNR regions, In cyclostationary though we need priori knowledge of the signal characteristics however it is capable of distinguishing the CR transmissions from various types of PU signals, Synchronization requirement of energy detection in cooperative sensing is eliminated using this technique, Improves the overall CR throughput.
Disadvantages of this method are High computational complexity,Long sensing time.
III. EIGENVALUE-BASED DETECTION
Eigenvalue Based detection is also called blind spectrum sensing technique. This method mostly used at low SNR values. Eigenvalue based detection mainly according to the Eigenvalues of the received signal covariance matrix at the SU’s. In EVBD the detection
threshold value can be calculated on the basis of the random matrix theory. By using this method we can achieve a detection probability high and false alarm probability small without knowing the data of PU signal, noise power and channel information. Hence noise uncertainity drawback can be overcome by this method unlike ED.
A typical assumption in communication systems is that receiver noise is uncorrelated among time and between multiple receivers. In contrast to that, a noisy signal that is oversampled at a single receiver or is simultaneously perceived at multiple receivers shows correlation. This feature is exploited in eigenvalue-based detection by estimating the covariance matrix and calculating a test statistic based on its eigenvalues. The statistical covariance matrix of the received signal is
𝑅0= 𝑅𝑤under𝐻0
𝑅𝑦 = 𝐸 𝑦 𝑡 𝑦𝐻 𝑡 = (5)
𝑅1= 𝑅𝑥+ 𝑅𝑤under𝐻1
In a practical system, the statistical covariance matrix is estimated by the sample covariance matrix, which can be calculated as
𝑅𝑦 = 1 𝑁𝑌𝑌
𝐻. (6)
In the following, we will introduce two eigenvalue-based detectors that will be utilized in this work.
A. Maximum-Minimum Eigenvalue (MME)
The first work to utilize eigenvalues of the sample covariance matrix for detection in the spectrum sensing context was the maximum-minimum eigenvalue (MME) detector introduced. As a test statistic the ratio of the largest and the smallest eigenvalue of ˆR y is used:
𝑇
𝑀𝑀𝐸=
max 𝜆min 𝜆
=
𝜆𝐾𝜆1
.
(7)B. Generalized Likelihood Ratio Test (GLRT)
A detector which depends on the ratio of the ratio of the largest eigenvalue and the trace of the sample covariance matrix. It can also be derived as the generalized likelihood ratio test (GLRT) for the system model. We will utilize the detector in an equivalent form in this work, that can be found by realizing that the trace of a matrix can be expressed as the sum of its eigenvalues and utilizing a monotonous nonlinear transformation to gain the test statistic, 𝑇𝐺𝐿𝑅𝑇 = max 𝜆 𝜆𝑗 𝐾 −1 𝑗 =1 = 𝜆𝐾 𝜆𝑗 𝐾 −1 𝑗 =1 . (8)
IV. SNR WALLS IN SPECTRUM SENSING To achieve tractable results, performance analysis of detectors is typically performed on simplified models, such as the one from Section II. In a practical application, however, the detector must face the entire complexity of a real world scenario. There, some parameters of the model can never be known exactly. Instead they are only available as estimates up to a finite precision. These uncertainties in the model lead to fundamental limits in detection performance, which cannot be overcome by increasing the sensing time, even if the number of samples tends to infinity. The SNR below which the detector will fail to robustly detect a signal under the model uncertainties in question is called the SNR wall To formally define the SNR wall. Instead of modeling the components of the system with fixed distributions / processes, each component (signal, noise & channel) is allowed to follow any distribution / process S`belonging to a set, which captures the relevant uncertainties of said component. That is, the PU signal process s(t) may follow any distribution S €S. This can by analogously defined for the channel process as H €H and the noise process W €W. Let Tbe any test statistic to be used for block detection operating on N samples with a given threshold, then the probability of false-alarm PFA and the probability of missed detection PMD depending on the tuple (W, S,H) are defined as
𝑃𝐹𝐴 𝑊 = 𝑃 𝑇 ≥ 𝛾 𝐻0, 𝑊 ,(9)
𝑃𝑀𝐷 𝑊, 𝑆, 𝐻 = 𝑃 𝑇 ≥ 𝛾 𝐻0, 𝑊, 𝑆, 𝐻 . (10)
Eigenvalue-based detectors relying on the largest eigenvalue for detection, like the MME and the GLRT detector, require a minimum SNR for detection such that the largest eigenvalue under H0 and H1.
V.NOISE CALIBRATION UNCERTAINTY IN COOPERATIVE EIGENVALUE-BASED
DETECTION
For a cooperative system, knowledge of the noise powers is not needed if and only if the noise powers of the receivers are exactly the same. Otherwise, a calibration step must be performed to scale the noise powers of the receivers to a common level to set the threshold. Particularly problematic is the fact that the Sus may reside in different geographical locations with diverse environmental characteristics like temperature, humidity and electromagnetic interference that influence the noise powers of the receivers. In this work, we analyze the influence of a mismatch in noise power calibration of a cooperative eigenvalue-based spectrum sensing system. This models the
remaining uncertainty about the noise powers after imperfect calibration and its influence on the detectors.
VI. RESULTS
In this section, we present some numerical results to evaluatethe performance of the proposed detectors.
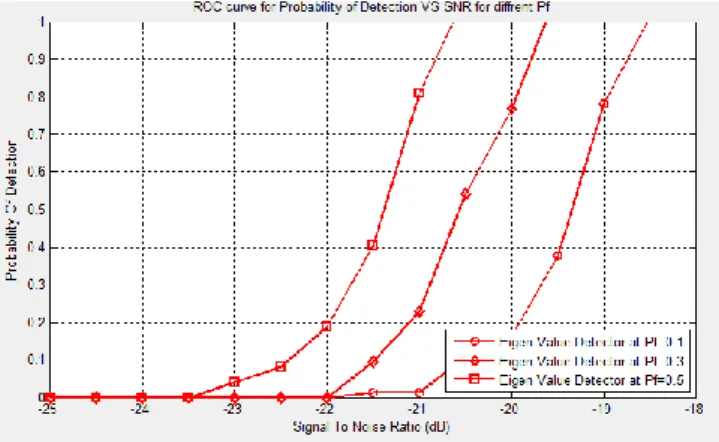
Fig.3 depicts the PDvs SNR for different value of PF. As can be observed, by increasing the SNR the value of PF is also increases and that improves the performance of the detectors. Fig.4 provide the results of PD Vs PF different value of SNR. As we increase the value of PF with respect to that the value of PD get increases.One approach to improve the performance in the fading channels, is to use collaborative spectrum sensing. By collaboration among the SUs, the deleterious effect of fading can be mitigated and a more reliable spectrum sensing can be achieved. In fact, in collaborative spectrum sensing, the SUs use the available spatial diversity to improve their performance.
Fig 3. PD vs SNR at different PF value of Eigen value Detector
Fig 4. PD vs PF at different SNR value of Eigen value Detector
VII. CONCLUSION
In this paper, we have analyzed the effect of noise calibration uncertainties in a cooperative spectrum sensing system operating with a fusion center. These results provide a performance evaluation of two important detection techniques in cognitive radio systems, and can be used for an accurate design of spectrum sensing parameters (number of sensors and samples) given a target false alarm detection rate imposed by standards. The investigation was performed on the example of two widely known detectors (MME & GLRT), which operate on the eigenvalues of the sample covariance matrix. It is shown that the GLRT is more resilient to noise power calibration uncertainties compared to the MME on average, however, the worst-case lower bounds for the SNR wall of both detectors are equal. More generally, it can be concluded that a very large number of cooperating nodes is needed in the presence of noise calibration uncertainties to successfully detect signals at very low SNRs, which are prevalent in spectrum sensing. Also in this we compared all parameters in Eigenvalue based detector with other spectrum sensing techniques.
Authors
Abdul Hameed Ansari is ME and pursuing his Phdin communication JDIET, Yavatmal under SGBAU Amravati. He is currently working as an Associate Professor in Pravara Rural Engineering College Loni, Ahmednagar, under Savitribai Phule Pune University. His field of intrestis wireless communication engg and cognitive radio.
Bhakti A. Pangavhane is pursuing Master of Engineering in VLSI and Embedded System in Pravara Rural Engineering College Loni, Ahmednagar, under Savitribai Phule Pune University. Her field of intrest is wireless communication engg and cognitive radio.
References
1. Q. Zhao and B. M. Sadler, ―A Survey of Dynamic Spectrum Access,‖ IEEE Signal Processing
Magazine, vol. 24, pp. 79–89, May 2007.
2. E. Axell, G. Leus, E. G. Larsson, and H. V. Poor, ―Spectrum sensing for cognitive radio: State-of-the-art and recent advances,‖ IEEE SignalProcessing Magazine, vol. 29, no. 3, pp.
101–116, 2012.
3. H. Urkowitz, ―Energy detection of unknown deterministic signals,‖ Proceedings of the IEEE, vol. 55, pp. 523–531, Apr. 1967.
4. R. Tandra and A. Sahai, ―SNR Walls for Feature
Detectors,‖ in 2nd
IEEE International Symposium
on New Frontiers in Dynamic Spectrum Access Networks, 2007. DySPAN 2007, pp. 559–570, Apr.
2007.
5. R. Tandra and A. Sahai, ―SNR Walls for Signal
Detection,‖ IEEE Journal of Selected Topics in
Signal Processing, vol. 2, pp. 4–17, Feb.2008.
6. Y. Zeng and Y.-C. Liang, ―Maximum-minimum eigenvalue detection for cognitive radio,‖ in IEEE
18th Annual International Symposium onPersonal, Indoor and Mobile Radio Communication, vol. 7,
(Athens, Greece), pp. 1–5, 2007.
7. Y. Zeng, Y.-C. Liang, and R. Zhang, ―Blindly combined energy detection for spectrum sensing in cognitive radio,‖ IEEE Signal Processing Letters, vol. 15, pp. 649–652, 2008.
8. P. Bianchi, J. Najim, G. Alfano, and M. Debbah, ―Asymptotics of eigenbased collaborative sensing,‖ in Proceedings of the IEEE InformationTheory
Workshop (ITW’09), 2009.
9. A. Taherpour, M. Nasiri-kenari, and S. Gazor, ―Multiple antenna spectrum sensing in cognitive radios,‖ IEEE Transactions on Wireless Communications, vol. 9, pp. 814–823, Feb. 2010.
10. B. Nadler, F. Penna, and R. Garello, ―Performance of Eigenvalue-Based Signal Detectors with Known and Unknown Noise Level,‖ in 2011 IEEE
International Conference on Communications (ICC), pp. 1–5, June 2011.
11. P. Dhakal, D. Rivello, F. Penna, and R. Garello, ―Impact of noise estimation on energy detection and eigenvalue based spectrum sensing algorithms,‖ in 2014 IEEE International Conference on Communications (ICC), pp. 1367–