THE USE OF MICROARRAY DATA INTEGRATION
TO IMPROVE CANCER PROGNOSIS
Zhe Zhang
A dissertation submitted to the faculty of the University of North Carolina at Chapel Hill in partial fulfillment of the requirements for the degree of Doctor of Philosophy in the Department of Biomedical Engineering.
Chapel Hill
2006
Approved by
Advisor: David Fenstermacher
Advisor: Henry Hsiao
Reader: Dechang Chen
Reader: Jeffrey MacDonald
Reader: David Threadgill
ABSTRACT
ZHE ZHANG: The Use of Microarray Data Integration to Improve Cancer Prognosis (Under the direction of David Fenstermacher)
Microarray is a high-throughput technology used to simultaneously measuring the
expression of thousands of genes in each sample. Therefore, it has the potential to benefit the treatment of complicated diseases like cancer. This study made efforts to improve the
application of microarray technologies to clinical medicine with two separate, but related phases. The first phase dealt with the generation of clinically valuable expression profiles from microarray data. By re-analyzing several published cancer datasets, we first confirmed that microarray data presented extra information about prognosis of cancer patients beyond currently used indexes such as tumor size. At the same time, it was noticed that those indexes generally confounded the correlation between gene expression and cancer outcome, so the contents of expression profiles were highly dependent on the clinical background of sample patients. Consequently, integrating multiple datasets was revealed by this study to obtain more general and reproducible cancer expression profiles. A novel data analysis procedure incorporating bootstrap re-sampling and training/testing validation was performed to impartially compare strategies of expression profiling. The results illustrated that after two independent datasets were integrated, the resultant expression profiles more correctly differentiated cancer patients in terms of disease outcome.
The second phase of this study was to develop MAMA (Meta-Analysis of MicroArray), a data mining platform for conveniently collecting, managing, and analyzing multiple
microarray datasets altogether. The complete MAMA system included three components: a relational database storing microarray cancer datasets; a web server providing the access to the database; and a client-side application implementing data manipulation and analysis methods. MAMA had an open-source framework allowing other developers to plug in their own data analysis methods. Moreover, it made cross-dataset analysis possible by
ACKNOWLEDGEMENTS
To my family (father Guozhong Zhang, mother Ming Zhu, sister Wei Zhang, and wife Yanye Maggie Li in particular), without who I could not finish this work.
My special gratitude goes to Dr. David Fenstermacher, who has always been there to advice and inspire me all these years. I also thank Dr. Lauren Gollahon for giving precious supporting during my first two years in US.
TABLE OF CONTENTS
Page LIST OF TABLES...x LIST OF FIGURES...xi Chapter I INTRODUCTION...1 II BACKGROUND...72.1 Gene Expression Profiling of Cancer Tissues...7
2.2 Microarray Standards, Databases, and Software...18
III METHODS...24
3.1 Data Analysis...24
3.1.1 Datasets and Data Pre-processing...24
3.1.2 SEP: Score for Expression Profile...26
3.1.3 Correlation Analysis...26
3.1.5 Rank Sum Test...28
3.1.6 Logistic Regression Model...29
3.1.7 ROC Curve...29
3.1.8 Bootstrap Re-sampling...30
3.1.9 Gene Categorization According to Gene Ontology...31
3.2 MAMA Project...32 3.2.1 Developmental Stages...32 3.2.2 Data Models...32 3.2.3 Relational Database...33 3.2.4 Server Program...33 3.2.5 Client Program...34 3.2.6 File Formats...35
3.2.7 Open Source Framework...36
3.2.8 Meta-analysis Methods...36
IV Results and Discussions...38
4.1 Data Analysis...38
4.1.1 Pilot Studies...38
4.1.1.1 Confounding Effect of Clinical Indexes...38
4.1.1.2 Partial Correlation Analysis...43
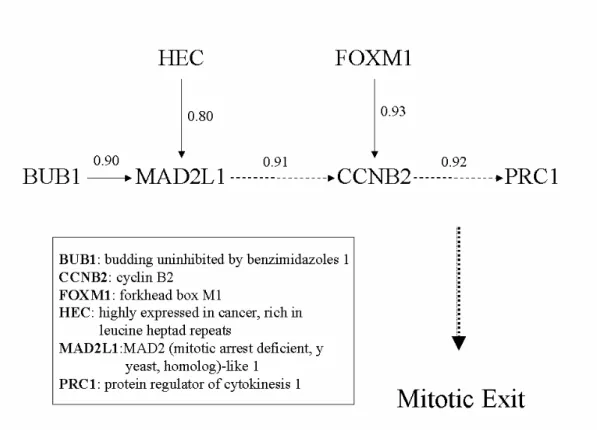
4.1.1.3 Case Study: a Gene Regulatory Pathway...45
4.1.2 Expression Profiling Using Multiple Datasets...50
4.1.2.1 Analysis of Individual Datasets...50
4.1.2.2 Cross-validation of Two Datasets...56
4.1.2.3 Combination of Individual Datasets...59
4.1.2.4 Results from Lung Cancer Datasets...66
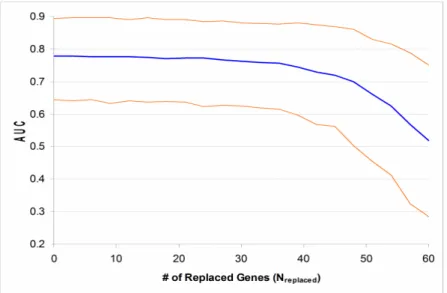
4.1.3 Sensitivity vs. Specificity of Reporter Gene Selection...71
4.2 MAMA Project...75
4.2.1 Project Requirements and Use Cases...75
4.2.2 Design of MAMA System...80
4.2.2.1 Software Development Environment...80
4.2.2.2 System Architecture...82
4.2.2.3 Database Schema...84
4.2.2.4 Data Flow...87
4.2.2.5 Software Architecture...89
4.2.2.6 Graphical User Interface...94
4.2.3 Data Annotation...96
4.2.4 Working with Data Objects...98
4.2.4.1 Workspace...99
4.2.4.2 Query...100
4.2.4.4 Analysis...105
4.2.5 Implementation of Analysis Methods...105
V Conclusion...109
5.1 Data Analysis...110
5.2 MAMA Project...116
APPENDICES Appendix A Demo of Data Analysis Steps Using a Pseudo-dataset...109
Appendix B Sample Class Diagrams of MAGE-OM...117
Appendix C Architecture of Tomcat/Servlet Server...119
Appendix D Architecture of MVC Design Pattern...121
Appendix E Meta-analysis Methods...123
Appendix F Complete Lists of Reporter genes...126
Appendix G Requirements of MAMA Project...139
Appendix H User Cases of the MAMA Client Program...148
Appendix I Client-server Communication Protocol of the MAMA System...160
Appendix J Database Schema of MAMA project...163
Appendix K Specification for Pre-processing of Expression Data...164
Appendix L Mapping between XML Elements and Java Data Objects...170
Appendix M Glossary...171
LIST OF TABLES
Page Table
1. Microarray Datasets Used in This Study...25
2. Chi-square Tests on SEP Scores and Clinical Indexes...41
3. Comparison of SEP and Clinical Indexes Using Logistic Regression Models...44
4. Correlation of Genes in a Cell Cycle Pathway to Breast Cancer Recurrence...49
5. Bootstrapping Test Statistics Collected from 10,000 Re-samplings...53
6. Cross-validation of Expression Profiles Derived from Breast Cancer Datasets...57
7. Comparison of Prognostic Indexes using Logistic Regression Models...58
8. Examples: Reporter Genes of 3-year Breast Cancer Recurrence...63
9. Example: ‘Create Workspace’ Use Case...77
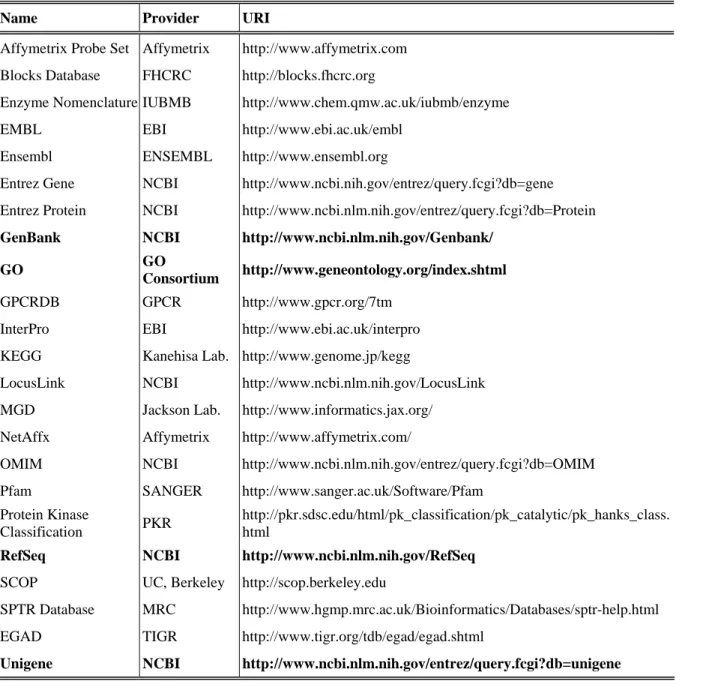
10. Data Annotation Resources...97
LIST OF FIGURES
Page Figure
1. Density Distribution of SEP Scores...40
2. Confounding Effect of Clinical Index on Gene-Outcome Correlation...42
3. Clustering of 127 Reporter Genes and 78 Breast Cancer Patients...46
4. A Cell Cycle-related Pathway Revealed by Partial Correlation Analysis...48
5. Bootstrapping Statistics Separately Obtained from Breast Cancer Datasets...55
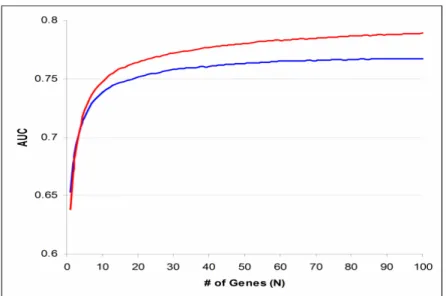
6. Comparison of Expression Profiling Strategies...61
7. Comparison of Reporter Selection Consistence...61
8. Mapping of Reporter Genes to Gene Ontology...65
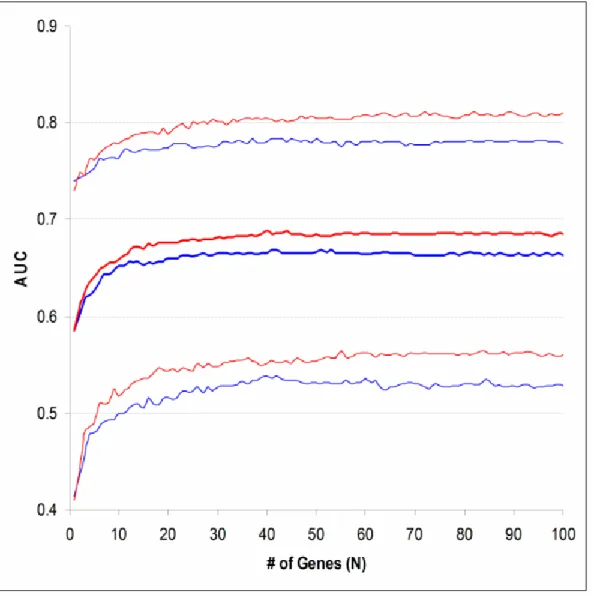
9. Bootstrapping ROC Curve Statistics Obtained from Lung Cancer Datasets...68
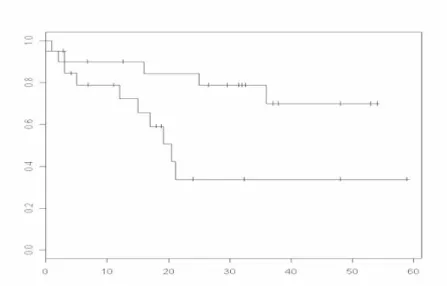
10. Comparison of Expression Profiling Strategies Using Survival Curves...70
11. Changing of Expression Profile Quality with Sensitivity and Specificity...72
12. Examples: Use Cases. ...78
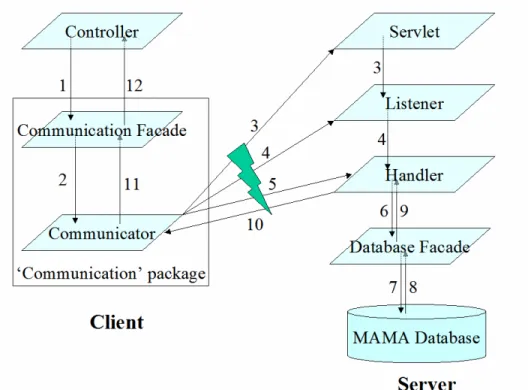
13. System Architecture...83
14. A Fraction of Database Schema...86
16. Software Architecture...93
17. Graphic User Interface of the Client Program...95
18. Demo: Database Query...102
19. Demo: Microarray Experiment Customization...104
20. Demo: Data Analysis Operation...106
CHAPTER I
INTRODUCTION
While many biomedical researchers agree that we are now at the dawn of a ‘Genomic Age’, there are still short of clear visions about how to fit high-throughput technologies, such as microarray, into the diagnosis, prognosis and treatment of diseases. A large number of experiments using these technologies have been carried out to generate information-rich datasets. Analysis of these datasets, however, barely brought us results applicable in medical practice. A quick response to this problem is probably that the technologies are still immature. However, before the technologies become ideal, researchers can still work on fundamental questions such as:
• Does high-throughput data really include helpful information for clinical decisions? If so, how valuable are they and what are their advantages and limitations?
• Have we dug out as much as possible meaningful information from experimental data having been generated? If we have not, what data analysis techniques can we use to fully take advantage of these data?
• What kind of evidences will we need to justify that information presented by high-throughput technologies is clinically informative, and what data analysis methods and protocols should be applied to collect these evidences?
• How much will these technologies change our current way of evaluating and treating disease?
The current study gave its answer to above questions by investigating the relationship between microarray data and cancer. As a complex disease, cancer is an ideal subject of genomic research because its initiation, progression, and metastasis have been related to a series of genomic disorders. A large number of studies have been carried out in recent years to find out gene expression patterns in tumors or tumor subtypes. This study applied its own strategies to re-analyze published microarray datasets about cancer with the purposes
different from those of the original studies. The process of identifying the expression patterns of samples is known as ‘gene expression profiling’. Identified patterns can be used to classify tumor tissues. For example, expression patterns obtained in this study were used to
distinguish breast cancer patients having good or poor prognosis. A strategy of gene expression profiling can be evaluated by the quality of expression patterns identified. An expression pattern of good quality should classify samples precisely and consistently. The theme of this study is how to achieve more accurate, reproducible and efficient expression profiling of tumor tissues. Two independent but related phases were carried out, both taking about the same efforts to accomplish.
In the first phase, published cancer microarray datasets were analyzed to verify two hypotheses:
1. Microarray data present extra clinical information that is not available via currently used methods.
2. It is feasible to perform gene expression profiling across multiple datasets to increase the overall sample size and quality of acquired profiles.
The first hypothesis was verified by proving that microarray data classified patients better than currently used clinical indexes. The confirmation of this hypothesis was the basis of all following steps, because if it is wrong, applying microarray technology to medical practice is not necessary. Although all similar studies should assume the correctness of this hypothesis too, few have verified it in their reports.
It was observed in early stage of this study that the contents of gene expression patterns were highly dependent on the clinical scenario of sample patients. The expression patterns of the same features, such as the recurrence outcome of cancer, varied substantially when they were obtained from different subpopulations of patients. Consequently, the usefulness of these patterns to general population is limited. The major cause of this observation, ironically, was that the size of most microarray datasets was too small to give reproducible results of expression profiling. This suggestion led to the hypothesis about multi-dataset microarray analysis. The confirmation of this hypothesis will allow researchers to comfortably reuse and combine existing datasets, so information unable to be obtained from individual datasets can be discovered. Furthermore, multi-dataset analysis is a potential solution to the issue about medical application of high-throughput technologies since it can provide stronger statistical evidences by covering various patient subpopulations.
The second phase of this study is the development of a software system called MAMA (Meta-Analysis of MicroArray). This project was motivated by the experience of the data analysis phase, which demonstrated that multi-dataset expression profiling was not technically straightforward. Systematic variation caused by experimental protocol to data annotation exists everywhere in independent microarray studies and datasets. Datasets collected from individual studies can be integrated together only after they have been
consistently annotated, processed and formatted. For biologists and statisticians whose primary interest is high-level data analysis, dealing with these issues is distracting and time-consuming. The MAMA system was developed to provide users a software environment within which they could simultaneously and conveniently investigate multiple microarray datasets. Collected cancer microarray datasets were stored in a relational database after they were re-processed and re-annotated according to pre-defined guidelines. This database was made accessible on the web by a server program that can handle concurrent requests of multiple clients. The MAMA client program was a software application for users to manipulate and analyze microarray datasets. It has a graphical user interface. Using this program, users can selectively download data from the server or directly import their own data, and work with these data on their local disk. High flexibility was a priority of
developing MAMA. For example, users were provided with programming interfaces to plug in their own data analysis methods. On the other hand, data objects were formally and consistently annotated. Popular sequence databases, such as GenBank and Unigene, were used to annotate nucleotide sequences; and controlled vocabularies, such as MGED ontology and NCI thesaurus, were used to describe biological samples. Implemented data analysis methods were focused on the correlation between genes and features of cancer samples, or other genes. Meta-analysis methods, such as combined tests and measures of effect size, were made available too.
This dissertation is organized into following chapters, which usually illustrate the data analysis and MAMA projects separately:
• Chapter 1. Introduction. • Chapter 2. Background:
o high-throughput technologies;
o literature review about gene expression profiling in cancer research;
o summary of standards, databases, and software used in microarray research. • Chapter 3: Methods:
o description of analyzed datasets;
o statistical methods and procedures used for data analysis; o software and standards used to develop MAMA.
• Chapter 4: Results and Discussions:
o pilot studies and the implications of their results;
o verification of hypothesis about clinical value of microarray technology; o verification of the advantages of multi-dataset gene expression profiling; o a novel strategy of performing and evaluating gene expression profiling; o sensitivity vs. specificity of reporter gene selection;
o vision, design and data model of MAMA system; o data analysis functions implemented in MAMA. • Chapter 5: Conclusion.
• Chapter 6: References. • Chapter 7: Glossary. • Chapter 8: Appendices:
o step-by-step data analysis procedure;
o reviews of software development tools and standards; o review of meta-analysis methods;
o design documents of MAMA project, such as use cases and database schema; o user guides of MAMA, such as software installation and method plug-in; o source codes and deliverables of MAMA.
CHAPTER II
BACKGROUND
2.1 Gene Expression Profiling of Cancer Tissues
Cancer threatens human life by destroying normal tissues with uncontrollableproliferation of malignant cells. While the disease is usually curable by surgery as long as the primary tumors are locally restrained, most cancer-related deceases are caused by metastasis: malignant cells escape from the primary tumor, enter lymphatic or vascular circulation, and establish inoperable secondary tumors at distant locations. Clinical decision about cancer treatment is mostly based on pathological observations of tumor status. The most referred to cancer clinical index is TNM classification, which categorizes cancer patients jointly
according to tumor size (T), local lymph node metastasis (N), and distant metastasis (M) [1]. Other common indexes, such as histological grade and angioinvasion, have been used as supplements of TNM system [2, 3].
The search for a general cure of cancer has become the biggest dilemma of biomedical research. On one side, the knowledge about the molecular basis of cancer has been
substantially improved after decades of enormous research effort. It is already known that cancer is caused by a series of genetic disorders, from point mutations to insertion/deletion to chromosome rearrangement [4-7]. Genetic defects destroy the balance between cell growth
and cell death, and transform normal cells into malignant. Therefore, the investigation of cancer-related genes, such as tumor-suppressor genes and oncogenes, has been the focus of cancer research for more than 10 years [8, 9]. Some of these genes have been used as
molecular markers in cancer clinics, such as p53 [10] and HER-2/neu [11]. On the other hand, discoveries in molecular biology have hardly benefited more cancer patients. Pathological indexes still dominate the diagnosis of cancer in clinics. Although the list of cancer-related genes is continuously growing, the addition of most new members was unable to improve the comprehensive image of malignancy transformation, advocating high genetic variability of cancer [12]. Regular laboratory approaches, which laboriously investigate a single gene or several closely linked genes at a time, have been proven ineffective to this complex and genomic-level disease. To improve cancer treatment, cancer patients should be classified based on genomic information produced by more efficient technologies.
Development of high-throughput technologies in recent years is about to bring biomedicine into a genomic age. These technologies have promising potentials in cancer research by allowing investigators examine cancer from a systematic perspective. CGH (Comparative Genomic Hybridization) is able to detect chromosomal gains and losses through the entire genome [13]. Chromosomal DNA obtained from both cancer and normal tissues is labeled with two fluorescent colors, and the difference in signal intensity indicates sequence deletion or amplification. Although array-based CGH has been developed to
improve the resolution of this technology [14], CGH is not suitable for detecting mutations of short sequences. Since point mutations are the most common chromosomal alteration,
genomic sequencing is a thorough solution for identifying genes mutated in cancer. However, the effort and cost of whole-genome screening are still impractical for most research facilities.
Technologies such as heteroduplex analysis and CSGE (Conformation Sensitive Gel
Electrophoresis) have been used as alternatives of sequencing for mutation detection [15-17]. While sequence information is mostly static, expression profiling technologies can describe the dynamic status of cancer cells at gene transcription level. SAGE (Serial Analysis of Gene Expression) and microarray have been used to generate source data of expression profiling. By assuming that 10-12 bp nucleotide sequences will uniquely represent most human transcripts, SAGE concatenates short cDNA fragments into sequencing vectors to constitute a SAGE library [18, 19]. The library will be sequenced to comprehensively quantify gene expression. SAGE constitutes an open system, so it can measure the expression of unknown or rarely-expressed genes in cells under investigation. Microarray is the most applied high-throughput technology in recent years. By fixing probes (synthesized oligonucleotides or sequences extracted from cDNA libraries) of transcripts onto a solid surface as tiny spots, microarray technology is able to simultaneously and efficiently measure the expression of thousands of genes [20-22]. Microarray is not as sensitive as SAGE because background noise on arrays makes the measurement of low abundance mRNA inaccurate, but it is less laborious and expensive. Individual microarray studies are usually able to measure
expression of genes in 20 to 200 samples. Therefore, in cancer research, microarray datasets are often used for classifying samples into categories such as cancer subtypes [23-26]. The protein-level genomic technology is proteomics, which relies on high-throughput platforms, such as array slides or 2-D electrophoresis gels, to simultaneously analyze a large number of proteins [27-29]. Proteomics has been used to classify biological samples as microarray, and to discover, identify, and quantify cancer biomarkers [30, 31]. Since proteins are the
functional units in cells, proteomics could be considered as the bridge connecting genomics and clinical medicine.
As a relatively mature high-throughput technology, microarray has been used to produce gene expression datasets about a variety of types of cancer. A common application of
microarray datasets is to identify gene expression patterns corresponding to the sample features under investigation, such as the recurrence of cancer. The process of identifying gene expression patterns is often referred to as ‘gene expression profiling’, which is characterized by the major trends in biomedical research: large datasets, computer-assisted data analysis, and integration of scientific domains including biomedicine, statistics, and information sciences. Because of its clinical prospects, expression profiling of cancer tissues has been extensively explored [32-35].
Statistical analysis plays a critical role in gene expression profiling. Clustering and reporter gene selection are two extensively applied techniques [36-38]. Clustering is
relatively more visual and straightforward, while reporter selection is usually more complex and has more variations. Methods having been used to reporter selection include simple hypothesis testing methods, such as Student or permutation t test [39, 40], ANOVA [41], and advanced models, such as Bayesian Networks [42] and Principal Component Analysis [43]. Selection of expression profiling methods should be determined according to the purposes of research and the characteristics of dataset. Complicated methods are not necessarily better than simple ones, and powerful methods usually make stricter assumptions on data than methods that are less powerful but more robust.
Analysis of microarray data also presents a challenge to traditional statistics because the number of variables (genes) in a microarray dataset is usually much larger than sample size.
Repeating a hypothesis test on a large number of variables will falsely reject the null hypothesis for some variables, an issue usually referred to as ‘multiple hypothesis testing’ [44]. For example, when a test is performed on each of 10,000 genes, averagely 100 genes will get a significant p-value less than 0.01 just because of the random distribution of data. Therefore, reporter gene lists derived from microarray datasets often include false positives. Decreasing the sample size or increasing the genes of a dataset will generally augment the rate of false positives in a reporter list. Reducing the size of the list will lift the specificity of reporter selection, but lessen the sensitivity at the same time. The ‘q-value’ index has been suggested to control the false positive rate of reporter selection by adjusting the test p-values by the number of tests performed [45, 46].
The following gives a quick literature review about cancer microarray studies using breast cancer as an example. Breast cancer is aroused by an accumulation of genetic mutations, and its initiation, invasion, progression, and metastasis are related, but distinct diseases. The complexity of breast cancer makes it an ideal subject of genomic-level research [47]. Gene expression profiling about breast cancer has drawn many research interests in recent years and a large number of studies have been reported. The focuses of microarray studies about breast cancer ranged from biological differentiation of different cell lines [48] or normal/tumor tissues [49], to clinical classification of tumors into subtypes using
expression profiles [49-52], to discovery of molecular markers and drug targets [53-56]. Since most breast cancer-related deaths are caused by recurrence and/or metastasis of disease, profiling of disease endpoints is clinically more valuable. It is a challenging topic at the same time because of the difficulty of predicting cancer outcome.
Practitioners usually measure and integrate a number of prognostic indexes to predict the outcome of breast cancer. The prediction guides the making of disease treatment decision, which is crucial for the quality of patients’ post-diagnosis life. Besides TNM classification, common prognostic indexes of breast cancer include age, ethnicity, grade, vascular invasion, and so on [57]. Moreover, molecular markers, such as HER2/neu and ER (Estrogen Receptor) status, have a growing utilization in the prognosis of breast cancer [57, 58]. For example, an extensive study (n>37,000) concluded that ER-negative patients were 7-times more likely to develop recurrent diseases than ER-positive patients after 5 years or more of adjuvant tamoxifen treatment [59]. However, currently used indexes often misclassify patients in terms of disease outcome because they are unable to describe the integral status of tumors with enough details. Microarray data, on the other hand, has the potential to characterize subtypes of cancer more specifically by making a census about gene expression in tumors.
Microarray studies have reported expression profiles related to outcome of breast cancer. Sørlie et al collected 85 tissue samples from breast cancer patients (78 cancers, three benign tumors, and four normal tissues), and categorized them with hierarchical clustering of their microarray data [49]. The categorization was supervised by post-diagnosis survival of patients. All samples were classified into 6 sub-groups and Kaplan-Meier survival curves of these sub-groups were significantly separated (p<0.01). Van‘t Veer et al applied different approaches to identify gene expression profiles associated to recurrence of breast cancer, during which the correlation between expression of each gene and 5-year prognosis was evaluated with statistical tests across 78 breast cancer patients [60]. Genes having the most significant correlation were selected as reporters of recurrence outcome. ‘Leave-one-out’ cross-validation was then applied to optimize the length of reporter gene list. The 70-gene
profile achieved optimal validation results. When the expression profile including these genes was used to classify patients, observed recurrence outcome of 65 out of 78 patients (83%) was correctly matched by the classification. Furthermore, when this profile was applied to a testing group of 19 patients, 17 patients (89%) was correctly classified. Although previous study acquired inspiring results, its weakness should also be noticed. The self-validation result might be an overfitting and the size of the testing group was too small to give enough statistical power. Furthermore, all sample patients were selected from a specific sub-population of breast cancer (lymph node negative, tumor size less than 5 cm, and age under 55 at diagnosis), so the expression profile obtained from these patients might not be generally applicable.
The dependence of gene expression profiles on clinical background of sample patients has been observed in microarray datasets. Gruvberger et al noticed that 165 out of 231 top-ranked genes in the study of van ‘t Veer had significant correlation with ER status of patients [61], and suggested that expression profiling should be performed separately on ER-positive and -negative patients. It has been reported that some clinical indexes, such as ER status and tumor size, ubiquitously influence the expression of genes in tumor cells [62, 63]. Therefore, these indexes are confounders of gene expression profiling. Since microarray data are
expected to provide extra clinical value beyond currently used indexes, expression profiles will be more valuable if the intervening effect of clinical scenarios is controlled. The suggestion of Gruvberger, though, is not an ultimate solution to this issue because there are other confounders of expression profiling besides ER status and it is not feasible to further split sample patients into subgroups corresponding to all confounders.
Both of the sample size and confounder issues discussed above put doubts on the general usability of expression profiles identified from individual datasets about cancer.
Consequently, recent microarray studies have been trying to give a solution by integrating multiple datasets. The advantages of data integration are apparent because it increases the overall sample size of data analysis. Furthermore, since research questions often need to be re-defined for data integration analysis, information not discovered by individual studies can be uncovered from integrated data. One of the most common techniques of data integration is meta-analysis [64, 65]. Meta-analysis is often referred to as ‘analysis of analyses’. It takes the results of individual studies as its inputs to carry out secondary analysis, and how those studies got their results is irrelevant to the process of meta-analysis.
Meta-analysis and other data integration strategies have been used in cancer microarray studies [66-69]. Ghosh et al investigated the consistence of four prostate cancer microarray datasets using a meta-analysis process [68]. They concluded that the profiles derived from these independent datasets shared significant similarity and proposed candidate gene pathways with the results. Microarray datasets of various cancer types were meta-analyzed by Rhodes et al [69]. They applied a comparative meta-profiling method to 40 published datasets with an overall sample size greater than 3,700. Gene expression profiles identified from these data were mapped to several characteristics of cancer tissues. For example, comparison of gene expression in cancer and normal tissues across 21 independent datasets and 12 cancer types recognized 67 genes that had significantly high possibility to be selected as reporters from individual datasets. The expression profile including these genes was proposed as a general gene expression signature of neoplastic transformation. Altogether,
previous results shed light on the possibility to combine multiple microarray datasets for more precise profiling.
Rhodes’ study implied that samples of disparate subpopulations might still share considerable commonness in terms of expression profiling results, which advocated the feasibility of integrated profiling of cancer outcomes. If a gene is highly correlated to a disease outcome in one patient subpopulation but not the others, its role in the integrated data will fade out as disparate patient cohorts are involved. On the other hand, genes whose correlation to an outcome is independent of clinical background of samples will have a bigger chance to be identified in integration analysis. Nevertheless, for multi-dataset expression profiling, it should be assumed that a common expression profile corresponding to the investigated output variable does exist regardless of the experimental design of individual studies and the substantial systematic variations between microarray datasets. Therefore, it is often necessary to re-define the output variables to make them proper for integration analysis. As a result, sample patients of the original studies may need to be filtered and re-categorized accordingly.
Categorizing cancer patients into prognosis groups is not as straightforward as it looks. In ideal situation, sample patients will be followed up until their disease endpoint is reached, so they can be unquestionably categorized. In the case of breast cancer, patients are considered as being cured if they keep recurrence-free long enough (usually 15 to 20 years) until their hazard to the disease is not greater than that of the general population. In clinics, however, outcome of cancer patients is often censored by short follow-up or incomplete medical record. Survival analysis is the most common method dealing with censored data [70]. It builds a Kaplan-Meier curve with follow-up data of each patient group and calculates test statistics
about the separation of curves. Survival analysis is statistically powerful since it takes all available follow-up information into account. However, its assumption about the constant effect of predictive index on output variable is not the fact in the case of cancer outcomes because survival and recurrence rates of cancer patients usually change from time to time. Alternatively, classifying patients into pre-defined prognosis groups would simplify the subsequent statistical analyses. The clinical convention is to categorize patients according to their 5-year follow-up. Patients who survive and keep disease-free for at least five years will be thought as having good prognosis and who die or recur within five years after diagnosis will be thought as having poor prognosis. Such a classification will exclude some sample patients from the following data analyses if they have not been followed up long enough to be categorized. Meanwhile, it will make the generating and validating of expression profiles more convenient, and if the cutoff value for classification is properly chosen, the
corresponding expression profiling could also be powerful. Nevertheless, it should be pointed out that the 5-year convention was established by usage rather than by any biological basis. Classifying sample patients arbitrarily regardless of their intrinsic difference in genetic background will considerably reduce the statistical power of gene expression profiling.
Retsky et al. investigated the follow-up data of 1,173 breast cancer patients and discovered that their recurrence rate had two peaks [71, 72]. The summits of these peaks were located at about 18 and 60 months after mastectomy, separated by a nadir around 50 months. It was also concluded that the appearance of this double-peaked distribution was independent of tumor size, number of positive nodes, and menopause status of patients. Computer simulation of tumor progression implied that this distribution might be caused by disparate dynamics of secondary tumor growth. It was proposed that early recurrence was
caused by mastectomy-initiated accelerated growth of secondary tumor, while the second peak was the result of steady stochastic transitions of tumor progression phases. It was further suggested that different treatment strategies should be applied to patients located in different peaks.
Since Retsky’s recurrence model is independent of clinical indexes, it could be
considered as applicable to general population of breast cancer. If the computer simulation model about growth of secondary tumors is true, patients respectively recurred during those two peaks have a good chance to be distinguished by their gene expression profiles.
Therefore, as an output variable for expression profiling, 3-year prognosis of breast cancer has better grounds than 5-year prognosis.
The medical application of microarray technology is at its very early stage. Researchers are actively bringing up new topics and methods in this field. The current study tried to verify that integration of microarray data from independent sources will improve expression profiling of cancer prognosis. A novel strategy of generating and validating gene expression profiles was developed and applied to two published microarray datasets about breast cancer. The two-peak recurrence model discovered by Retsky was adopted to make results more biologically meaningful and clinically beneficial. It was revealed after two datasets were integrated, not only selection of reporter genes had higher specificity, but also the expression profiles acquired were more predictive. Furthermore, when the same strategy was applied to four public microarray datasets about lung cancer, similar results were observed. It was also demonstrated that microarray data provide extra prognostic value besides commonly used indexes.
2.2 Microarray Standards, Databases and Software
Handling of microarray data is challenging for most biomedical researchers since it involves many aspects of information technologies. First, the structure of microarray datasets is complicated and has many variations. To describe a reproducible microarray dataset, metadata from experiment design to data processing strategy should be completely and unambiguously given. Consequently, standards of formally describing microarray datasets are necessary. Secondly, microarray datasets include slide images, raw measurements, processed data and other related data types, which make their structure complicate and their size big. Storage of microarray datasets in centralized repositories, such as databases, will give researchers quick and convenient data access. Finally, methods for presenting,processing and analyzing microarray data are various and often sophisticated. Packing these methods into computer software will save researchers from the trouble of implementing these methods by themselves.
MGED (Microarray Gene Expression Data) Society is the most active organization that creates microarray standards [73]. A series of standards established by MGED for annotating and exchanging microarray data are being widely used in microarray community. The
following is a brief introduction to these standards.
MIAME (Minimum Information About a Microarray Experiment) is the first standard proposed by MGED [74]. It is recommended to authors and editors of microarray
publications as a set of information necessary to reproduce microarray datasets. Particularly, MIAME requires for description of array and experiment design, samples, experiment protocols, and measured data. These requirements are summarized in MIAME checklist. MIAME is mostly conceptual. It neither structuralizes the contents of microarray datasets nor
specifies the standard vocabularies to describe them, which are respectively the goals of MGED MAGE (MicroArray and Gene Expression) and Ontology working groups.
MAGE has established two standards for structure of microarray data: MAGE-OM (Object Model) and MAGE-ML (Markup Language) [75]. MAGE-OM is a complex data model that defines over than 150 data types related to microarray experiments and the inter-relationship of these types. Its development follows the principles of UML (Unified
Modeling Language, Object Management Group, Inc.). MAGE-ML defines a set of XML (eXtensible Markup Language, World Wide Web Consortium) elements, which are
automatically derived from MAGE-OM. Hence, XML documents tagged with these elements can be exchanged between MAGE-compliant data systems. Although MAGE standards have covered most aspects about microarray datasets, they are mostly focused on the generation of microarray data and do not strongly support high-level data analysis. Furthermore, the
complexity of these standards makes them difficult to be implemented and may cause low performance of data processing programs.
The aim of MGED Ontology is to provide a set of defined and tree-structured terms for description of microarray-related concepts [76]. It has two major branches: core and extended. The core ontology is limited to the description of data objects covered in MAGE-OM while the extended one has a wider scope. Although a major part of MGEG Ontology has been put on the features of biological samples used in microarray experiments, the supplement of other controlled vocabularies is necessary to make unambiguous description of samples because the high diversity of biological entities. For example, NCBI (National Center for Biotechnology Information) Taxonomy database provides the official names of species and their categorization [77], and NCI (National Cancer Institute) Metathesaurus is a
resource summarizing cancer-related vocabularies. The probes or nucleotide sequences
included in array designs also need to be systematically annotated. Major sequence databases, such as GenBank [78] and Ensemble [79], have been used to annotate sequences in
microarray datasets. However, these databases often store multiple sequence records
belonging to the same genes and assign them different identifiers. Redundant appearance of a gene in an expression profile will reduce its sensitivity and artificially increase the weight of the gene, so it is better practice to condense data of redundant genes together for high-level analysis. Consequently, many researchers prefer annotating nucleotide sequences with systems developed for naming genes or gene products. NCBI Unigene database, which clusters GenBank sequences into a non-redundant set of genes, is such a system having been commonly used [80, 81]. Since individual studies use a variety of sequence annotation systems, mapping annotations between systems has became an ordinary data processing step in microarray studies.
Databases play a crucial role in the storage, distribution, and standardization of
microarray datasets. Public microarray databases are usually accessible via the web, so they have web-based interface for users to query for sequences, samples, experiments, and other data types. Some microarray databases also provide tools for data processing and analysis. Microarray data models such as MAGE-OM and RAD [82] have been taken as basis of database schemas.
SMD (Stanford Microarray Database) is the first major microarray database whose source codes were released [83-85]. Although it was initially developed to serve human and yeast researches at Stanford University, its application was extended to a much larger scope
and has been adopted by other institutes. SMD was not MAGE-compliant originally, but its later version supported the exchange of data formatted with MAGE-ML.
As more and more microarray studies are reported and their source data are available, the demand for centralized repository of published microarray datasets is increasing in research community. Two major bioinformatics organizations, NCBI and EBI (European
Bioinformatics Institute), discretely provided their solution to this requirement. GEO (the Gene Expression Omnibus) is a database established by NCBI [86]. It currently stores about half a billion gene expression measurements generated by microarray or SAGE. The
microarray database established by EBI is called ArrayExpress [87, 88]. The schema of ArrayExpress is consistent with MAGE-OM and other MGED standards including MIAME and MGED Ontology are also adopted by this database for data submission and description.
Data-mining functions are provided by some microarray databases as their supplement. For example, ONCOMINE is a system combining a microarray database with a data-mining platform for discovering gene expression patterns in cancer [89]. Establishment of this system dramatically accelerated subsequent data analyses. Studies based upon ONCOMINE database have been carried out successfully and reported [69, 90-92].
Computer software is a requisite part of microarray studies. To support their products, microarray hardware vendors such as Affymetrix, Inc. usually provide software tools for upstream handling of experimental results, such as image acquisition and in-chip
normalization [93-95]. On the other hand, a large number of computer programs are available for high-level microarray analysis. These programs have been developed as simple desktop tools to powerful enterprise systems. Popular statistical programming language including R
(www.r-project.org), MatLab (MathWorks, Inc.), and SAS (SAS Institute, Inc.) are also extensively applied in microarray researches.
GeneSpring GX (Aligent technologies, Inc.) is one of the most popular commercial microarray software. Like most of other business products, it has an attractive user interface and is relatively user-friendly. Besides rendering data with graphics, it implements various types of statistical methods, such as ANOVA and clustering, for identifying reporter genes or expression patterns. Furthermore, it provides programming interface that allows users to incorporate third party applications for data visualization or analysis. Although GeneSpring GX is gaining its popularity, sophisticated users may still feel that its functionality cannot fulfill their demand because of the rapid updating of data analysis techniques, which is probably the reason why most commercial microarray software did not succeed.
Allowing users to modify or extend the source codes to meet their special requirements, open-source software has become a major driving force of microarray research [96-100]. BioConductor is an R-based open source project for the analysis of microarray and other genomic data [100-103]. Its newest version includes over 100 software packages
implementing annotation, documentation, statistical analysis, and many other functions about genomic data. It should be pointed out that the quality of open source software varies.
Unsophisticated programs may mistakenly implement statistical methods or inaccurately interpret results. Therefore, open source programs should only be recommended to experienced users.
In spite of various options of microarray software, researchers often find it necessary to write programs by themselves, especially when they are developing new data analysis
methods or procedures. For example, the current study coded most programs used in its data analysis phase.
The MAMA (Meta-Analysis of MicroArray) system presented in this dissertation is an open-source platform supporting data-mining in cancer microarray datasets. It has three major components: a relational database, a server program, and a data analysis package. The MAMA database provides a centralized storage of microarray datasets about cancer and the server program made this database web-accessible. Unlike ONCOMINE, the focus of the MAMA project is its data analysis package that could be run as a desktop application. This application supported basic operations about microarray dataset such as data import/export and re-processing. Furthermore, it provided an open-source framework to satisfy diverse user requirements on its functionality. Similar to GeneSpring GX, MAMA allows users to plug in their own methods by implementing specified programming interface. A highlight of MAMA project was the availability of meta-analysis functions, which was realized by using MGED Ontology and other controlled vocabularies to describe data from independent sources. The MAMA system was expected to provide microarray researchers an easy-to-use and
CHAPTER III
METHODS
3.1 Data Analysis
3.1.1 Datasets and Data Pre-processing
This study analyzed published microarray datasets, including two from breast cancer patients [49, 60] and four from lung cancer patients [104-107]. All datasets provided clinical data about patients, such as disease follow-up and tumor size, in addition to microarray data. Cancer patients in each dataset were re-sampled and classified into two prognostic groups. Breast cancer patients who developed secondary tumors within three years after mastectomy were put into the poor prognosis group while patients who were followed up for at least three years and had no observed recurrence were classified as having good prognosis. Patients inappropriate to either group were excluded from this study. (See Appendix A.1 for demo of patient classification.) In the case of lung cancer, patients were classified according to their two-year survival outcome, and only adenocarcinoma patients were selected. Disease outcome of patients in all datasets was denoted as a dichotomous variable for all statistical analyses (0: good prognosis and 1: poor prognosis). The resulting sample sizes of all breast and lung datasets are summarized separately in Table 1A and 1B. Before analyzing these datasets, several data pre-processing steps were carried out. Sequences of all datasets were mapped to Unigene clusters and expression levels of redundant entries were averaged to
generate a set of genes without redundancy. In the case of breast cancer, there were 5,569 non-redundant Unigene clusters presented in both datasets. (See Appendix A.2 for demo of mapping sequences to Unigene.) Expression measurements having low quality and sequences unable to be mapped to Unigene were filtered out of the datasets. Ratio expression data of cDNA datasets were log10-transformed. Furthermore, expression measurements in each dataset were normalized for each patient and then for each gene, making the median
expression level of each patient or gene equal to 0.0 and the standard deviation equal to 1.0. (See Appendix A.3 for demo of expression data pre-processing.)
Table 1:
Microarray Datasets Used in This Study
Table 1A: Two Breast Cancer Datasets
Poor prognosis: patients recurred within three years after diagnosis; good prognosis: patients had no observed recurrence and were followed up for at least three years. Patients who were in the original datasets, but could not be categorized into either group were removed from this study.
Dataset [reference] / Platform Poor Prognosis Good Prognosis Total
Rosetta Breast [60] / cDNA 31 51 82
Stanford Breast [49] / cDNA 37 25 62
Total 68 76 144
Table 1B: Four Lung Cancer (Adenocarcinoma) Datasets
Poor prognosis: patients died within two years after diagnosis; good prognosis: patients survived after at least two years of follow-up. Only adenocarcinoma patients were selected. Patients who were in the original datasets, but could not be categorized into either group were removed from this study.
Dataset [reference] / Platform Poor Prognosis Good Prognosis Total
Harvard Lung [106] / Oligo 30 33 63
Michigan Lung [105] / Oligo 17 43 60
Stanford Lung [104] / cDNA 10 9 19
Ontario Lung [103] / cDNA 3 8 11
3.1.2 SEP: Score for Expression Profile
A designed variable, Score for Expression Profile or SEP, was defined as a qualifier of gene expression profiles. Given a profile with N reporter genes, the SEP of each patient was calculated as:
(1). SEP =
Σ
N[w
i∗ (X
i– E
i)]
In Formula (1), wi was the weight of ith gene in the profile. The sign of wi corresponded to a positive or negative correlation between ith gene and the output variable under
investigation while the magnitude of wi indicated its relative importance in a profile. Xi was the expression measurement of ith gene in the patient while Ei was its expected expression level. Since the output variable was dichotomous, Ei was the expression level that had equal probability to be found in either sample group and could be denoted as E (Xi | p+=p-=0.5). The Ei of each gene was empirically estimated from the training data. By using Formula (1), the difference between Xi and Ei of each gene in the profile was weighted and then be linearly summarized to obtain a SEP score. According to this process of calculating SEP, patients with poor prognosis were expected to have lower SEP scores than patients with good prognosis in general. SEP demonstrated its advantage in the current study as a numeric variable appropriate for common quantitative methods, such as chi-square test and 2-group comparison. Consequently, it was treated as a potential prognostic index, representing the information provided by microarray data. (See Appendix A.8 for calculation of SEP score.)
3.1.3 Correlation Analysis
Genes whose expression is highly correlated to an investigated sample feature can be considered as the reporters of that feature. Identifying reporter genes from a genome involves
procedure called ‘feature selection’, during which one or more statistical tests are applied to evaluate gene-feature correlation. Among all the methods used to evaluate correlation
between two variables, Pearson’s correlation is most common and straightforward [70]. It has the best performance when data follows linear distribution. Pearson’s correlation reports an r statistic as its result. After this r statistic is further transformed into a normally distributed t statistic, a p-value corresponding to a hypothesis testing about correlation can be acquired. In this study, reporters of an output variable were defined as those genes having the most significant p-values. (See Appendix A.5 for more details about correlation analysis.)
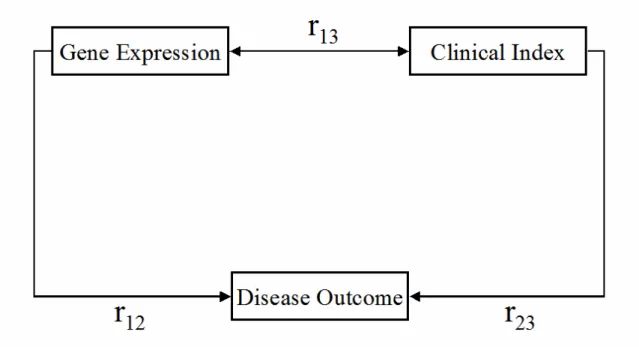
3.1.4 Partial Correlation Analysis
Partial correlation is a statistical technique used to control the effect of confounders out of the correlation between two variables [108]. In the case of cancer microarray analysis, it was observed that the correlation between gene expression and disease outcome varied with some clinical indexes (see Fig. 2), such as Estrogen Receptor (ER) status of breast tumors. This confounding effect causes the dependence of cancer expression profiles on the clinical scenarios of sample patients, and then reduces the reproducibility of profiles. A partial correlation analysis was proposed by this study, during which the gene-outcome correlation is re-evaluated after a confounding variable is controlled. The first step of this analysis is to transform each gene expression measurement to a residual using:
(2). X
residue= X
− E (X | controlled variable)
In Formula (2), X was the original expression measurement of a gene and E was the expected X given a known value of the controlled variable, such as positive or negative ER
of each gene were estimated by averaging X of all patients in each group. Subsequently, the partial correlation coefficient (r’) of each gene to the output variable was calculated using the residuals. Once each measurement in the original data matrix was transformed to a residual, the gene-outcome correlation will be re-calculated, with X replaced by Xresidual, to get a partial correlation coefficient (r’). The r’ statistic was considered the same as r through the subsequent analyses. Theoretically, Formula (2) could be reiterated until all the confounders were controlled. (See Appendix A.6 for more details about partial correlation analysis.)
3.1.5 Rank Sum Test
Since samples had only two outcome categories in this study, two-group comparison methods were potentially appropriate for calculating gene-output correlation. Wilcoxon Rank Sum Test (RST) [70] was used as the main method to evaluate differential expression of genes between opposite patient groups. As a non-parametric method, RST does not assume the normality of data as parametric methods, such as commonly used Student’s t test. Large portions of the genes in analyzed microarray datasets do not satisfy this assumption of
normality. Although non-parametric methods have less statistical power, such a disadvantage is insignificant if reporter genes are selected based on relative ranks of genes instead of their p-values. RST reports a Z statistic as its result. It first transforms all expression
measurements of a gene into ranks, and then calculates the Z statistic with the ranks assigned to the compared groups. When both groups have no less than eight observations, Z statistic follows standard normal distribution, so a corresponding p-value can be obtained. With the procedure used in this study, the Z statistic of a gene would be positive if it is generally over-expressed in good prognosis patients; otherwise, it would be negative. No matter which
statistical test was used, the resultant test statistics were used to rank genes. In this study, genes having the highest magnitude of Z statistics or the smallest p-values were selected as reporter genes. (See Appendix A.7 for guide of calculating RST Z statistic.)
3.1.6 Logistic Regression Model
Logistic regression is a statistical technique used to evaluate the predictive ability of independent variable(s) on a dependent variable having dichotomous outputs [108]. Building logistic regression models is process during which the best estimation of the parameters of a regression formula is achieved based on input data. The resultant model has a statistic called -2 Log Likelihood (-2LL), which is used to compare fitness of models to actual observation of an output variable. For a fixed sample size, a smaller -2LL represents better model fitness. A model is uni-variate if it has only one independent variable and is multi-variate if it
includes more than one independent variable. Models generated by this study utilized
available prognostic indexes including SEP as independent variables and disease outcome as the dependent variable. Multi-variate models were built using a forward stepwise procedure, during which independent variables were added into a model one by one in the sequence of their significance. The resultant −2LL of each step was recorded to trace the changing of model fitness. All models were generated using SAS System for Windows, Release 8.02 (SAS Institute, Inc.).
3.1.7 ROC Curve
ROC (Receptor Operating Characteristic) curve is a type of plot used to evaluate the accuracy of a clinical test [70]. It shows the tradeoff of sensitivity (true positive rate) and
specificity (true negative rate) when the test result is at each of its cutoff points. From a ROC curve, one can determine the false positive rate that needs to be tolerated to guarantee a certain sensitivity of a test. The curve is usually drawn from the lower left corner to the upper right corner in a 1.0Χ1.0 scale, so its AUC (Area Under the Curve) ranges from 0.0 to 1.0; the larger the AUC, the higher accuracy of a corresponding clinical test. A test will be ideal if its ROC curve has AUC equal to 1.0. In this study, the SEP scores of patients were
considered as the results of a clinical test based on microarray experiment, and ROC curves built with these scores were used to evaluate the clinical value of expression profiles.
3.1.8 Bootstrap Re-sampling Strategy
Some reporter genes selected into expression profiles could be false positives because of the issue of multiple hypothesis testing. Consequently, validating a profile with the same data used to generate it will cause overfitting in results. To avoid self-adaptive overfitting,
patients of each dataset were randomly re-sampled into training and testing subgroups. Thereafter, the expression profiles were generated from training data and validated with testing data. Although this strategy eliminated overfitting, it still had a major drawback. The random re-sampling process introduced bias into the profiling and validating results,
especially when the sample size of a dataset was small. A bootstrap strategy was applied to remove sampling bias by repeating the sampling-profiling-validating process a large number of times. Each bootstrapping repeat created an expression profile from the training data, which was used to calculate SEP scores of testing patients. SEP scores were used to classify patients and build an ROC curve, insulting in classification accuracy and AUC as test statistics to indicate the quality of the expression profile. These statistics obtained from all
bootstrapping repeats were summarized to get their median and 90% Confidence Interval (CI) values. Hence, this bootstrap re-sampling strategy allowed the objective and unbiased
comparison of gene expression profiles and the approaches used to generate them. Every bootstrapping repeat also assigned a Z statistic and a rank to each gene. These results were summarized to make a final ranking of all genes for entire dataset. Genes consistently getting significant Z values or top-ranked were selected as reporters. (See Appendix A.4 for demo of patient re-sampling.)
3.1.9 Gene Categorization According to Gene Ontology
Gene Ontology (GO) is an infrastructure of controlled vocabularies supporting unambiguous description of genes and their products [109]. All vocabularies of GO are organized as a tree-like structure with three roots: ‘Biological Processes’, ‘Cellular Components’, and ‘Molecular Functions’. GO allows researchers consistently and
conveniently query for attributes of a given gene, genes of a specific category, and even the associations between genes. In this study, reporter genes were categorized into the
‘Biological Processes’ domain of GO, which includes sub-categories such as Cell Cycle and Signal Transduction. The route of mapping Unigene clusters into GO categories was:
3.2 MAMA Project
3.2.1 Developmental StagesThe development of the MAMA (Meta-Analysis of MicroArray) project followed the common criteria of software engineering. It started with vision and requirement analyses, followed by use case analysis, system architecture design and data modeling. The database of MAMA was designed and implemented before developing a software application of data analysis. The sequential developmental stages of this application were software architecture design, package and class design, coding and testing. Other efforts involved in this project included loading data into database, User Interface (UI) design, and documentation.
3.2.2 Data Models
MAMA project used two data models to describe microarray data objects and their relationship. The data model adopted by the MAMA database is MAGE-OM (MicroArray Gene Expression – Object Model) [75]. MAGE-OM is a complex data model developed by MGED (Microarray Gene Expression Data) Society to facilitate the sharing of microarray data. It defines the concepts about most aspects of microarray-based experiments and their associations. (See Appendix B for more details about MAGE-OM classes.) Although the MAMA database is fully MAGE-compliant, only a minor portion of its tables have data loaded into them because the current project only dealt with the high-level analysis aspect of microarray data. Despite of the complexity of MAGE-OM, it is focused on the description of static data, but not the data analysis procedures. Therefore, the data analysis application needs its own data model. Since this application was coded with Java (J2SE, v1.4.2 Sun Microsystems Inc.), an oriented programming language, its data model has an
oriented tree structure. Specifically, its root class is called ‘Workspace’, within which various data manipulation and analysis operations can be performed by end users. Each Workspace includes various types of data objects, such as ‘Query’, ‘Experiment’, and ‘Analysis’. Each of these objects has its own contents and associations to other types of data. For example, a ‘Query’ object has attributes including its identifier, subtype, created date, and selection limits, and it can be related to a ‘Query Result’ object.
3.2.3 Relational Database
The database schema of MAMA included the schema of ArrayExpress [87, 88], a MAGE-OM-based public database. Denormalization tables were added to improve query performance. The MAMA database was implemented into an Oracle 9i (Release 9.0.1, Oracle Corporation) database system located on a Sun 280R server (Sun Microsystems Inc.). In the current version of MAMA, a server program interacts with this database using Java JDBC package to load or retrieve data. The open architecture of MAMA allows other developers to integrate other methods for these tasks. The MAMA database provides a centralized repository of public microarray datasets about cancer. End users have free, but limited, access to this database. They will be able to freely query about the stored microarray datasets or directly download complete datasets, but cannot modify existing data or load data into the database, which are the tasks of data curator and administrator.
3.2.4 Server Program
The MAMA server program is running as a Java servlet (J2EE Servlet Specification 2.3, Sun Microsystems Inc.) deployed in a Tomcat container (Apache Tomcat Version 4.1,
Apache Software Foundation). A servlet uses threads to handle concurrent requests sent by different clients and send back responses. (See Appendix C for more details about
Servlet/Tomcat server.) The server program interacts with the MAMA database with Java JDBC package to query or load data, and the client program accesses data in the database through the server. The server and client programs communicate with each other through a pre-defined protocol. Beyond the client program provided by the current build, other developers can write their own as long as this protocol is implemented.
3.2.5 Client Program
The MAMA client program is a data analysis application executable on any computer system running JVM (Java Virtual Machine). Although it requires network connection to retrieve data from MAMA database through the server program, this program can be used as a stand-alone application. End users can load microarray datasets into the client program either by downloading them from the MAMA database or by directly importing them from text files. Afterward, they will be able to save or work with loaded datasets on their local machine. The client program has a Graphical User Interface (GUI) programmed with Java Swing to improve its user-friendliness. The software development followed the MVC (Model-View-Controller) design pattern. The ‘Model’ package defined the Java classes for data objects and maintained them in a hierarchical structure, the ‘View’ package included GUI components, such as List and Table, to render data objects, and the ‘Controller’ package implemented handlers of user events that might modify the data objects and/or the GUI components. These packages encapsulate the functions of the client program and interact with each other through software interface. (See Appendix D for more details about MVC
design.) The MAMA client also includes a data analysis package, which implements the statistical methods of microarray analysis, such as Pearson’s correlation analysis or Student’s t test. These methods are called by the ‘Controllers’ in response to the initiation of data analysis operations. The Eclipse Platform (version 3.0.1, Eclipse contributors and others, http://www.eclipse.org), an open-source product, was used for the creation, organization, and compilation of Java source codes.
3.2.6 File Formats
The MAMA client program accepts and processes two file formats. The first one is tab-delimited text. It is the only data format accepted by the current build for data importing, and is also used for saving matrixes of expression measurements in ‘Workspaces’. The other format is XML (eXtensible Markup Language). XML documents organize data in
hierarchical structure and label them with defined tags. They are machine-readable files and proper for data exchange between different computer programs. The MAMA client uses XML for the storage of all data objects in ‘Workspaces’ except matrixes of expression measurements, whose amount is usually too large to be processed as XML documents. The current project did not define any schema or DTD (Data Type Definition) for XML
documents. Instead, it utilized the XML data-binding functions provided by Castor XML (version 0.9.6, Exolab Group, Intalio Inc., and Contributors), which could automatically map Java objects to XML documents or vice versa. The mapping rules were defined in an XML document, which can be downloaded together with the client program. (See Appendix L for Java-XML mapping with Castor.)
3.2.7 Open Source Framework
MAMA is an open-source project. Its source code will be freely downloadable. Furthermore, the three components of MAMA project: database, server, and client, are independent of each other, which means other researchers can develop their own programs to interact with any of these components as long as those proper interfaces to existing
components are implemented. The current version also provides a mechanism for users to plug in their own data analysis methods into the client program. The plug-in of a method includes two steps. The first step is to create a Java class that realizes the method. This class will be able to activate a procedure to run the method. It should also implement the API (Application Program Interface), which is designed for the method category belonged to by the method. Methods sharing the same API will have the same types of inputs and outputs. For example, all methods evaluating correlation between two genes will have two arrays of expression measurements that have the equal length as its inputs, and the value of a test statistic and its corresponding p-value as its outputs. The second step of method plug-in is to register the new method by providing information about its type, name, and path of Java class. A file including all registration information can also be downloaded together with the client program. (See Appendix O for more description of method plug-in.)
3.2.8 Meta-Analysis Methods
A key feature of MAMA data analysis software is the availability of meta-analysis methods. Meta-analysis is often referred to as ‘Analysis of Analyses’, a statistical technique that reviews the results from multiple individual studies to draw integrated conclusions. MAMA implemented two major types of meta-analysis methods: ‘combined tests’ and
‘measures of effect size’ [64]. Combined tests are applied to the results from individual studies, such as p-values, t and z test statistics, to obtain a combined test statistic. Examples of these tests are Fisher, Winer, and Stouffer combined tests, all of which were adopted by MAMA. Compared to combined tests, which provide only the statistical significance of hypothesis tests, measures of effect sizes are more informative because ‘effect size’ represents ‘the degree to which the null hypothesis is false’. Many meta-analysis methods have been developed to deal with two types of effect size: correlation coefficients (r) and standardized mean differences between two groups (d). These methods usually utilize r or d statistics obtained from individual studies to generate a summary statistic. (See Appendix E for more description of meta-analysis methods.)