Abstract—Non-intrusive load monitoring (NILM) is a critical problem in creating consumer awareness about electrical power consumption in households with the objective of eliminating wastage and reducing overall energy consumption in a society. Many approaches have been explored in non-intrusive load monitoring in recent times with a focus on machine learning of appliance-level details and user activity from analysis of aggregate power consumption. Several technologies and devices have also been developed to collect power consumption data and perform analysis on voltage and current waveforms. However, not much work has been done in analyzing NILM data against demographic parameters such as time of day or day of week as well as occupancy data of households. This article presents a novel approach to identifying active devices and predicting future power usage using demographic data in addition to aggregate power usage over time. We find that SVM (Support Vector Machine) with Edge Analysis works best for device identification and ARMA (Autoregressive Moving Average Model)works best for predicting future power consumption using time series forecasting. We have also collected real aggregate power consumption data from a typical household in India and produced perhaps the first such dataset.
Index Terms— Non-Intrusive Load Monitoring, Time series, Analytics, Machine Learning, Device Prediction, SVM, ARMA
I. INTRODUCTION
on-intrusive appliance load monitoring is the process of disaggregating a household’s total electricity consumption into its contributing appliances. A non-intrusive appliance load monitor determines the energy consumption of individual appliances turning on and off in an electric load, based on detailed analysis of the current and voltage of the total load, as measured at the interface to the power source.
The field of non-intrusive load monitoring was founded 25 years ago when Hart et al [17] proposed the first algorithm for the disaggregation of household energy usage. The motivations for such a process are threefold. First,
Manuscript received December 08, 2015; revised January 20, 2016. This work is supported in part by the World Bank/Government of India research grant under the TEQIP programme (subcomponent 1.2.1) to the Centre for Knowledge Analytics and Ontological Engineering (KAnOE), http://kanoe.org at PES University, Bangalore, India.
Kovvali Manasa Rao is a graduate student at the Department of Environmental Engineering, Arizona State University, Tempe, AS, USA (e-mail: [email protected]).
Durga Ravichandran is a graduate student in the Data Science Program, University of Southern California, Los Angeles, CA, USA (e-mail: [email protected]).
Dr. Kavi Mahesh is the Dean of Research, Director of KAnOE and Professor of Computer Science at PES University (phone: +91 9845290073 e-mail: [email protected]).
informing a household's occupants how much energy each appliance consumes and empowering them to take steps towards reducing their energy consumption. Second, personalized feedback can be provided which quantifies the savings from certain appliance-specific advice, such as the financial savings when an old inefficient appliance is replaced by a new efficient appliance. Third, if the NILM system is able to determine the time of use of each appliance, a recommender system would be able to inform the household's occupants of the savings in deferring appliance use to a time of day when electricity is either cheaper or has a lower carbon footprint.
In this area of research, the most important factor in its success is the availability of relevant data. The datasets we initially looked at were the REDD dataset (published by Carnegie Mellon University) [3], ComEd dataset (by Commonwealth Edison, Chicago) and ECO dataset (by Sweden Institute of Technology) [2]. As these datasets had attributes not suitable for the scenario in India, we took up an Indian dataset–iAME [4]. This dataset had power consumption readings for a single household for ten appliances over a month. However, this did not have the variability of data that we required in a training set for the proposed machine learning method for identifying an appliance. We then decided to collect our own dataset. This process had two main components: collecting training data and collecting test data.
The training data was automatically generated using a set of carefully designed rules to produce a tagged dataset. These rules decided what devices were turned on/off and at what time of the day. The rules were based on the inputs of time zone of the day, occupancy information of the house and seasons. Each day was divided into six time zones (e.g., early morning, evening prime time, late night, etc.). Occupancy information consisted of total members, number of children and number of working adults. Each month was associated with a season. Using these parameters as input we generated data for 10 households and for 30 common household appliances. This data gives us tags of appliances contributing to the total load at any point of time and hence can be used as our training set.
For our test set, we went for actual energy meter readings of a household. We procured a device called the OWL Wireless Energy Monitor. This device can be easily installed in a household at the point of mains supply. This device allows the data to be downloaded through a USB cable and stored. From this data we use the values of power and timestamp for preparing our test dataset which is cleaned and then used for our prediction algorithms.
The worldwide adoption of smart meters that measure and communicate residential electricity consumption enables the development of new energy efficiency services.
Non-Intrusive Load Monitoring and Analytics
for Device Prediction
Kovvali Manasa Rao, Durga Ravichandran, and Kavi Mahesh
Several particularly promising applications involve the disaggregation of individual appliances within a particular household in terms of their energy demand. In such work, load signatures are defined based on physical quantities such as apparent power, reactive power, real power and distortion power [1]. The devices in the house are then classified as resistive, capacitive and inductive. Signature length, peak voltage and current are important parameters that determine device signatures. An algorithm called 'Applisense' was developed that takes input from the smart meter. We have also developed a database of signatures for common household devices wherein each device activity is represented by its power consumption pattern. Given a power consumption pattern, it is compared with the signatures in the database to determine the device(s) being used. This work highlights the importance of the various physical quantities involved and the use of application signatures for machine learning to identify devices [15].
II. PREVIOUS WORK
A well-known household power consumption dataset - the REDD dataset from CMU was our first learning source for understanding energy dissociation datasets. This open source dataset has energy disaggregation data of 10 homes with a total of 119 days of data. This is a very informative dataset for device specific data in American households [3]. Another interesting work from Batra et al is NILMTK, an open source toolkit for Non-Intrusive Load Monitoring research on energy dissociation. Their work focused on parsing various energy monitoring datasets to arrive at a generalized way of analyzing data. The paper is especially insightful in making us understand the importance of voltage and current waveforms of devices that play an important role in training with device-specific data [4]. Though the works on handling NILM through voltage and current waveforms were yielding good results, in our work we carried out further experimentation on NILM with a different form of dataset that had significant demographic data rather than device specific data.
For test data collection, several options of devices were considered. The first under consideration was Wireless Energy Monitor for Smart or Digital Electricity Power Meters (EW4500) [14]. This device works on the basis of a light sensor. If the smart meter installed in a house has an LED that blinks on every watt used, the light sensor counts how many watts have been consumed thereby generating load monitoring data. This was not appropriate for our application since we needed more granularity in our data. Another reason not to adopt this device is that not all smart meters are equipped with such an LED. The second device that we considered was Eltrac. This device was mainly used for industrial purposes and hence not applicable to household energy meters. Finally, we chose the device OWL with USB Energy Monitor. It records the power reading without interrupting the working of the energy meter. No other external or internal wiring is required. The data can be downloaded through a USB connection .csv format which is convenient to process in a python program that we developed.
III. TRAINING DATA GENERATION
The active device prediction task required demographic data on the household and the power consumption of each device. Since there were no suitable datasets having time-wise logs of power consumption for household devices in Indian contexts, we decided to generate logs and create the training set based on domain knowledge.
The first task in generating the training data was to define 10 households with different demographics. The demographic attributes included the number of working members in the household, number of children and number of adults. The next step was to identify a common set of devices that are found in most Indian households. Thirty household devices with a fixed power rating for each type conforming to Indian standards were considered. With this, the goal was to generate minute-wise logs for a span of one year for all the 10 households that had some number of devices from the 30 devices chosen. The number of units of a device in a household was not limited to one. For example, a household could have two televisions or three air conditioning units.
We made a set of rules for each of the 30 devices based on the hour of the day, type of day (weekday or weekend), number of working members, number of children in the household, and so on, to conclude if the device was active or not (see Tables I and II). The rules also gave weights to certain attributes like type of day (i.e., working day, weekend, holiday) and hour of day to provide a realistic score to whether the device was active or not. Another interesting feature was that we fixed different thresholds for different devices to conclude if the device was active or not, wherein the device was logged to be active if the weighted score of attributes was beyond the threshold. The final training dataset obtained was a good collection of minute-wise power consumption logs of 10 different households for a span of one year.
IV. TEST DATA COLLECTION
V. ACTIVE DEVICE IDENTIFICATION
Given the data of total power consumed at a particular point in time, identifying major devices in the household that were or were not active is an interesting machine learning problem. With the training data generated, a classifier that could give us a multi-class output of what devices were active, and what devices were not, seemed to be the most appropriate choice. Another important aspect to solving the active devices identification problem involves choosing the right attributes or training the model with the appropriate form of data in order to get good results. Although a lot of work on training voltage and current waveforms in the past has yielded good results, the improvement in the current approach is the experimentation on adding household demographic information such as number of children, number of working members and time/event based attributes to the training model to obtain better results.
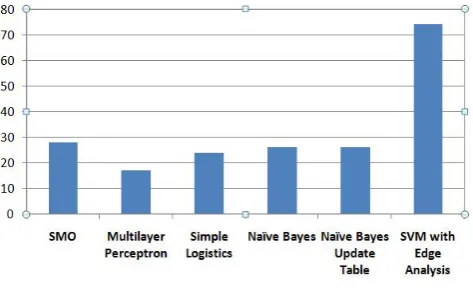
After experimenting with different classifiers like Naive Bayes, Artificial Neural Networks, Decision trees and Support Vector Machines (SVM), the SVM classifier with linear kernel gave the best results with an accuracy of 30% to correctly identify all the active devices in the household. Clearly, this was not satisfactory since the attributes on household demography, power consumption, type of day (working/non-working) and time zone (4 hour interval in a day; 6 in total) were not representative enough for device signatures which we aimed to identify. This led us to work on modifying and adding derived attributes for the classification task [6] [10] [11].
[image:3.595.50.287.559.703.2]To improve on the identification results, another attribute was added to the model, namely the time interval for which the power consumed remained constant [5]. This was informative since the training data replicates a transient waveform where each record depicts a change or an event of one or many devices being switched on or switched off. With this, there were clear edges to the data that helped in identifying a sharp rise in consumption and a continuous usage of a set of devices for a given period of time. When this data was used on the SVM with linear kernel classifier, it increased the prediction accuracy to about 70% which was a significant improvement over the conventional methods (see Fig. 1).
Fig. 1. Accuracies of Various Device Prediction Models
VI. TIME SERIES FORECASTING
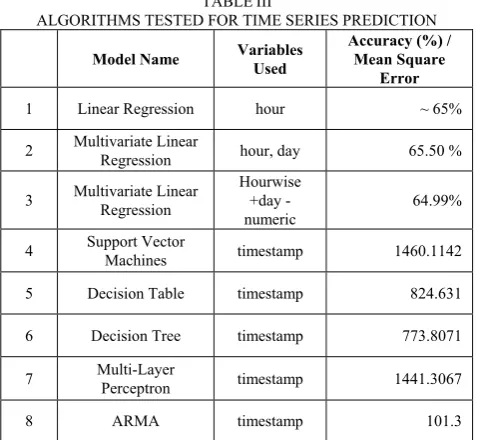
The energy consumption data collected can also be used to predict future consumption. For this we used time series forecasting (also known as time series prediction). Several algorithms were considered for implementing time series prediction. The algorithms tested were classified by the number of variables used for forecasting. The algorithms tested without using any variables were Support Vector Machines, Decision Table, Decision Tree and Multi-Layer Perceptron. These had high values for mean square error (see Table III). The univariate algorithms included ARMA (Autoregressive Moving Average Model) [8] which used timestamp as a variable and, Linear Regression that used hour as the variable. The multivariate algorithm used was Multivariate Linear Regression tested for two different sets of variables (Table III).
TABLEI
ATTRIBUTESOFLOADDATAFORDEVICEPREDICTION
Attribute_name Attribute_description
Timestamp Timestamp of when data was recorded. Year Year corresponding to timestamp Month Month corresponding to timestamp Date Date corresponding to timestamp Hour Timestamp of when data was recorded. Minute Year corresponding to timestamp Week_no Day of the week number corresponding to timestamp Power_consumed Power consumed by the device in that minute Device_id Device id for the database total_memebers No. of members in the household no_of_working_members No. of working members in the household no_of_children No. of children in the household
TABLEII
ATTRIBUTES FOR TIME SERIES PREDICTION
Attribute_name Attribute_description
Time Timestamp of when data was recorded. kW_Raw_Data Raw data value of kW
kW_Raw_Data_Min Minimum raw data value of kW kW_Raw_Data_Max Maximum raw data value of kW
ARMA was selected over the other methods due to its suitability to our dataset and high accuracy. ARMA is used for two purposes in our application, one for prediction of the current consumption and the other for prediction of the future consumption. ARMA consists of two parts, an autoregressive and a moving averages part. It is univariate with timestamp being chosen as the variable. ARMA uses the historical and current consumption patterns and predicts future consumption. The most essential feature of ARMA is that the current observation depends not only on the past observation but also the deviations occurring in the past observation. The future consumption is chosen using the feature of forecasting a random variable. The candidate with the lowest mean square error is chosen as the value for future consumption. This module reads time series data of minute-wise consumption of power by the household and creates an ARMA training model. Later, a test set is taken and the ARMA model object is used to predict the test set’s power consumption. Methods to choose frequency/ time series window are also provided. The accuracy obtained through ARMA was 90% (see Fig. 3).
Fig. 3. Mean Square Errors of Various Time Series Prediction Models TABLEIII
ALGORITHMS TESTED FOR TIME SERIES PREDICTION
Model Name Variables Used
Accuracy (%) / Mean Square
Error
1 Linear Regression hour ~ 65% 2 Multivariate Linear Regression hour, day 65.50 % 3 Multivariate Linear
Regression
Hourwise +day - numeric
64.99% 4 Support Vector Machines timestamp 1460.1142 5 Decision Table timestamp 824.631 6 Decision Tree timestamp 773.8071 7 Multi-Layer Perceptron timestamp 1441.3067 8 ARMA timestamp 101.3
Fig. 2 shows an interface for users to understand the power consumption for a given time frame and to predict future consumption provided that the current trends in consumption persist. It predicts the consumption in a minute
few modifications to the time series window to suit the data provided.
VII. RESULTS
After applying and analyzing the various models for time series prediction and device prediction, we found that the best results were given by Autoregressive Moving Average Model and Support Vector Machines with Edge Analysis for time series prediction and device prediction respectively. After using the above models, devices were predicted with an accuracy of 75% and future consumption was predicted with an accuracy of 90%.
Fig. 4. User Interface for Time Series Prediction Module
VIII. CONCLUSION
While training dataset and attribute selection is always an essential part of machine learning, integrating domain knowledge in solving problems is a novel aspect of this work. From generating training data with domain knowledge incorporated, and molding time-series data to train a classifier to perform better, our experiments have illustrated the importance of incorporating demographic data and event-based data to perform energy dissociation accurately in non-intrusive load monitoring. A major advantage of this method is not requiring device-specific data to predict device-wise activity. The results shown in this article are expected to see increasing relevance and usage given the growth of economical smart meter devices for households which provide only aggregate power data for the entire household. Further, the technology developed here is expected to become a key component in spreading awareness about power consumption of electrical appliances as the world embraces a greener approach to the generation and consumption of energy.
REFERENCES
[1] Markus Weiss, Adrian Helfenstein, FriedemannMattern, and Thorsten Staake. Leveraging smart meter data to recognize home appliances. Pervasive Computing and Communications (PerCom), 2012 IEEE International Conference
[2] Christian Beckel, Wilhelm Kleiminger, Romano Cicchetti, Thorsten Staake and Silvia Santini. The ECO Data Set and the Performance of Non-Intrusive Load Monitoring Algorithms. BuildSys’14, November 5–6, 2014
[image:4.595.51.287.307.449.2] [image:4.595.50.289.488.708.2][4] NipunBatra, Jack Kelly, Oliver Parson, Haimonti Dutta, William Knottenbelt, Alex Rogers, Amarjeet Singh and Mani Srivastava. NILMTK: An Open Source Toolkit for Non-intrusive Load Monitoring. ACM e-Energy 2014
[5] Lei Jiang, Jiaming Li, Suhuai Luo, Sam West and Glenn Platt. Power Load Event Detection and Classification Based on Edge Symbol Analysis and Support Vector Machine. Applied Computational Intelligence and Soft Computing Volume 2012 (2012)
[6] Scikitlearn. http://scikit-learn.org/stable/modules/svm.html [7] OpenGovernance India.
http://opengovernanceindia.org/cukjhnf/india-regional-electricity-statistics-fy-2000-01-to-fy2008-09
[8] PasapitchChujai, NittayaKerdprasop, and KittisakKerdprasop. Time Series Analysis of Household Electric Consumption with ARIMA and ARMA Models. IMECS 2013
[9] M.R. Braun, H. Altan, S.B.M. Beck. Using regression analysis to predict the future energy consumption of a supermarket in the UK. Applied EnergyVolume 130, 1 October 2014
[10] Weka.
http://www.ibm.com/developerworks/library/os-weka2/ [11] KNNclassifier.
http://www.fon.hum.uva.nl/praat/manual/kNN_classifiers_1_ _What_is_a_kNN_classifier_.html
[12] SaimaAman, Yogesh Simmhan, and Viktor K. Prasanna. Holistic Measures for Evaluating Prediction Models in Smart Grids. IEEE 2014
[13] Richard E. Edwards, Joshua Newb, Lynne E. Parker. Predicting future hourly residential electrical consumption: A machine learning case study. Elsevier Energy and Buildings, 2012
[14] Sean Barker, Mohamed Musthag, David Irwin, and Prashant Shenoy. Non-Intrusive Load Identification for Smart Outlets. SmartGridComm 2014
[15] Electrisense. https://prezi.com/wzbbrarqeifp/electrisense/ [16] Rosaria Silipo and Phil Winters. Time Series Prediction of
Smart Energy Data. Knime Whitepaper 2013